

Key Insights
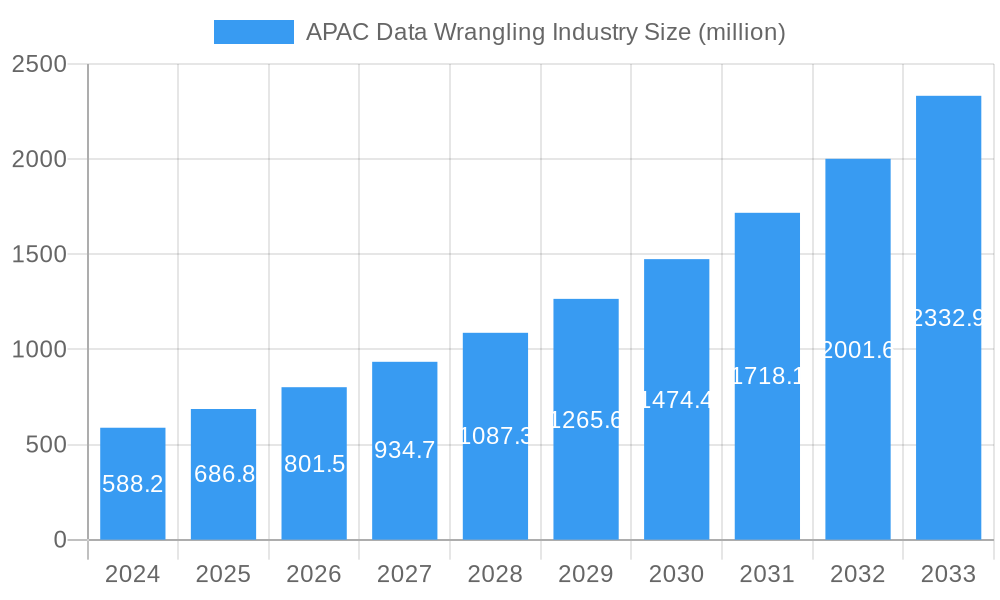
The APAC Data Wrangling market is poised for significant expansion, projected to reach an impressive USD 588.2 million in 2024, driven by a robust CAGR of 16.5%. This growth is underpinned by the escalating volume and complexity of data generated across diverse industries, compelling organizations to invest in efficient data preparation solutions. Key drivers include the increasing adoption of big data analytics, the burgeoning demand for data-driven decision-making, and the growing need for regulatory compliance in sectors like BFSI and Healthcare. As businesses in the region increasingly recognize the value of clean, accurate, and well-structured data for gaining competitive advantages, the adoption of data wrangling tools and services is accelerating. The market is characterized by a strong emphasis on automation, AI-powered capabilities, and cloud-based solutions, catering to the dynamic needs of enterprises of all sizes.
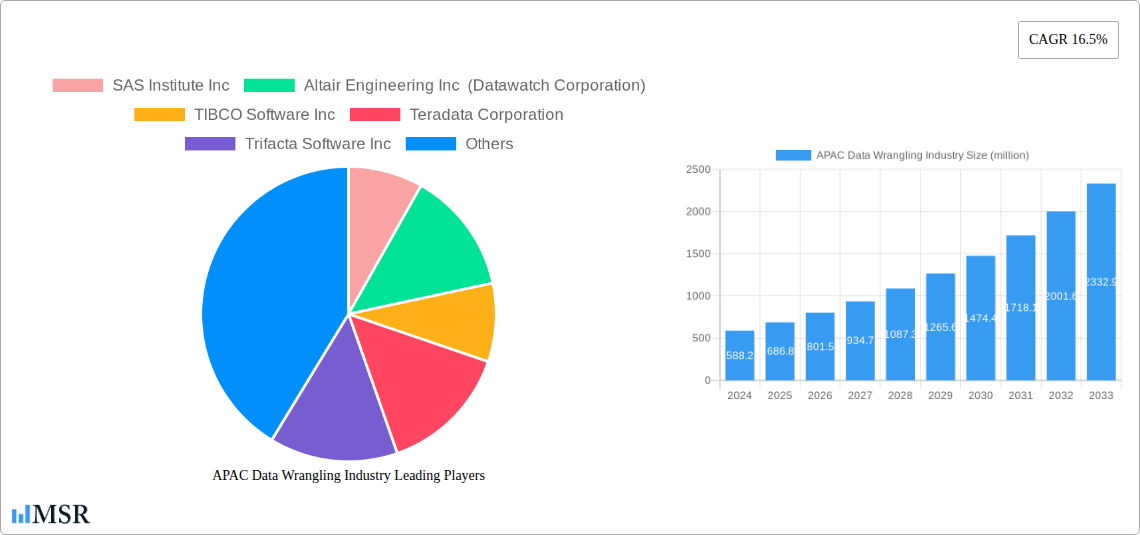
APAC Data Wrangling Industry Market Size (In Million)
The competitive landscape features prominent players such as SAS Institute Inc., Altair Engineering Inc., TIBCO Software Inc., and Oracle Corporation, alongside agile specialists like Trifacta Software Inc. and Alteryx Inc., all vying to capture market share. While the adoption of on-premises solutions persists, particularly among large enterprises with stringent data security requirements, cloud-based deployments are rapidly gaining traction due to their scalability, cost-effectiveness, and ease of integration. The IT and Telecommunication sector is leading the charge in data wrangling adoption, closely followed by Retail, Government, BFSI, and Healthcare. Emerging economies within APAC are also presenting substantial growth opportunities as digital transformation initiatives gain momentum, further fueling the demand for sophisticated data wrangling capabilities. The market's trajectory indicates a sustained period of innovation and strategic partnerships aimed at addressing the evolving data challenges faced by businesses in this dynamic region.
APAC Data Wrangling Industry Company Market Share
Unlock the future of data management in the Asia-Pacific region with our in-depth report on the APAC Data Wrangling Industry. This essential resource provides actionable intelligence for stakeholders seeking to capitalize on the explosive growth of data and the critical need for efficient data preparation. Our comprehensive analysis covers market dynamics, emerging trends, key segments, competitive landscapes, and strategic opportunities, leveraging high-ranking SEO keywords to ensure maximum visibility for "APAC data wrangling market," "data preparation tools APAC," "data integration services Asia," and "big data analytics APAC."
APAC Data Wrangling Industry Market Concentration & Dynamics
The APAC Data Wrangling Industry exhibits a dynamic market concentration, characterized by a mix of established players and emerging innovators. The innovation ecosystem is rapidly evolving, driven by advancements in artificial intelligence (AI) and machine learning (ML) for automated data cleaning and transformation. Regulatory frameworks across the APAC region are becoming more sophisticated, influencing data governance and privacy practices, crucial for data wrangling solutions. The availability of substitute products, such as manual data entry and basic spreadsheet tools, is diminishing as the complexity and volume of data necessitate specialized solutions. End-user trends show a significant shift towards data-driven decision-making across all sectors. Mergers and Acquisitions (M&A) activities are a key indicator of market consolidation and strategic expansion, with an estimated XX M&A deals observed during the historical period (2019-2024). The market share of leading data wrangling tools is projected to shift, with increased adoption of cloud-based solutions.
APAC Data Wrangling Industry Industry Insights & Trends
The APAC Data Wrangling Industry is experiencing unprecedented growth, fueled by the exponential rise in data generation across diverse sectors. The market size for data wrangling solutions in APAC is estimated to reach approximately USD XXX million by 2025, with a projected Compound Annual Growth Rate (CAGR) of XX% from 2025 to 2033. Technological disruptions are at the forefront of this expansion, with AI and ML-powered automated data cleansing, transformation, and enrichment features becoming standard. The integration of these advanced technologies significantly reduces manual effort, enhances accuracy, and accelerates the data preparation lifecycle. Evolving consumer behaviors, particularly the demand for personalized experiences and real-time analytics, are compelling businesses to invest heavily in robust data wrangling capabilities to derive actionable insights from vast datasets. The increasing adoption of cloud computing infrastructure is further simplifying data access and processing, lowering barriers to entry for advanced data wrangling tools and services. Moreover, government initiatives promoting digital transformation and the utilization of big data across various industries are acting as significant growth catalysts. The shift towards self-service data preparation platforms empowers business users, democratizing access to data insights and driving greater demand for intuitive and efficient data wrangling solutions. The expanding digital economy in countries like China, India, and Southeast Asian nations presents a fertile ground for data wrangling market penetration.
Key Markets & Segments Leading APAC Data Wrangling Industry
The APAC Data Wrangling Industry is witnessing robust growth across various segments, with Cloud deployment models emerging as the dominant force. This dominance is primarily driven by the inherent scalability, flexibility, and cost-effectiveness of cloud solutions, making them particularly attractive for businesses of all sizes. The ease of access and reduced infrastructure overhead associated with cloud-based data wrangling tools are significant economic growth drivers.
Deployment:
- Cloud: The widespread adoption of cloud infrastructure, coupled with the increasing demand for remote access and collaborative data processing, positions cloud deployment as the leading segment. This is further supported by the growing number of cloud-native data wrangling platforms.
- On-premises: While still relevant for organizations with strict data residency requirements or existing substantial on-premises investments, this segment is showing slower growth compared to cloud.
Component:
- Tools: The market for advanced data wrangling tools, encompassing features like automated profiling, cleansing, transformation, and enrichment, is experiencing substantial growth. These tools are crucial for extracting value from raw data.
- Services: Data wrangling services, including consulting, implementation, and managed services, are also vital, especially for large enterprises and SMEs seeking expert assistance in optimizing their data preparation workflows.
Enterprise Type:
- Large Enterprise: This segment remains a significant contributor due to the sheer volume of data they manage and their capacity for strategic investment in advanced data solutions.
- Small and Medium Enterprise (SME): SMEs are increasingly adopting data wrangling solutions, often leveraging cloud-based offerings, as they recognize the competitive advantage of data-driven decision-making.
End-User Industry:
- IT and Telecommunication: This sector consistently leads due to its inherent reliance on vast amounts of data for network management, customer analytics, and service optimization.
- BFSI (Banking, Financial Services, and Insurance): Driven by stringent regulatory compliance, fraud detection, risk management, and personalized customer offerings, the BFSI sector is a major adopter of data wrangling.
- Retail: The need for understanding consumer behavior, optimizing inventory, and personalizing marketing campaigns fuels significant demand in the retail industry.
- Government: Increasing digital transformation initiatives and the need for efficient public service delivery are driving government adoption.
- Healthcare: The growing volume of patient data, genomic information, and the pursuit of improved diagnostics and personalized medicine are making healthcare a key growth area.
The dominance of cloud deployment and the IT & Telecommunication and BFSI sectors is underpinned by rapid infrastructure development, economic growth, and the critical need for advanced analytics in these fields.
APAC Data Wrangling Industry Product Developments
The APAC Data Wrangling Industry is characterized by continuous product innovation, with a focus on AI and ML-driven automation for data cleansing, transformation, and enrichment. Leading vendors are enhancing their platforms with features that enable self-service data preparation, empowering business users with intuitive interfaces and guided workflows. Applications range from advanced predictive analytics and customer segmentation to fraud detection and regulatory compliance. Market relevance is driven by the increasing need for data accuracy, efficiency, and speed in deriving insights from complex datasets, providing a significant competitive edge to organizations that adopt these cutting-edge solutions.
Challenges in the APAC Data Wrangling Industry Market
The APAC Data Wrangling Industry faces several key challenges. Data quality issues stemming from disparate sources and inconsistent formats remain a persistent hurdle, often requiring significant manual intervention despite advanced tools. Talent shortages in data science and data engineering expertise limit the effective implementation and utilization of sophisticated data wrangling solutions across the region. Cybersecurity concerns and data privacy regulations, which vary significantly across APAC countries, introduce complexity and compliance burdens. Furthermore, the cost of advanced data wrangling tools and services can be prohibitive for some SMEs, impacting market penetration.
Forces Driving APAC Data Wrangling Industry Growth
Several key forces are propelling the growth of the APAC Data Wrangling Industry. The exponential increase in data generation from digital interactions, IoT devices, and business operations is the primary driver. Digital transformation initiatives across governments and enterprises are mandating the need for efficient data preparation. The growing adoption of AI and ML technologies for automated data wrangling is significantly enhancing efficiency and accuracy. Moreover, the increasing demand for data-driven decision-making across all industries to gain a competitive edge is a crucial catalyst.
Challenges in the APAC Data Wrangling Industry Market
Long-term growth catalysts for the APAC Data Wrangling Industry lie in the continued evolution and adoption of advanced AI and ML capabilities, leading to more autonomous and intelligent data preparation. Strategic partnerships and collaborations between technology providers and industry-specific consultancies will facilitate wider market penetration, especially among SMEs. The expansion of cloud infrastructure and 5G networks across the region will further enhance accessibility and performance of data wrangling solutions. As data becomes an increasingly valuable asset, organizations will prioritize investments in robust data governance and quality frameworks, further solidifying the demand for comprehensive data wrangling platforms.
Emerging Opportunities in APAC Data Wrangling Industry
Emerging opportunities in the APAC Data Wrangling Industry are abundant. The growth of the Internet of Things (IoT) in manufacturing, smart cities, and healthcare presents a massive new source of data requiring sophisticated wrangling. The increasing focus on explainable AI (XAI) is creating demand for data wrangling processes that ensure transparency and auditability. The expansion of e-commerce and digital payments in emerging APAC economies fuels the need for real-time data analytics. Furthermore, the growing adoption of data virtualization and data mesh architectures is creating new avenues for decentralized data wrangling.
Leading Players in the APAC Data Wrangling Industry Sector
- SAS Institute Inc
- Altair Engineering Inc
- TIBCO Software Inc
- Teradata Corporation
- Trifacta Software Inc
- Paxata Inc
- Alteryx Inc
- Oracle Corporation
- Talend Inc
Key Milestones in APAC Data Wrangling Industry Industry
- 2019: Increased investment in AI/ML for automated data cleansing and transformation features.
- 2020: Significant growth in cloud-based data wrangling solutions adoption due to remote work trends.
- 2021: Rise in M&A activities as larger players acquire innovative data wrangling startups.
- 2022: Enhanced focus on data governance and privacy features in response to evolving regulations.
- 2023: Introduction of self-service data preparation platforms for business users.
- 2024: Growing integration of data wrangling with big data analytics and business intelligence tools.
Strategic Outlook for APAC Data Wrangling Industry Market
The strategic outlook for the APAC Data Wrangling Industry is exceptionally strong. Growth will be accelerated by the continued digital transformation across all sectors and the increasing reliance on data for competitive advantage. Focus on enhancing AI/ML capabilities for predictive data quality and automated data pipeline management will be critical. Expanding partnerships with cloud providers and system integrators will broaden market reach. Furthermore, addressing the growing demand for specialized data wrangling solutions for emerging technologies like AI ethics and federated learning will unlock new market segments and solidify the industry's future growth trajectory.
APAC Data Wrangling Industry Segmentation
-
1. Component
- 1.1. Tools
- 1.2. Services
-
2. Deployment
- 2.1. On-premises
- 2.2. Cloud
-
3. Enterprise Type
- 3.1. Large Enterprise
- 3.2. Small and Medium Enterprise
-
4. End-User Industry
- 4.1. IT and Telecommunication
- 4.2. Retail
- 4.3. Government
- 4.4. BFSI
- 4.5. Healthcare
- 4.6. Other End-user Industries
APAC Data Wrangling Industry Segmentation By Geography
-
1. North America
- 1.1. United States
- 1.2. Canada
- 1.3. Mexico
-
2. South America
- 2.1. Brazil
- 2.2. Argentina
- 2.3. Rest of South America
-
3. Europe
- 3.1. United Kingdom
- 3.2. Germany
- 3.3. France
- 3.4. Italy
- 3.5. Spain
- 3.6. Russia
- 3.7. Benelux
- 3.8. Nordics
- 3.9. Rest of Europe
-
4. Middle East & Africa
- 4.1. Turkey
- 4.2. Israel
- 4.3. GCC
- 4.4. North Africa
- 4.5. South Africa
- 4.6. Rest of Middle East & Africa
-
5. Asia Pacific
- 5.1. China
- 5.2. India
- 5.3. Japan
- 5.4. South Korea
- 5.5. ASEAN
- 5.6. Oceania
- 5.7. Rest of Asia Pacific
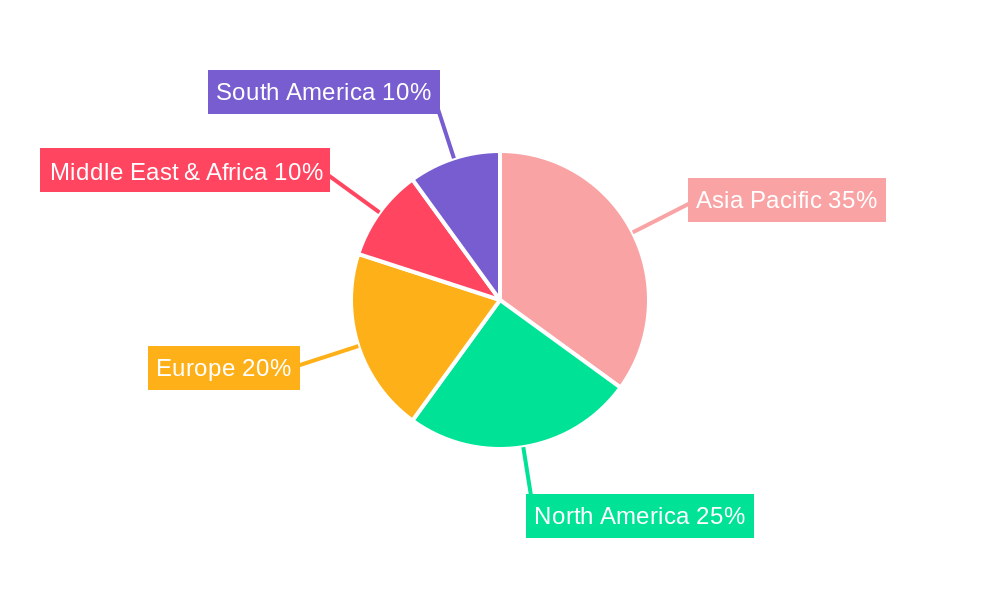
APAC Data Wrangling Industry Regional Market Share
Geographic Coverage of APAC Data Wrangling Industry
APAC Data Wrangling Industry REPORT HIGHLIGHTS
| Aspects | Details |
|---|---|
| Study Period | 2020-2034 |
| Base Year | 2025 |
| Estimated Year | 2026 |
| Forecast Period | 2026-2034 |
| Historical Period | 2020-2025 |
| Growth Rate | CAGR of 16.5% from 2020-2034 |
| Segmentation |
|
Table of Contents
- 1. Introduction
- 1.1. Research Scope
- 1.2. Market Segmentation
- 1.3. Research Objective
- 1.4. Definitions and Assumptions
- 2. Executive Summary
- 2.1. Market Snapshot
- 3. Market Dynamics
- 3.1. Market Drivers
- 3.2. Market Restrains
- 3.3. Market Trends
- 3.4. Market Opportunities
- 4. Market Factor Analysis
- 4.1. Porters Five Forces
- 4.1.1. Bargaining Power of Suppliers
- 4.1.2. Bargaining Power of Buyers
- 4.1.3. Threat of New Entrants
- 4.1.4. Threat of Substitutes
- 4.1.5. Competitive Rivalry
- 4.2. PESTEL analysis
- 4.3. BCG Analysis
- 4.3.1. Stars (High Growth, High Market Share)
- 4.3.2. Cash Cows (Low Growth, High Market Share)
- 4.3.3. Question Mark (High Growth, Low Market Share)
- 4.3.4. Dogs (Low Growth, Low Market Share)
- 4.4. Ansoff Matrix Analysis
- 4.5. Supply Chain Analysis
- 4.6. Regulatory Landscape
- 4.7. Current Market Potential and Opportunity Assessment (TAM–SAM–SOM Framework)
- 4.8. MSR Analyst Note
- 4.1. Porters Five Forces
- 5. Market Analysis, Insights and Forecast 2021-2033
- 5.1. Market Analysis, Insights and Forecast - by Component
- 5.1.1. Tools
- 5.1.2. Services
- 5.2. Market Analysis, Insights and Forecast - by Deployment
- 5.2.1. On-premises
- 5.2.2. Cloud
- 5.3. Market Analysis, Insights and Forecast - by Enterprise Type
- 5.3.1. Large Enterprise
- 5.3.2. Small and Medium Enterprise
- 5.4. Market Analysis, Insights and Forecast - by End-User Industry
- 5.4.1. IT and Telecommunication
- 5.4.2. Retail
- 5.4.3. Government
- 5.4.4. BFSI
- 5.4.5. Healthcare
- 5.4.6. Other End-user Industries
- 5.5. Market Analysis, Insights and Forecast - by Region
- 5.5.1. North America
- 5.5.2. South America
- 5.5.3. Europe
- 5.5.4. Middle East & Africa
- 5.5.5. Asia Pacific
- 5.1. Market Analysis, Insights and Forecast - by Component
- 6. Global APAC Data Wrangling Industry Analysis, Insights and Forecast, 2021-2033
- 6.1. Market Analysis, Insights and Forecast - by Component
- 6.1.1. Tools
- 6.1.2. Services
- 6.2. Market Analysis, Insights and Forecast - by Deployment
- 6.2.1. On-premises
- 6.2.2. Cloud
- 6.3. Market Analysis, Insights and Forecast - by Enterprise Type
- 6.3.1. Large Enterprise
- 6.3.2. Small and Medium Enterprise
- 6.4. Market Analysis, Insights and Forecast - by End-User Industry
- 6.4.1. IT and Telecommunication
- 6.4.2. Retail
- 6.4.3. Government
- 6.4.4. BFSI
- 6.4.5. Healthcare
- 6.4.6. Other End-user Industries
- 6.1. Market Analysis, Insights and Forecast - by Component
- 7. North America APAC Data Wrangling Industry Analysis, Insights and Forecast, 2020-2032
- 7.1. Market Analysis, Insights and Forecast - by Component
- 7.1.1. Tools
- 7.1.2. Services
- 7.2. Market Analysis, Insights and Forecast - by Deployment
- 7.2.1. On-premises
- 7.2.2. Cloud
- 7.3. Market Analysis, Insights and Forecast - by Enterprise Type
- 7.3.1. Large Enterprise
- 7.3.2. Small and Medium Enterprise
- 7.4. Market Analysis, Insights and Forecast - by End-User Industry
- 7.4.1. IT and Telecommunication
- 7.4.2. Retail
- 7.4.3. Government
- 7.4.4. BFSI
- 7.4.5. Healthcare
- 7.4.6. Other End-user Industries
- 7.1. Market Analysis, Insights and Forecast - by Component
- 8. South America APAC Data Wrangling Industry Analysis, Insights and Forecast, 2020-2032
- 8.1. Market Analysis, Insights and Forecast - by Component
- 8.1.1. Tools
- 8.1.2. Services
- 8.2. Market Analysis, Insights and Forecast - by Deployment
- 8.2.1. On-premises
- 8.2.2. Cloud
- 8.3. Market Analysis, Insights and Forecast - by Enterprise Type
- 8.3.1. Large Enterprise
- 8.3.2. Small and Medium Enterprise
- 8.4. Market Analysis, Insights and Forecast - by End-User Industry
- 8.4.1. IT and Telecommunication
- 8.4.2. Retail
- 8.4.3. Government
- 8.4.4. BFSI
- 8.4.5. Healthcare
- 8.4.6. Other End-user Industries
- 8.1. Market Analysis, Insights and Forecast - by Component
- 9. Europe APAC Data Wrangling Industry Analysis, Insights and Forecast, 2020-2032
- 9.1. Market Analysis, Insights and Forecast - by Component
- 9.1.1. Tools
- 9.1.2. Services
- 9.2. Market Analysis, Insights and Forecast - by Deployment
- 9.2.1. On-premises
- 9.2.2. Cloud
- 9.3. Market Analysis, Insights and Forecast - by Enterprise Type
- 9.3.1. Large Enterprise
- 9.3.2. Small and Medium Enterprise
- 9.4. Market Analysis, Insights and Forecast - by End-User Industry
- 9.4.1. IT and Telecommunication
- 9.4.2. Retail
- 9.4.3. Government
- 9.4.4. BFSI
- 9.4.5. Healthcare
- 9.4.6. Other End-user Industries
- 9.1. Market Analysis, Insights and Forecast - by Component
- 10. Middle East & Africa APAC Data Wrangling Industry Analysis, Insights and Forecast, 2020-2032
- 10.1. Market Analysis, Insights and Forecast - by Component
- 10.1.1. Tools
- 10.1.2. Services
- 10.2. Market Analysis, Insights and Forecast - by Deployment
- 10.2.1. On-premises
- 10.2.2. Cloud
- 10.3. Market Analysis, Insights and Forecast - by Enterprise Type
- 10.3.1. Large Enterprise
- 10.3.2. Small and Medium Enterprise
- 10.4. Market Analysis, Insights and Forecast - by End-User Industry
- 10.4.1. IT and Telecommunication
- 10.4.2. Retail
- 10.4.3. Government
- 10.4.4. BFSI
- 10.4.5. Healthcare
- 10.4.6. Other End-user Industries
- 10.1. Market Analysis, Insights and Forecast - by Component
- 11. Asia Pacific APAC Data Wrangling Industry Analysis, Insights and Forecast, 2020-2032
- 11.1. Market Analysis, Insights and Forecast - by Component
- 11.1.1. Tools
- 11.1.2. Services
- 11.2. Market Analysis, Insights and Forecast - by Deployment
- 11.2.1. On-premises
- 11.2.2. Cloud
- 11.3. Market Analysis, Insights and Forecast - by Enterprise Type
- 11.3.1. Large Enterprise
- 11.3.2. Small and Medium Enterprise
- 11.4. Market Analysis, Insights and Forecast - by End-User Industry
- 11.4.1. IT and Telecommunication
- 11.4.2. Retail
- 11.4.3. Government
- 11.4.4. BFSI
- 11.4.5. Healthcare
- 11.4.6. Other End-user Industries
- 11.1. Market Analysis, Insights and Forecast - by Component
- 12. Competitive Analysis
- 12.1. Company Profiles
- 12.1.1 SAS Institute Inc
- 12.1.1.1. Company Overview
- 12.1.1.2. Products
- 12.1.1.3. Company Financials
- 12.1.1.4. SWOT Analysis
- 12.1.2 Altair Engineering Inc (Datawatch Corporation)
- 12.1.2.1. Company Overview
- 12.1.2.2. Products
- 12.1.2.3. Company Financials
- 12.1.2.4. SWOT Analysis
- 12.1.3 TIBCO Software Inc
- 12.1.3.1. Company Overview
- 12.1.3.2. Products
- 12.1.3.3. Company Financials
- 12.1.3.4. SWOT Analysis
- 12.1.4 Teradata Corporation
- 12.1.4.1. Company Overview
- 12.1.4.2. Products
- 12.1.4.3. Company Financials
- 12.1.4.4. SWOT Analysis
- 12.1.5 Trifacta Software Inc
- 12.1.5.1. Company Overview
- 12.1.5.2. Products
- 12.1.5.3. Company Financials
- 12.1.5.4. SWOT Analysis
- 12.1.6 Paxata Inc
- 12.1.6.1. Company Overview
- 12.1.6.2. Products
- 12.1.6.3. Company Financials
- 12.1.6.4. SWOT Analysis
- 12.1.7 Alteryx Inc
- 12.1.7.1. Company Overview
- 12.1.7.2. Products
- 12.1.7.3. Company Financials
- 12.1.7.4. SWOT Analysis
- 12.1.8 Oracle Corporation
- 12.1.8.1. Company Overview
- 12.1.8.2. Products
- 12.1.8.3. Company Financials
- 12.1.8.4. SWOT Analysis
- 12.1.9 Talend Inc
- 12.1.9.1. Company Overview
- 12.1.9.2. Products
- 12.1.9.3. Company Financials
- 12.1.9.4. SWOT Analysis
- 12.1.1 SAS Institute Inc
- 12.2. Market Entropy
- 12.2.1 Company's Key Areas Served
- 12.2.2 Recent Developments
- 12.3. Company Market Share Analysis 2025
- 12.3.1 Top 5 Companies Market Share Analysis
- 12.3.2 Top 3 Companies Market Share Analysis
- 12.4. List of Potential Customers
- 13. Research Methodology
List of Figures
- Figure 1: Global APAC Data Wrangling Industry Revenue Breakdown (million, %) by Region 2025 & 2033
- Figure 2: Global APAC Data Wrangling Industry Volume Breakdown (K Unit, %) by Region 2025 & 2033
- Figure 3: North America APAC Data Wrangling Industry Revenue (million), by Component 2025 & 2033
- Figure 4: North America APAC Data Wrangling Industry Volume (K Unit), by Component 2025 & 2033
- Figure 5: North America APAC Data Wrangling Industry Revenue Share (%), by Component 2025 & 2033
- Figure 6: North America APAC Data Wrangling Industry Volume Share (%), by Component 2025 & 2033
- Figure 7: North America APAC Data Wrangling Industry Revenue (million), by Deployment 2025 & 2033
- Figure 8: North America APAC Data Wrangling Industry Volume (K Unit), by Deployment 2025 & 2033
- Figure 9: North America APAC Data Wrangling Industry Revenue Share (%), by Deployment 2025 & 2033
- Figure 10: North America APAC Data Wrangling Industry Volume Share (%), by Deployment 2025 & 2033
- Figure 11: North America APAC Data Wrangling Industry Revenue (million), by Enterprise Type 2025 & 2033
- Figure 12: North America APAC Data Wrangling Industry Volume (K Unit), by Enterprise Type 2025 & 2033
- Figure 13: North America APAC Data Wrangling Industry Revenue Share (%), by Enterprise Type 2025 & 2033
- Figure 14: North America APAC Data Wrangling Industry Volume Share (%), by Enterprise Type 2025 & 2033
- Figure 15: North America APAC Data Wrangling Industry Revenue (million), by End-User Industry 2025 & 2033
- Figure 16: North America APAC Data Wrangling Industry Volume (K Unit), by End-User Industry 2025 & 2033
- Figure 17: North America APAC Data Wrangling Industry Revenue Share (%), by End-User Industry 2025 & 2033
- Figure 18: North America APAC Data Wrangling Industry Volume Share (%), by End-User Industry 2025 & 2033
- Figure 19: North America APAC Data Wrangling Industry Revenue (million), by Country 2025 & 2033
- Figure 20: North America APAC Data Wrangling Industry Volume (K Unit), by Country 2025 & 2033
- Figure 21: North America APAC Data Wrangling Industry Revenue Share (%), by Country 2025 & 2033
- Figure 22: North America APAC Data Wrangling Industry Volume Share (%), by Country 2025 & 2033
- Figure 23: South America APAC Data Wrangling Industry Revenue (million), by Component 2025 & 2033
- Figure 24: South America APAC Data Wrangling Industry Volume (K Unit), by Component 2025 & 2033
- Figure 25: South America APAC Data Wrangling Industry Revenue Share (%), by Component 2025 & 2033
- Figure 26: South America APAC Data Wrangling Industry Volume Share (%), by Component 2025 & 2033
- Figure 27: South America APAC Data Wrangling Industry Revenue (million), by Deployment 2025 & 2033
- Figure 28: South America APAC Data Wrangling Industry Volume (K Unit), by Deployment 2025 & 2033
- Figure 29: South America APAC Data Wrangling Industry Revenue Share (%), by Deployment 2025 & 2033
- Figure 30: South America APAC Data Wrangling Industry Volume Share (%), by Deployment 2025 & 2033
- Figure 31: South America APAC Data Wrangling Industry Revenue (million), by Enterprise Type 2025 & 2033
- Figure 32: South America APAC Data Wrangling Industry Volume (K Unit), by Enterprise Type 2025 & 2033
- Figure 33: South America APAC Data Wrangling Industry Revenue Share (%), by Enterprise Type 2025 & 2033
- Figure 34: South America APAC Data Wrangling Industry Volume Share (%), by Enterprise Type 2025 & 2033
- Figure 35: South America APAC Data Wrangling Industry Revenue (million), by End-User Industry 2025 & 2033
- Figure 36: South America APAC Data Wrangling Industry Volume (K Unit), by End-User Industry 2025 & 2033
- Figure 37: South America APAC Data Wrangling Industry Revenue Share (%), by End-User Industry 2025 & 2033
- Figure 38: South America APAC Data Wrangling Industry Volume Share (%), by End-User Industry 2025 & 2033
- Figure 39: South America APAC Data Wrangling Industry Revenue (million), by Country 2025 & 2033
- Figure 40: South America APAC Data Wrangling Industry Volume (K Unit), by Country 2025 & 2033
- Figure 41: South America APAC Data Wrangling Industry Revenue Share (%), by Country 2025 & 2033
- Figure 42: South America APAC Data Wrangling Industry Volume Share (%), by Country 2025 & 2033
- Figure 43: Europe APAC Data Wrangling Industry Revenue (million), by Component 2025 & 2033
- Figure 44: Europe APAC Data Wrangling Industry Volume (K Unit), by Component 2025 & 2033
- Figure 45: Europe APAC Data Wrangling Industry Revenue Share (%), by Component 2025 & 2033
- Figure 46: Europe APAC Data Wrangling Industry Volume Share (%), by Component 2025 & 2033
- Figure 47: Europe APAC Data Wrangling Industry Revenue (million), by Deployment 2025 & 2033
- Figure 48: Europe APAC Data Wrangling Industry Volume (K Unit), by Deployment 2025 & 2033
- Figure 49: Europe APAC Data Wrangling Industry Revenue Share (%), by Deployment 2025 & 2033
- Figure 50: Europe APAC Data Wrangling Industry Volume Share (%), by Deployment 2025 & 2033
- Figure 51: Europe APAC Data Wrangling Industry Revenue (million), by Enterprise Type 2025 & 2033
- Figure 52: Europe APAC Data Wrangling Industry Volume (K Unit), by Enterprise Type 2025 & 2033
- Figure 53: Europe APAC Data Wrangling Industry Revenue Share (%), by Enterprise Type 2025 & 2033
- Figure 54: Europe APAC Data Wrangling Industry Volume Share (%), by Enterprise Type 2025 & 2033
- Figure 55: Europe APAC Data Wrangling Industry Revenue (million), by End-User Industry 2025 & 2033
- Figure 56: Europe APAC Data Wrangling Industry Volume (K Unit), by End-User Industry 2025 & 2033
- Figure 57: Europe APAC Data Wrangling Industry Revenue Share (%), by End-User Industry 2025 & 2033
- Figure 58: Europe APAC Data Wrangling Industry Volume Share (%), by End-User Industry 2025 & 2033
- Figure 59: Europe APAC Data Wrangling Industry Revenue (million), by Country 2025 & 2033
- Figure 60: Europe APAC Data Wrangling Industry Volume (K Unit), by Country 2025 & 2033
- Figure 61: Europe APAC Data Wrangling Industry Revenue Share (%), by Country 2025 & 2033
- Figure 62: Europe APAC Data Wrangling Industry Volume Share (%), by Country 2025 & 2033
- Figure 63: Middle East & Africa APAC Data Wrangling Industry Revenue (million), by Component 2025 & 2033
- Figure 64: Middle East & Africa APAC Data Wrangling Industry Volume (K Unit), by Component 2025 & 2033
- Figure 65: Middle East & Africa APAC Data Wrangling Industry Revenue Share (%), by Component 2025 & 2033
- Figure 66: Middle East & Africa APAC Data Wrangling Industry Volume Share (%), by Component 2025 & 2033
- Figure 67: Middle East & Africa APAC Data Wrangling Industry Revenue (million), by Deployment 2025 & 2033
- Figure 68: Middle East & Africa APAC Data Wrangling Industry Volume (K Unit), by Deployment 2025 & 2033
- Figure 69: Middle East & Africa APAC Data Wrangling Industry Revenue Share (%), by Deployment 2025 & 2033
- Figure 70: Middle East & Africa APAC Data Wrangling Industry Volume Share (%), by Deployment 2025 & 2033
- Figure 71: Middle East & Africa APAC Data Wrangling Industry Revenue (million), by Enterprise Type 2025 & 2033
- Figure 72: Middle East & Africa APAC Data Wrangling Industry Volume (K Unit), by Enterprise Type 2025 & 2033
- Figure 73: Middle East & Africa APAC Data Wrangling Industry Revenue Share (%), by Enterprise Type 2025 & 2033
- Figure 74: Middle East & Africa APAC Data Wrangling Industry Volume Share (%), by Enterprise Type 2025 & 2033
- Figure 75: Middle East & Africa APAC Data Wrangling Industry Revenue (million), by End-User Industry 2025 & 2033
- Figure 76: Middle East & Africa APAC Data Wrangling Industry Volume (K Unit), by End-User Industry 2025 & 2033
- Figure 77: Middle East & Africa APAC Data Wrangling Industry Revenue Share (%), by End-User Industry 2025 & 2033
- Figure 78: Middle East & Africa APAC Data Wrangling Industry Volume Share (%), by End-User Industry 2025 & 2033
- Figure 79: Middle East & Africa APAC Data Wrangling Industry Revenue (million), by Country 2025 & 2033
- Figure 80: Middle East & Africa APAC Data Wrangling Industry Volume (K Unit), by Country 2025 & 2033
- Figure 81: Middle East & Africa APAC Data Wrangling Industry Revenue Share (%), by Country 2025 & 2033
- Figure 82: Middle East & Africa APAC Data Wrangling Industry Volume Share (%), by Country 2025 & 2033
- Figure 83: Asia Pacific APAC Data Wrangling Industry Revenue (million), by Component 2025 & 2033
- Figure 84: Asia Pacific APAC Data Wrangling Industry Volume (K Unit), by Component 2025 & 2033
- Figure 85: Asia Pacific APAC Data Wrangling Industry Revenue Share (%), by Component 2025 & 2033
- Figure 86: Asia Pacific APAC Data Wrangling Industry Volume Share (%), by Component 2025 & 2033
- Figure 87: Asia Pacific APAC Data Wrangling Industry Revenue (million), by Deployment 2025 & 2033
- Figure 88: Asia Pacific APAC Data Wrangling Industry Volume (K Unit), by Deployment 2025 & 2033
- Figure 89: Asia Pacific APAC Data Wrangling Industry Revenue Share (%), by Deployment 2025 & 2033
- Figure 90: Asia Pacific APAC Data Wrangling Industry Volume Share (%), by Deployment 2025 & 2033
- Figure 91: Asia Pacific APAC Data Wrangling Industry Revenue (million), by Enterprise Type 2025 & 2033
- Figure 92: Asia Pacific APAC Data Wrangling Industry Volume (K Unit), by Enterprise Type 2025 & 2033
- Figure 93: Asia Pacific APAC Data Wrangling Industry Revenue Share (%), by Enterprise Type 2025 & 2033
- Figure 94: Asia Pacific APAC Data Wrangling Industry Volume Share (%), by Enterprise Type 2025 & 2033
- Figure 95: Asia Pacific APAC Data Wrangling Industry Revenue (million), by End-User Industry 2025 & 2033
- Figure 96: Asia Pacific APAC Data Wrangling Industry Volume (K Unit), by End-User Industry 2025 & 2033
- Figure 97: Asia Pacific APAC Data Wrangling Industry Revenue Share (%), by End-User Industry 2025 & 2033
- Figure 98: Asia Pacific APAC Data Wrangling Industry Volume Share (%), by End-User Industry 2025 & 2033
- Figure 99: Asia Pacific APAC Data Wrangling Industry Revenue (million), by Country 2025 & 2033
- Figure 100: Asia Pacific APAC Data Wrangling Industry Volume (K Unit), by Country 2025 & 2033
- Figure 101: Asia Pacific APAC Data Wrangling Industry Revenue Share (%), by Country 2025 & 2033
- Figure 102: Asia Pacific APAC Data Wrangling Industry Volume Share (%), by Country 2025 & 2033
List of Tables
- Table 1: Global APAC Data Wrangling Industry Revenue million Forecast, by Component 2020 & 2033
- Table 2: Global APAC Data Wrangling Industry Volume K Unit Forecast, by Component 2020 & 2033
- Table 3: Global APAC Data Wrangling Industry Revenue million Forecast, by Deployment 2020 & 2033
- Table 4: Global APAC Data Wrangling Industry Volume K Unit Forecast, by Deployment 2020 & 2033
- Table 5: Global APAC Data Wrangling Industry Revenue million Forecast, by Enterprise Type 2020 & 2033
- Table 6: Global APAC Data Wrangling Industry Volume K Unit Forecast, by Enterprise Type 2020 & 2033
- Table 7: Global APAC Data Wrangling Industry Revenue million Forecast, by End-User Industry 2020 & 2033
- Table 8: Global APAC Data Wrangling Industry Volume K Unit Forecast, by End-User Industry 2020 & 2033
- Table 9: Global APAC Data Wrangling Industry Revenue million Forecast, by Region 2020 & 2033
- Table 10: Global APAC Data Wrangling Industry Volume K Unit Forecast, by Region 2020 & 2033
- Table 11: Global APAC Data Wrangling Industry Revenue million Forecast, by Component 2020 & 2033
- Table 12: Global APAC Data Wrangling Industry Volume K Unit Forecast, by Component 2020 & 2033
- Table 13: Global APAC Data Wrangling Industry Revenue million Forecast, by Deployment 2020 & 2033
- Table 14: Global APAC Data Wrangling Industry Volume K Unit Forecast, by Deployment 2020 & 2033
- Table 15: Global APAC Data Wrangling Industry Revenue million Forecast, by Enterprise Type 2020 & 2033
- Table 16: Global APAC Data Wrangling Industry Volume K Unit Forecast, by Enterprise Type 2020 & 2033
- Table 17: Global APAC Data Wrangling Industry Revenue million Forecast, by End-User Industry 2020 & 2033
- Table 18: Global APAC Data Wrangling Industry Volume K Unit Forecast, by End-User Industry 2020 & 2033
- Table 19: Global APAC Data Wrangling Industry Revenue million Forecast, by Country 2020 & 2033
- Table 20: Global APAC Data Wrangling Industry Volume K Unit Forecast, by Country 2020 & 2033
- Table 21: United States APAC Data Wrangling Industry Revenue (million) Forecast, by Application 2020 & 2033
- Table 22: United States APAC Data Wrangling Industry Volume (K Unit) Forecast, by Application 2020 & 2033
- Table 23: Canada APAC Data Wrangling Industry Revenue (million) Forecast, by Application 2020 & 2033
- Table 24: Canada APAC Data Wrangling Industry Volume (K Unit) Forecast, by Application 2020 & 2033
- Table 25: Mexico APAC Data Wrangling Industry Revenue (million) Forecast, by Application 2020 & 2033
- Table 26: Mexico APAC Data Wrangling Industry Volume (K Unit) Forecast, by Application 2020 & 2033
- Table 27: Global APAC Data Wrangling Industry Revenue million Forecast, by Component 2020 & 2033
- Table 28: Global APAC Data Wrangling Industry Volume K Unit Forecast, by Component 2020 & 2033
- Table 29: Global APAC Data Wrangling Industry Revenue million Forecast, by Deployment 2020 & 2033
- Table 30: Global APAC Data Wrangling Industry Volume K Unit Forecast, by Deployment 2020 & 2033
- Table 31: Global APAC Data Wrangling Industry Revenue million Forecast, by Enterprise Type 2020 & 2033
- Table 32: Global APAC Data Wrangling Industry Volume K Unit Forecast, by Enterprise Type 2020 & 2033
- Table 33: Global APAC Data Wrangling Industry Revenue million Forecast, by End-User Industry 2020 & 2033
- Table 34: Global APAC Data Wrangling Industry Volume K Unit Forecast, by End-User Industry 2020 & 2033
- Table 35: Global APAC Data Wrangling Industry Revenue million Forecast, by Country 2020 & 2033
- Table 36: Global APAC Data Wrangling Industry Volume K Unit Forecast, by Country 2020 & 2033
- Table 37: Brazil APAC Data Wrangling Industry Revenue (million) Forecast, by Application 2020 & 2033
- Table 38: Brazil APAC Data Wrangling Industry Volume (K Unit) Forecast, by Application 2020 & 2033
- Table 39: Argentina APAC Data Wrangling Industry Revenue (million) Forecast, by Application 2020 & 2033
- Table 40: Argentina APAC Data Wrangling Industry Volume (K Unit) Forecast, by Application 2020 & 2033
- Table 41: Rest of South America APAC Data Wrangling Industry Revenue (million) Forecast, by Application 2020 & 2033
- Table 42: Rest of South America APAC Data Wrangling Industry Volume (K Unit) Forecast, by Application 2020 & 2033
- Table 43: Global APAC Data Wrangling Industry Revenue million Forecast, by Component 2020 & 2033
- Table 44: Global APAC Data Wrangling Industry Volume K Unit Forecast, by Component 2020 & 2033
- Table 45: Global APAC Data Wrangling Industry Revenue million Forecast, by Deployment 2020 & 2033
- Table 46: Global APAC Data Wrangling Industry Volume K Unit Forecast, by Deployment 2020 & 2033
- Table 47: Global APAC Data Wrangling Industry Revenue million Forecast, by Enterprise Type 2020 & 2033
- Table 48: Global APAC Data Wrangling Industry Volume K Unit Forecast, by Enterprise Type 2020 & 2033
- Table 49: Global APAC Data Wrangling Industry Revenue million Forecast, by End-User Industry 2020 & 2033
- Table 50: Global APAC Data Wrangling Industry Volume K Unit Forecast, by End-User Industry 2020 & 2033
- Table 51: Global APAC Data Wrangling Industry Revenue million Forecast, by Country 2020 & 2033
- Table 52: Global APAC Data Wrangling Industry Volume K Unit Forecast, by Country 2020 & 2033
- Table 53: United Kingdom APAC Data Wrangling Industry Revenue (million) Forecast, by Application 2020 & 2033
- Table 54: United Kingdom APAC Data Wrangling Industry Volume (K Unit) Forecast, by Application 2020 & 2033
- Table 55: Germany APAC Data Wrangling Industry Revenue (million) Forecast, by Application 2020 & 2033
- Table 56: Germany APAC Data Wrangling Industry Volume (K Unit) Forecast, by Application 2020 & 2033
- Table 57: France APAC Data Wrangling Industry Revenue (million) Forecast, by Application 2020 & 2033
- Table 58: France APAC Data Wrangling Industry Volume (K Unit) Forecast, by Application 2020 & 2033
- Table 59: Italy APAC Data Wrangling Industry Revenue (million) Forecast, by Application 2020 & 2033
- Table 60: Italy APAC Data Wrangling Industry Volume (K Unit) Forecast, by Application 2020 & 2033
- Table 61: Spain APAC Data Wrangling Industry Revenue (million) Forecast, by Application 2020 & 2033
- Table 62: Spain APAC Data Wrangling Industry Volume (K Unit) Forecast, by Application 2020 & 2033
- Table 63: Russia APAC Data Wrangling Industry Revenue (million) Forecast, by Application 2020 & 2033
- Table 64: Russia APAC Data Wrangling Industry Volume (K Unit) Forecast, by Application 2020 & 2033
- Table 65: Benelux APAC Data Wrangling Industry Revenue (million) Forecast, by Application 2020 & 2033
- Table 66: Benelux APAC Data Wrangling Industry Volume (K Unit) Forecast, by Application 2020 & 2033
- Table 67: Nordics APAC Data Wrangling Industry Revenue (million) Forecast, by Application 2020 & 2033
- Table 68: Nordics APAC Data Wrangling Industry Volume (K Unit) Forecast, by Application 2020 & 2033
- Table 69: Rest of Europe APAC Data Wrangling Industry Revenue (million) Forecast, by Application 2020 & 2033
- Table 70: Rest of Europe APAC Data Wrangling Industry Volume (K Unit) Forecast, by Application 2020 & 2033
- Table 71: Global APAC Data Wrangling Industry Revenue million Forecast, by Component 2020 & 2033
- Table 72: Global APAC Data Wrangling Industry Volume K Unit Forecast, by Component 2020 & 2033
- Table 73: Global APAC Data Wrangling Industry Revenue million Forecast, by Deployment 2020 & 2033
- Table 74: Global APAC Data Wrangling Industry Volume K Unit Forecast, by Deployment 2020 & 2033
- Table 75: Global APAC Data Wrangling Industry Revenue million Forecast, by Enterprise Type 2020 & 2033
- Table 76: Global APAC Data Wrangling Industry Volume K Unit Forecast, by Enterprise Type 2020 & 2033
- Table 77: Global APAC Data Wrangling Industry Revenue million Forecast, by End-User Industry 2020 & 2033
- Table 78: Global APAC Data Wrangling Industry Volume K Unit Forecast, by End-User Industry 2020 & 2033
- Table 79: Global APAC Data Wrangling Industry Revenue million Forecast, by Country 2020 & 2033
- Table 80: Global APAC Data Wrangling Industry Volume K Unit Forecast, by Country 2020 & 2033
- Table 81: Turkey APAC Data Wrangling Industry Revenue (million) Forecast, by Application 2020 & 2033
- Table 82: Turkey APAC Data Wrangling Industry Volume (K Unit) Forecast, by Application 2020 & 2033
- Table 83: Israel APAC Data Wrangling Industry Revenue (million) Forecast, by Application 2020 & 2033
- Table 84: Israel APAC Data Wrangling Industry Volume (K Unit) Forecast, by Application 2020 & 2033
- Table 85: GCC APAC Data Wrangling Industry Revenue (million) Forecast, by Application 2020 & 2033
- Table 86: GCC APAC Data Wrangling Industry Volume (K Unit) Forecast, by Application 2020 & 2033
- Table 87: North Africa APAC Data Wrangling Industry Revenue (million) Forecast, by Application 2020 & 2033
- Table 88: North Africa APAC Data Wrangling Industry Volume (K Unit) Forecast, by Application 2020 & 2033
- Table 89: South Africa APAC Data Wrangling Industry Revenue (million) Forecast, by Application 2020 & 2033
- Table 90: South Africa APAC Data Wrangling Industry Volume (K Unit) Forecast, by Application 2020 & 2033
- Table 91: Rest of Middle East & Africa APAC Data Wrangling Industry Revenue (million) Forecast, by Application 2020 & 2033
- Table 92: Rest of Middle East & Africa APAC Data Wrangling Industry Volume (K Unit) Forecast, by Application 2020 & 2033
- Table 93: Global APAC Data Wrangling Industry Revenue million Forecast, by Component 2020 & 2033
- Table 94: Global APAC Data Wrangling Industry Volume K Unit Forecast, by Component 2020 & 2033
- Table 95: Global APAC Data Wrangling Industry Revenue million Forecast, by Deployment 2020 & 2033
- Table 96: Global APAC Data Wrangling Industry Volume K Unit Forecast, by Deployment 2020 & 2033
- Table 97: Global APAC Data Wrangling Industry Revenue million Forecast, by Enterprise Type 2020 & 2033
- Table 98: Global APAC Data Wrangling Industry Volume K Unit Forecast, by Enterprise Type 2020 & 2033
- Table 99: Global APAC Data Wrangling Industry Revenue million Forecast, by End-User Industry 2020 & 2033
- Table 100: Global APAC Data Wrangling Industry Volume K Unit Forecast, by End-User Industry 2020 & 2033
- Table 101: Global APAC Data Wrangling Industry Revenue million Forecast, by Country 2020 & 2033
- Table 102: Global APAC Data Wrangling Industry Volume K Unit Forecast, by Country 2020 & 2033
- Table 103: China APAC Data Wrangling Industry Revenue (million) Forecast, by Application 2020 & 2033
- Table 104: China APAC Data Wrangling Industry Volume (K Unit) Forecast, by Application 2020 & 2033
- Table 105: India APAC Data Wrangling Industry Revenue (million) Forecast, by Application 2020 & 2033
- Table 106: India APAC Data Wrangling Industry Volume (K Unit) Forecast, by Application 2020 & 2033
- Table 107: Japan APAC Data Wrangling Industry Revenue (million) Forecast, by Application 2020 & 2033
- Table 108: Japan APAC Data Wrangling Industry Volume (K Unit) Forecast, by Application 2020 & 2033
- Table 109: South Korea APAC Data Wrangling Industry Revenue (million) Forecast, by Application 2020 & 2033
- Table 110: South Korea APAC Data Wrangling Industry Volume (K Unit) Forecast, by Application 2020 & 2033
- Table 111: ASEAN APAC Data Wrangling Industry Revenue (million) Forecast, by Application 2020 & 2033
- Table 112: ASEAN APAC Data Wrangling Industry Volume (K Unit) Forecast, by Application 2020 & 2033
- Table 113: Oceania APAC Data Wrangling Industry Revenue (million) Forecast, by Application 2020 & 2033
- Table 114: Oceania APAC Data Wrangling Industry Volume (K Unit) Forecast, by Application 2020 & 2033
- Table 115: Rest of Asia Pacific APAC Data Wrangling Industry Revenue (million) Forecast, by Application 2020 & 2033
- Table 116: Rest of Asia Pacific APAC Data Wrangling Industry Volume (K Unit) Forecast, by Application 2020 & 2033
Frequently Asked Questions
1. What is the projected Compound Annual Growth Rate (CAGR) of the APAC Data Wrangling Industry?
The projected CAGR is approximately 16.5%.
2. Which companies are prominent players in the APAC Data Wrangling Industry?
Key companies in the market include SAS Institute Inc, Altair Engineering Inc (Datawatch Corporation), TIBCO Software Inc, Teradata Corporation, Trifacta Software Inc, Paxata Inc , Alteryx Inc, Oracle Corporation, Talend Inc.
3. What are the main segments of the APAC Data Wrangling Industry?
The market segments include Component, Deployment, Enterprise Type, End-User Industry.
4. Can you provide details about the market size?
The market size is estimated to be USD 588.2 million as of 2022.
5. What are some drivers contributing to market growth?
Increasing Automation Trends in the Manufacturing Sector; Increased penetration of digitalization. coupled with growing demand for improved efficiency and reduced operating costs; Growing applications of RPA and AI.
6. What are the notable trends driving market growth?
Cloud is Expected to Witness Significant Growth.
7. Are there any restraints impacting market growth?
High initial cost of adoption; Lack of skilled personnel.
8. Can you provide examples of recent developments in the market?
N/A
9. What pricing options are available for accessing the report?
Pricing options include single-user, multi-user, and enterprise licenses priced at USD 4750, USD 4950, and USD 6800 respectively.
10. Is the market size provided in terms of value or volume?
The market size is provided in terms of value, measured in million and volume, measured in K Unit.
11. Are there any specific market keywords associated with the report?
Yes, the market keyword associated with the report is "APAC Data Wrangling Industry," which aids in identifying and referencing the specific market segment covered.
12. How do I determine which pricing option suits my needs best?
The pricing options vary based on user requirements and access needs. Individual users may opt for single-user licenses, while businesses requiring broader access may choose multi-user or enterprise licenses for cost-effective access to the report.
13. Are there any additional resources or data provided in the APAC Data Wrangling Industry report?
While the report offers comprehensive insights, it's advisable to review the specific contents or supplementary materials provided to ascertain if additional resources or data are available.
14. How can I stay updated on further developments or reports in the APAC Data Wrangling Industry?
To stay informed about further developments, trends, and reports in the APAC Data Wrangling Industry, consider subscribing to industry newsletters, following relevant companies and organizations, or regularly checking reputable industry news sources and publications.
Methodology
Step 1 - Identification of Relevant Samples Size from Population Database


Step 2 - Approaches for Defining Global Market Size (Value, Volume* & Price*)

Note*: In applicable scenarios
Step 3 - Data Sources
Primary Research
- Web Analytics
- Survey Reports
- Research Institute
- Latest Research Reports
- Opinion Leaders
Secondary Research
- Annual Reports
- White Paper
- Latest Press Release
- Industry Association
- Paid Database
- Investor Presentations

Step 4 - Data Triangulation
Involves using different sources of information in order to increase the validity of a study
These sources are likely to be stakeholders in a program - participants, other researchers, program staff, other community members, and so on.
Then we put all data in single framework & apply various statistical tools to find out the dynamic on the market.
During the analysis stage, feedback from the stakeholder groups would be compared to determine areas of agreement as well as areas of divergence