

Key Insights
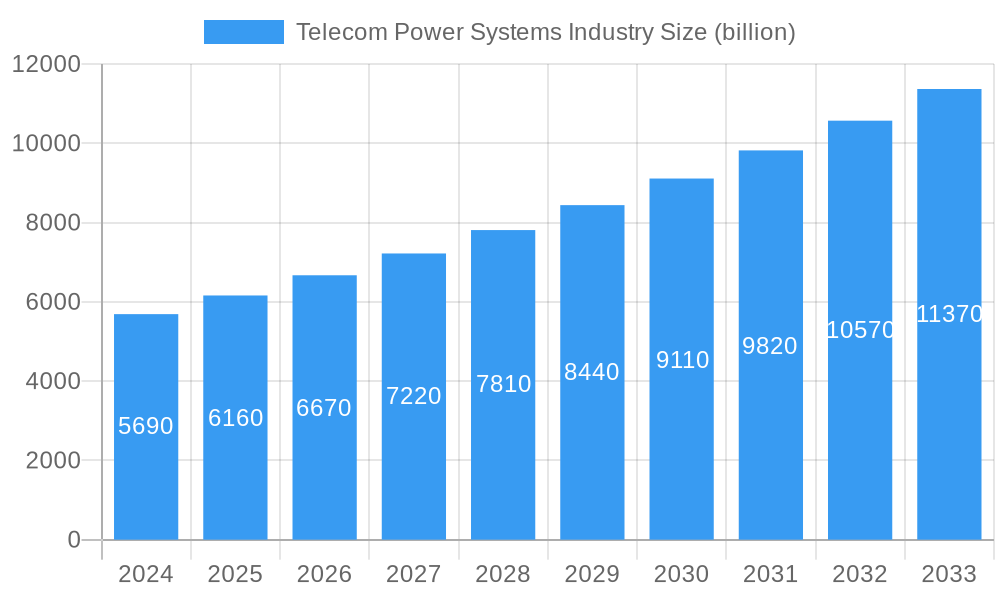
The global Telecom Power Systems market is projected for robust expansion, currently valued at an estimated $5.69 billion in 2024. Driven by the relentless demand for enhanced connectivity and the ever-increasing proliferation of mobile devices and data consumption, the market is set to experience a significant CAGR of 8.3% through 2033. Key growth catalysts include the ongoing deployment of 5G infrastructure, which requires more dense and power-efficient solutions, and the expansion of fiber-optic networks to support broadband services. Furthermore, the increasing adoption of renewable energy sources, such as solar and wind power, for telecom sites to reduce operational costs and environmental impact, represents a significant trend. The integration of advanced battery technologies for improved reliability and the development of intelligent power management systems are also shaping the market landscape. These advancements are crucial for ensuring uninterrupted service in a world that relies heavily on telecommunications for communication, commerce, and entertainment.
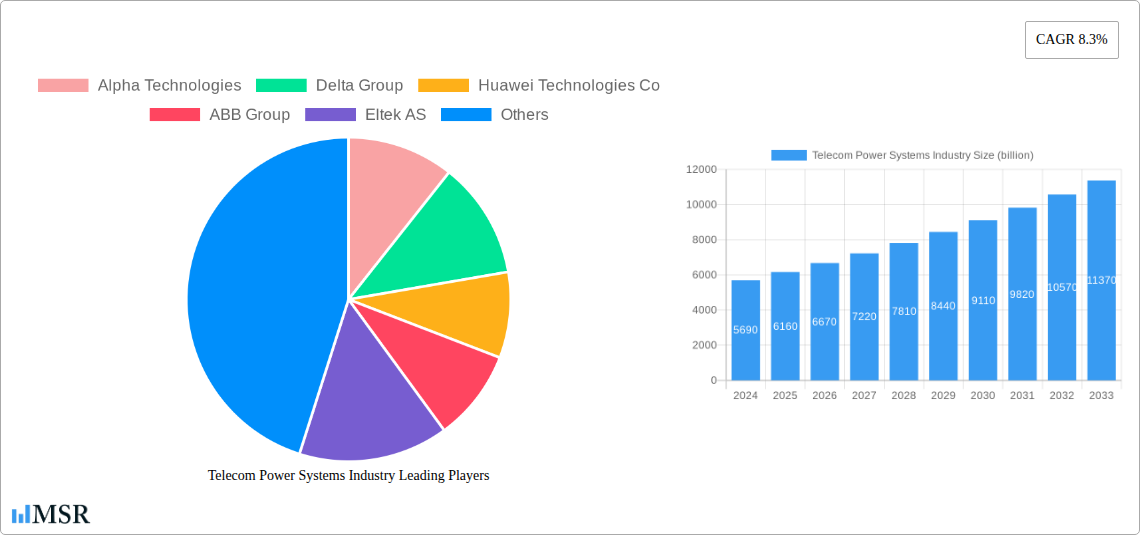
Telecom Power Systems Industry Market Size (In Billion)
The market's trajectory is further bolstered by the growing need for robust power solutions across various end-user applications, including access networks, core networks, and metro networks. While the market benefits from strong growth drivers, certain restraints, such as the high initial investment costs associated with upgrading power infrastructure and the complexities of integrating diverse power sources, could pose challenges. However, the strategic initiatives undertaken by leading companies like Huawei Technologies, ABB Group, and Schneider Electric, focusing on innovation and sustainable solutions, are expected to mitigate these concerns. The market's regional dynamics will likely see Asia Pacific leading in growth due to massive 5G rollouts and expanding digital infrastructure, followed by North America and Europe, which are also investing heavily in network modernization. Latin America and the Middle East and Africa present emerging opportunities as these regions focus on bridging the digital divide.
Telecom Power Systems Industry Company Market Share
This comprehensive report delves into the dynamic Telecom Power Systems Industry, offering unparalleled insights into market concentration, evolving trends, key segments, product innovations, challenges, growth drivers, and emerging opportunities. With a detailed analysis spanning the historical period (2019–2024), base year (2025), and an extensive forecast period (2025–2033), this study equips industry stakeholders with actionable intelligence to navigate the rapidly expanding global telecom infrastructure landscape. We provide precise data and forecasts on market size, expected to reach trillions of USD, and a projected Compound Annual Growth Rate (CAGR) of xx%, driven by the relentless demand for robust and efficient telecom power solutions.
Telecom Power Systems Industry Market Concentration & Dynamics
The Telecom Power Systems Industry exhibits a moderately concentrated market, with leading players such as Huawei Technologies Co, ABB Group, Eaton Corporation, and Schneider Electric holding significant market share, estimated at over 70% collectively. Innovation ecosystems are thriving, fueled by substantial R&D investments aimed at developing more efficient, reliable, and sustainable power solutions for the ever-expanding 5G infrastructure and data centers. Regulatory frameworks are becoming more stringent globally, pushing for greener energy sources and improved grid stability for telecom network power. The threat of substitute products, such as distributed renewable energy sources integrated directly into tower sites, is present but currently limited in its broad adoption for primary power. End-user trends are shifting towards highly resilient and low-latency power systems to support critical telecom services. Mergers and Acquisitions (M&A) activities, with an estimated XX deal counts in the historical period, are strategic moves by established players to expand their product portfolios and geographical reach, further influencing market dynamics.
Telecom Power Systems Industry Industry Insights & Trends
The Telecom Power Systems Industry is experiencing robust growth, propelled by the escalating demand for seamless and high-speed connectivity across the globe. The market size, projected to reach trillions of USD by the end of the forecast period, is underpinned by several critical growth drivers. The ongoing global rollout of 5G networks necessitates massive investments in new and upgraded power infrastructure to support increased data traffic and denser cell site deployments. Furthermore, the exponential growth in data consumption, fueled by an increasing number of connected devices and emerging applications like the Internet of Things (IoT), IoT devices, and edge computing, demands highly scalable and reliable power solutions for core network, metro network, and access network infrastructure. Technological disruptions are at the forefront, with advancements in battery energy storage systems (BESS), efficient power conversion technologies, and intelligent power management software playing a pivotal role. The industry is witnessing a significant push towards renewable energy integration, including solar and wind power, to reduce operational costs and carbon footprints, aligning with global sustainability initiatives. Evolving consumer behaviors, characterized by an expectation of uninterrupted connectivity and superior service quality, are pushing telecom operators to invest in highly resilient telecom backup power solutions and advanced power management systems. The increasing complexity of telecom sites, from microcells to macrocells, requires tailored power solutions across low power range, medium power range, and high power range to optimize efficiency and cost-effectiveness.
Key Markets & Segments Leading Telecom Power Systems Industry
The Telecom Power Systems Industry is witnessing significant traction across various key markets and segments. Dominant regions include North America and Asia-Pacific, driven by substantial investments in 5G infrastructure development, increasing broadband penetration, and a growing number of data centers.
Dominant Regions & Countries:
- Asia-Pacific: Fueled by rapid digitalization, government initiatives to expand digital connectivity, and the sheer volume of telecom deployments in countries like China, India, and South Korea. Economic growth and a burgeoning population demanding enhanced communication services are key drivers.
- North America: Characterized by advanced technological adoption, extensive 5G rollouts, and a mature market for data centers, requiring sophisticated power management. The presence of leading telecom operators and technology providers further solidifies its dominance.
Dominant Segments:
End-user Application:
- Access: This segment is experiencing the most significant growth due to the widespread deployment of 5G base stations, small cells, and fiber-to-the-home (FTTH) networks. The need for reliable power at the edge of the network to support high bandwidth and low latency services is paramount.
- Core: While mature, the core network segment continues to demand high-capacity and highly resilient power solutions to handle the aggregation of traffic from access and metro networks. Investments in upgrading existing core infrastructure to support future bandwidth demands are ongoing.
- Metro: This segment, bridging access and core, is critical for efficient data routing and aggregation within urban areas. The increasing density of users and the deployment of services like edge computing are driving demand for robust metro power systems.
Power Range:
- Medium Power Range: This category is crucial for a wide array of telecom deployments, including macrocell base stations and smaller data centers, offering a balance of capacity and efficiency.
- High Power Range: Essential for large-scale data centers, core network facilities, and major switching centers, where continuous, high-capacity power delivery is non-negotiable.
Telecom Power Systems Industry Product Developments
Product innovations in the Telecom Power Systems Industry are focused on enhancing efficiency, reliability, and sustainability. Advancements in lithium-ion battery technology are leading to lighter, more energy-dense, and longer-lasting energy storage solutions for telecom backup power. Intelligent power management software, incorporating AI and machine learning, is enabling predictive maintenance and optimized energy consumption. Furthermore, the integration of renewable energy sources, such as highly efficient solar power solutions for telecom towers, is becoming increasingly sophisticated. These developments offer competitive edges by reducing operational expenses, improving uptime, and contributing to environmental sustainability in the deployment of telecom infrastructure power.
Challenges in the Telecom Power Systems Industry Market
The Telecom Power Systems Industry faces several challenges that can impact market growth and adoption. Regulatory hurdles related to grid integration and environmental compliance can slow down deployments. Supply chain disruptions, as witnessed in recent years, can affect the availability and cost of critical components. Intense competitive pressures from both established players and emerging innovators can lead to pricing erosion. Furthermore, the high upfront capital investment required for advanced power solutions can be a significant barrier for some operators, impacting the adoption of cutting-edge telecom power equipment.
Forces Driving Telecom Power Systems Industry Growth
Several key forces are propelling the Telecom Power Systems Industry forward. The relentless global demand for enhanced mobile broadband and the widespread adoption of 5G services are primary drivers, necessitating continuous investment in network infrastructure. The burgeoning data center market and the rise of edge computing are creating significant demand for reliable and scalable power solutions. Government initiatives and policy support for digital transformation and connectivity infrastructure, such as India's GatiShakti Sanchar portal for streamlined right of way approvals, are accelerating deployment. Technological advancements in renewable energy integration and energy efficiency are also fostering growth by offering cost-effective and sustainable power options.
Challenges in the Telecom Power Systems Industry Market
Long-term growth in the Telecom Power Systems Industry hinges on several strategic catalysts. Continued technological innovation in areas like advanced energy storage, smart grid integration, and fuel cell technology will be crucial. Strategic partnerships and collaborations between telecom operators, power solution providers, and renewable energy companies can unlock new deployment models and market opportunities. Market expansion into underserved regions and the development of tailored solutions for diverse environmental conditions will further fuel growth. The increasing focus on energy efficiency and sustainability within the telecom sector will also drive demand for advanced power systems.
Emerging Opportunities in Telecom Power Systems Industry
Emerging opportunities in the Telecom Power Systems Industry are abundant. The expansion of satellite internet constellations and the growing need for reliable power at remote ground stations present new avenues. The development of integrated power solutions for the evolving metaverse and advanced augmented reality (AR) and virtual reality (VR) applications will require highly robust and low-latency power. The increasing adoption of electric vehicles (EVs) and the demand for charging infrastructure, often integrated with telecom sites, offer synergistic opportunities. Furthermore, the growing emphasis on circular economy principles and the development of sustainable telecom power recycling and refurbishment programs are creating niche markets.
Leading Players in the Telecom Power Systems Industry Sector
- Alpha Technologies
- Delta Group
- Huawei Technologies Co
- ABB Group
- Eltek AS
- Cummins Inc
- ZTE Corporation
- Schneider Electric
- Efore Group
- Eaton Corporation
Key Milestones in Telecom Power Systems Industry Industry
- December 2022: Telecom Egypt and Grid Telecom announced a collaboration agreement to build a subsea system connecting Egypt and Greece, highlighting the critical role of robust power infrastructure in enabling intercontinental connectivity.
- May 2022: The Minister for Communications, Electronics, and Information Technology (MietY) launched the GatiShakti Sanchar portal for centralized right of way (RoW) approvals, a significant development aimed at accelerating telecom infrastructure deployment, particularly for laying optical fiber cables and establishing mobile towers, indirectly boosting demand for associated power systems.
Strategic Outlook for Telecom Power Systems Industry Market
The Telecom Power Systems Industry is poised for sustained growth, driven by the continuous evolution of telecommunications technology and the ever-increasing demand for data. Strategic opportunities lie in the development of highly efficient and integrated power solutions for 5G advanced, 6G research, and the growing IoT ecosystem. Focus on energy resilience, cost optimization through smart power management, and the seamless integration of renewable energy sources will be critical. Collaboration across the value chain, from component manufacturers to network operators, will be essential to capitalize on emerging trends such as edge computing and the expanding data center footprint. The market's future trajectory will be shaped by its ability to deliver sustainable, reliable, and scalable power solutions to meet the world's insatiable appetite for connectivity.
Telecom Power Systems Industry Segmentation
-
1. Power Range
- 1.1. Low
- 1.2. Medium
- 1.3. High
-
2. End-user Application
- 2.1. Access
- 2.2. Core
- 2.3. Metro
Telecom Power Systems Industry Segmentation By Geography
- 1. North America
- 2. Europe
- 3. Asia Pacific
- 4. Latin America
- 5. Middle East and Africa
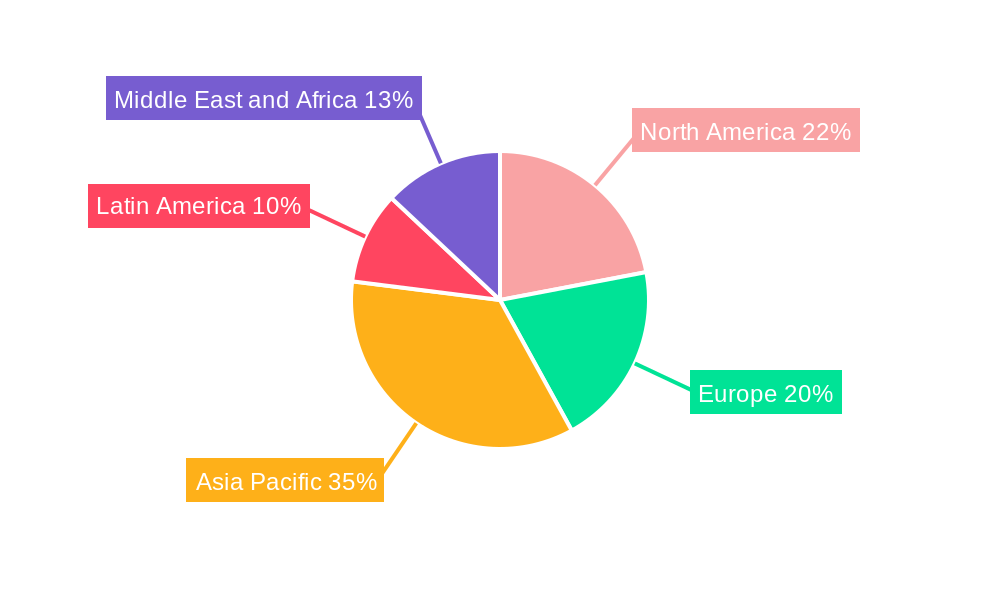
Telecom Power Systems Industry Regional Market Share
Geographic Coverage of Telecom Power Systems Industry
Telecom Power Systems Industry REPORT HIGHLIGHTS
| Aspects | Details |
|---|---|
| Study Period | 2020-2034 |
| Base Year | 2025 |
| Estimated Year | 2026 |
| Forecast Period | 2026-2034 |
| Historical Period | 2020-2025 |
| Growth Rate | CAGR of 8.3% from 2020-2034 |
| Segmentation |
|
Table of Contents
- 1. Introduction
- 1.1. Research Scope
- 1.2. Market Segmentation
- 1.3. Research Objective
- 1.4. Definitions and Assumptions
- 2. Executive Summary
- 2.1. Market Snapshot
- 3. Market Dynamics
- 3.1. Market Drivers
- 3.2. Market Restrains
- 3.3. Market Trends
- 3.4. Market Opportunities
- 4. Market Factor Analysis
- 4.1. Porters Five Forces
- 4.1.1. Bargaining Power of Suppliers
- 4.1.2. Bargaining Power of Buyers
- 4.1.3. Threat of New Entrants
- 4.1.4. Threat of Substitutes
- 4.1.5. Competitive Rivalry
- 4.2. PESTEL analysis
- 4.3. BCG Analysis
- 4.3.1. Stars (High Growth, High Market Share)
- 4.3.2. Cash Cows (Low Growth, High Market Share)
- 4.3.3. Question Mark (High Growth, Low Market Share)
- 4.3.4. Dogs (Low Growth, Low Market Share)
- 4.4. Ansoff Matrix Analysis
- 4.5. Supply Chain Analysis
- 4.6. Regulatory Landscape
- 4.7. Current Market Potential and Opportunity Assessment (TAM–SAM–SOM Framework)
- 4.8. MSR Analyst Note
- 4.1. Porters Five Forces
- 5. Market Analysis, Insights and Forecast 2021-2033
- 5.1. Market Analysis, Insights and Forecast - by Power Range
- 5.1.1. Low
- 5.1.2. Medium
- 5.1.3. High
- 5.2. Market Analysis, Insights and Forecast - by End-user Application
- 5.2.1. Access
- 5.2.2. Core
- 5.2.3. Metro
- 5.3. Market Analysis, Insights and Forecast - by Region
- 5.3.1. North America
- 5.3.2. Europe
- 5.3.3. Asia Pacific
- 5.3.4. Latin America
- 5.3.5. Middle East and Africa
- 5.1. Market Analysis, Insights and Forecast - by Power Range
- 6. Global Telecom Power Systems Industry Analysis, Insights and Forecast, 2021-2033
- 6.1. Market Analysis, Insights and Forecast - by Power Range
- 6.1.1. Low
- 6.1.2. Medium
- 6.1.3. High
- 6.2. Market Analysis, Insights and Forecast - by End-user Application
- 6.2.1. Access
- 6.2.2. Core
- 6.2.3. Metro
- 6.1. Market Analysis, Insights and Forecast - by Power Range
- 7. North America Telecom Power Systems Industry Analysis, Insights and Forecast, 2020-2032
- 7.1. Market Analysis, Insights and Forecast - by Power Range
- 7.1.1. Low
- 7.1.2. Medium
- 7.1.3. High
- 7.2. Market Analysis, Insights and Forecast - by End-user Application
- 7.2.1. Access
- 7.2.2. Core
- 7.2.3. Metro
- 7.1. Market Analysis, Insights and Forecast - by Power Range
- 8. Europe Telecom Power Systems Industry Analysis, Insights and Forecast, 2020-2032
- 8.1. Market Analysis, Insights and Forecast - by Power Range
- 8.1.1. Low
- 8.1.2. Medium
- 8.1.3. High
- 8.2. Market Analysis, Insights and Forecast - by End-user Application
- 8.2.1. Access
- 8.2.2. Core
- 8.2.3. Metro
- 8.1. Market Analysis, Insights and Forecast - by Power Range
- 9. Asia Pacific Telecom Power Systems Industry Analysis, Insights and Forecast, 2020-2032
- 9.1. Market Analysis, Insights and Forecast - by Power Range
- 9.1.1. Low
- 9.1.2. Medium
- 9.1.3. High
- 9.2. Market Analysis, Insights and Forecast - by End-user Application
- 9.2.1. Access
- 9.2.2. Core
- 9.2.3. Metro
- 9.1. Market Analysis, Insights and Forecast - by Power Range
- 10. Latin America Telecom Power Systems Industry Analysis, Insights and Forecast, 2020-2032
- 10.1. Market Analysis, Insights and Forecast - by Power Range
- 10.1.1. Low
- 10.1.2. Medium
- 10.1.3. High
- 10.2. Market Analysis, Insights and Forecast - by End-user Application
- 10.2.1. Access
- 10.2.2. Core
- 10.2.3. Metro
- 10.1. Market Analysis, Insights and Forecast - by Power Range
- 11. Middle East and Africa Telecom Power Systems Industry Analysis, Insights and Forecast, 2020-2032
- 11.1. Market Analysis, Insights and Forecast - by Power Range
- 11.1.1. Low
- 11.1.2. Medium
- 11.1.3. High
- 11.2. Market Analysis, Insights and Forecast - by End-user Application
- 11.2.1. Access
- 11.2.2. Core
- 11.2.3. Metro
- 11.1. Market Analysis, Insights and Forecast - by Power Range
- 12. Competitive Analysis
- 12.1. Company Profiles
- 12.1.1 Alpha Technologies
- 12.1.1.1. Company Overview
- 12.1.1.2. Products
- 12.1.1.3. Company Financials
- 12.1.1.4. SWOT Analysis
- 12.1.2 Delta Group
- 12.1.2.1. Company Overview
- 12.1.2.2. Products
- 12.1.2.3. Company Financials
- 12.1.2.4. SWOT Analysis
- 12.1.3 Huawei Technologies Co
- 12.1.3.1. Company Overview
- 12.1.3.2. Products
- 12.1.3.3. Company Financials
- 12.1.3.4. SWOT Analysis
- 12.1.4 ABB Group
- 12.1.4.1. Company Overview
- 12.1.4.2. Products
- 12.1.4.3. Company Financials
- 12.1.4.4. SWOT Analysis
- 12.1.5 Eltek AS
- 12.1.5.1. Company Overview
- 12.1.5.2. Products
- 12.1.5.3. Company Financials
- 12.1.5.4. SWOT Analysis
- 12.1.6 Cummins Inc
- 12.1.6.1. Company Overview
- 12.1.6.2. Products
- 12.1.6.3. Company Financials
- 12.1.6.4. SWOT Analysis
- 12.1.7 ZTE Corporation
- 12.1.7.1. Company Overview
- 12.1.7.2. Products
- 12.1.7.3. Company Financials
- 12.1.7.4. SWOT Analysis
- 12.1.8 Schneider Electric
- 12.1.8.1. Company Overview
- 12.1.8.2. Products
- 12.1.8.3. Company Financials
- 12.1.8.4. SWOT Analysis
- 12.1.9 Efore Group
- 12.1.9.1. Company Overview
- 12.1.9.2. Products
- 12.1.9.3. Company Financials
- 12.1.9.4. SWOT Analysis
- 12.1.10 Eaton Corporation
- 12.1.10.1. Company Overview
- 12.1.10.2. Products
- 12.1.10.3. Company Financials
- 12.1.10.4. SWOT Analysis
- 12.1.1 Alpha Technologies
- 12.2. Market Entropy
- 12.2.1 Company's Key Areas Served
- 12.2.2 Recent Developments
- 12.3. Company Market Share Analysis 2025
- 12.3.1 Top 5 Companies Market Share Analysis
- 12.3.2 Top 3 Companies Market Share Analysis
- 12.4. List of Potential Customers
- 13. Research Methodology
List of Figures
- Figure 1: Global Telecom Power Systems Industry Revenue Breakdown (billion, %) by Region 2025 & 2033
- Figure 2: North America Telecom Power Systems Industry Revenue (billion), by Power Range 2025 & 2033
- Figure 3: North America Telecom Power Systems Industry Revenue Share (%), by Power Range 2025 & 2033
- Figure 4: North America Telecom Power Systems Industry Revenue (billion), by End-user Application 2025 & 2033
- Figure 5: North America Telecom Power Systems Industry Revenue Share (%), by End-user Application 2025 & 2033
- Figure 6: North America Telecom Power Systems Industry Revenue (billion), by Country 2025 & 2033
- Figure 7: North America Telecom Power Systems Industry Revenue Share (%), by Country 2025 & 2033
- Figure 8: Europe Telecom Power Systems Industry Revenue (billion), by Power Range 2025 & 2033
- Figure 9: Europe Telecom Power Systems Industry Revenue Share (%), by Power Range 2025 & 2033
- Figure 10: Europe Telecom Power Systems Industry Revenue (billion), by End-user Application 2025 & 2033
- Figure 11: Europe Telecom Power Systems Industry Revenue Share (%), by End-user Application 2025 & 2033
- Figure 12: Europe Telecom Power Systems Industry Revenue (billion), by Country 2025 & 2033
- Figure 13: Europe Telecom Power Systems Industry Revenue Share (%), by Country 2025 & 2033
- Figure 14: Asia Pacific Telecom Power Systems Industry Revenue (billion), by Power Range 2025 & 2033
- Figure 15: Asia Pacific Telecom Power Systems Industry Revenue Share (%), by Power Range 2025 & 2033
- Figure 16: Asia Pacific Telecom Power Systems Industry Revenue (billion), by End-user Application 2025 & 2033
- Figure 17: Asia Pacific Telecom Power Systems Industry Revenue Share (%), by End-user Application 2025 & 2033
- Figure 18: Asia Pacific Telecom Power Systems Industry Revenue (billion), by Country 2025 & 2033
- Figure 19: Asia Pacific Telecom Power Systems Industry Revenue Share (%), by Country 2025 & 2033
- Figure 20: Latin America Telecom Power Systems Industry Revenue (billion), by Power Range 2025 & 2033
- Figure 21: Latin America Telecom Power Systems Industry Revenue Share (%), by Power Range 2025 & 2033
- Figure 22: Latin America Telecom Power Systems Industry Revenue (billion), by End-user Application 2025 & 2033
- Figure 23: Latin America Telecom Power Systems Industry Revenue Share (%), by End-user Application 2025 & 2033
- Figure 24: Latin America Telecom Power Systems Industry Revenue (billion), by Country 2025 & 2033
- Figure 25: Latin America Telecom Power Systems Industry Revenue Share (%), by Country 2025 & 2033
- Figure 26: Middle East and Africa Telecom Power Systems Industry Revenue (billion), by Power Range 2025 & 2033
- Figure 27: Middle East and Africa Telecom Power Systems Industry Revenue Share (%), by Power Range 2025 & 2033
- Figure 28: Middle East and Africa Telecom Power Systems Industry Revenue (billion), by End-user Application 2025 & 2033
- Figure 29: Middle East and Africa Telecom Power Systems Industry Revenue Share (%), by End-user Application 2025 & 2033
- Figure 30: Middle East and Africa Telecom Power Systems Industry Revenue (billion), by Country 2025 & 2033
- Figure 31: Middle East and Africa Telecom Power Systems Industry Revenue Share (%), by Country 2025 & 2033
List of Tables
- Table 1: Global Telecom Power Systems Industry Revenue billion Forecast, by Power Range 2020 & 2033
- Table 2: Global Telecom Power Systems Industry Revenue billion Forecast, by End-user Application 2020 & 2033
- Table 3: Global Telecom Power Systems Industry Revenue billion Forecast, by Region 2020 & 2033
- Table 4: Global Telecom Power Systems Industry Revenue billion Forecast, by Power Range 2020 & 2033
- Table 5: Global Telecom Power Systems Industry Revenue billion Forecast, by End-user Application 2020 & 2033
- Table 6: Global Telecom Power Systems Industry Revenue billion Forecast, by Country 2020 & 2033
- Table 7: Global Telecom Power Systems Industry Revenue billion Forecast, by Power Range 2020 & 2033
- Table 8: Global Telecom Power Systems Industry Revenue billion Forecast, by End-user Application 2020 & 2033
- Table 9: Global Telecom Power Systems Industry Revenue billion Forecast, by Country 2020 & 2033
- Table 10: Global Telecom Power Systems Industry Revenue billion Forecast, by Power Range 2020 & 2033
- Table 11: Global Telecom Power Systems Industry Revenue billion Forecast, by End-user Application 2020 & 2033
- Table 12: Global Telecom Power Systems Industry Revenue billion Forecast, by Country 2020 & 2033
- Table 13: Global Telecom Power Systems Industry Revenue billion Forecast, by Power Range 2020 & 2033
- Table 14: Global Telecom Power Systems Industry Revenue billion Forecast, by End-user Application 2020 & 2033
- Table 15: Global Telecom Power Systems Industry Revenue billion Forecast, by Country 2020 & 2033
- Table 16: Global Telecom Power Systems Industry Revenue billion Forecast, by Power Range 2020 & 2033
- Table 17: Global Telecom Power Systems Industry Revenue billion Forecast, by End-user Application 2020 & 2033
- Table 18: Global Telecom Power Systems Industry Revenue billion Forecast, by Country 2020 & 2033
Frequently Asked Questions
1. What is the projected Compound Annual Growth Rate (CAGR) of the Telecom Power Systems Industry?
The projected CAGR is approximately 8.3%.
2. Which companies are prominent players in the Telecom Power Systems Industry?
Key companies in the market include Alpha Technologies, Delta Group, Huawei Technologies Co, ABB Group, Eltek AS, Cummins Inc, ZTE Corporation, Schneider Electric, Efore Group, Eaton Corporation.
3. What are the main segments of the Telecom Power Systems Industry?
The market segments include Power Range, End-user Application.
4. Can you provide details about the market size?
The market size is estimated to be USD 5.69 billion as of 2022.
5. What are some drivers contributing to market growth?
Increasing Need for Tower Installations; Adoption of Hybrid Power System in Telecom.
6. What are the notable trends driving market growth?
Access Application in 5G Holds the Significant Share in the Market.
7. Are there any restraints impacting market growth?
High Deployment and Operational Cost.
8. Can you provide examples of recent developments in the market?
December 2022: Telecom Egypt, Egypt's first integrated telecom operator, and Grid Telecom, a wholly-owned subsidiary of the Independent Power Transmission Operator (IPTO) in Greece, announced a collaboration agreement to build a subsea system connecting Egypt and Greece.
9. What pricing options are available for accessing the report?
Pricing options include single-user, multi-user, and enterprise licenses priced at USD 4750, USD 5250, and USD 8750 respectively.
10. Is the market size provided in terms of value or volume?
The market size is provided in terms of value, measured in billion.
11. Are there any specific market keywords associated with the report?
Yes, the market keyword associated with the report is "Telecom Power Systems Industry," which aids in identifying and referencing the specific market segment covered.
12. How do I determine which pricing option suits my needs best?
The pricing options vary based on user requirements and access needs. Individual users may opt for single-user licenses, while businesses requiring broader access may choose multi-user or enterprise licenses for cost-effective access to the report.
13. Are there any additional resources or data provided in the Telecom Power Systems Industry report?
While the report offers comprehensive insights, it's advisable to review the specific contents or supplementary materials provided to ascertain if additional resources or data are available.
14. How can I stay updated on further developments or reports in the Telecom Power Systems Industry?
To stay informed about further developments, trends, and reports in the Telecom Power Systems Industry, consider subscribing to industry newsletters, following relevant companies and organizations, or regularly checking reputable industry news sources and publications.
Methodology
Step 1 - Identification of Relevant Samples Size from Population Database


Step 2 - Approaches for Defining Global Market Size (Value, Volume* & Price*)

Note*: In applicable scenarios
Step 3 - Data Sources
Primary Research
- Web Analytics
- Survey Reports
- Research Institute
- Latest Research Reports
- Opinion Leaders
Secondary Research
- Annual Reports
- White Paper
- Latest Press Release
- Industry Association
- Paid Database
- Investor Presentations

Step 4 - Data Triangulation
Involves using different sources of information in order to increase the validity of a study
These sources are likely to be stakeholders in a program - participants, other researchers, program staff, other community members, and so on.
Then we put all data in single framework & apply various statistical tools to find out the dynamic on the market.
During the analysis stage, feedback from the stakeholder groups would be compared to determine areas of agreement as well as areas of divergence