

Key Insights
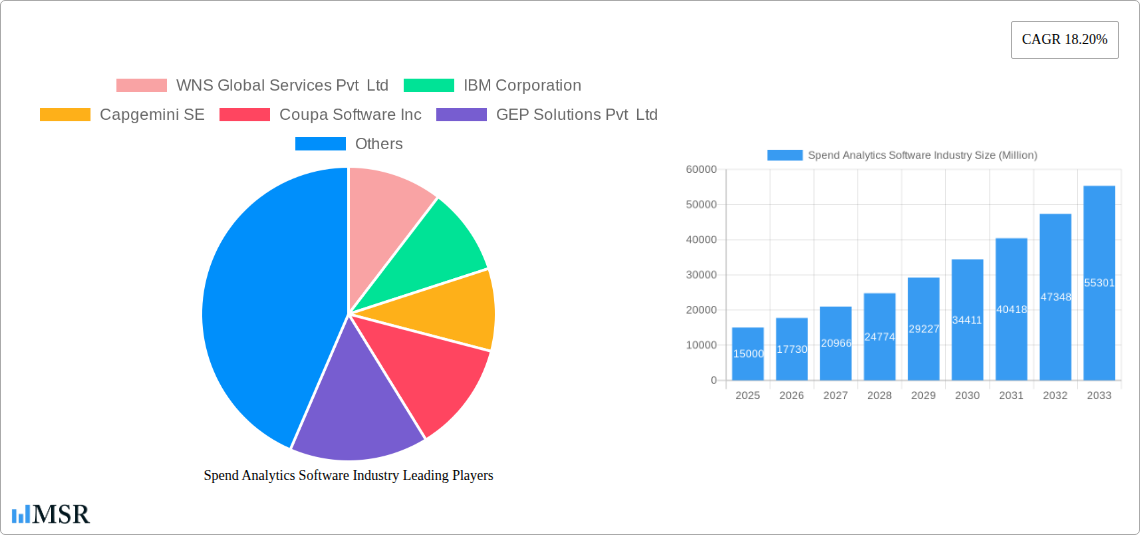
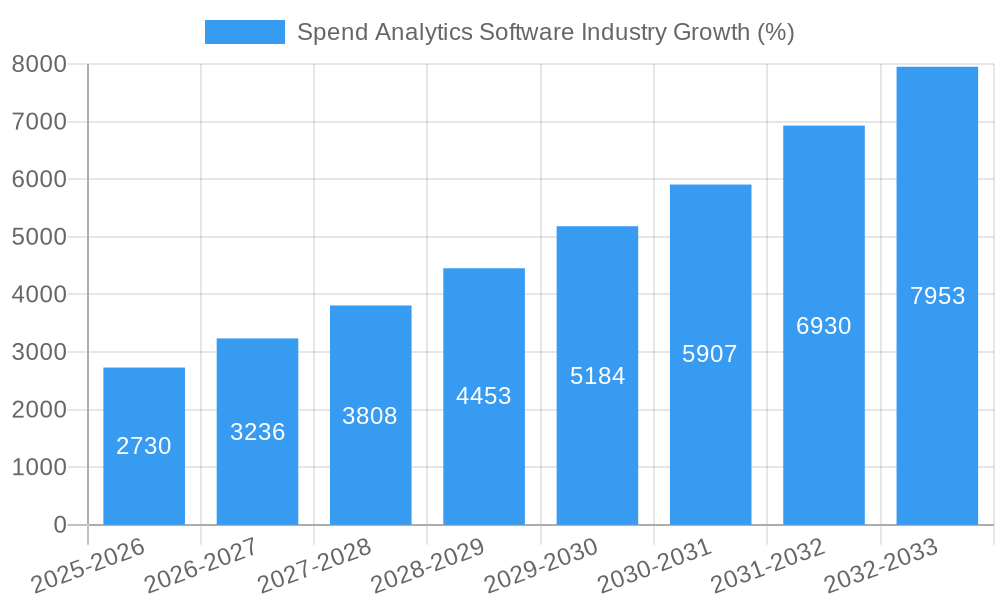
The Spend Analytics Software market is experiencing robust growth, projected at a compound annual growth rate (CAGR) of 18.20% from 2025 to 2033. This expansion is driven by several key factors. Increasing operational efficiency demands among businesses are fueling the adoption of spend analytics solutions to optimize procurement processes, reduce costs, and improve supplier relationships. The growing volume and complexity of business data necessitate sophisticated tools for analysis and reporting, further boosting market demand. Moreover, the shift toward cloud-based deployments offers scalability and accessibility, attracting a broader range of users across diverse industries. Significant growth is observed in sectors like Healthcare & Life Sciences, and Banking, Financial Services & Insurance (BFSI), due to their stringent regulatory compliance requirements and need for enhanced financial transparency. While the on-premise deployment model still holds a significant market share, the cloud-based segment is expected to witness faster growth due to its inherent advantages. Competitive dynamics are shaping the market with established players like IBM and SAP alongside emerging solution providers constantly innovating to meet evolving customer needs. Geographic expansion, particularly in developing economies with growing digitalization, presents considerable opportunities for market expansion. However, factors like the high initial investment cost and the need for specialized expertise to implement and utilize these solutions could pose challenges to market growth in the coming years.
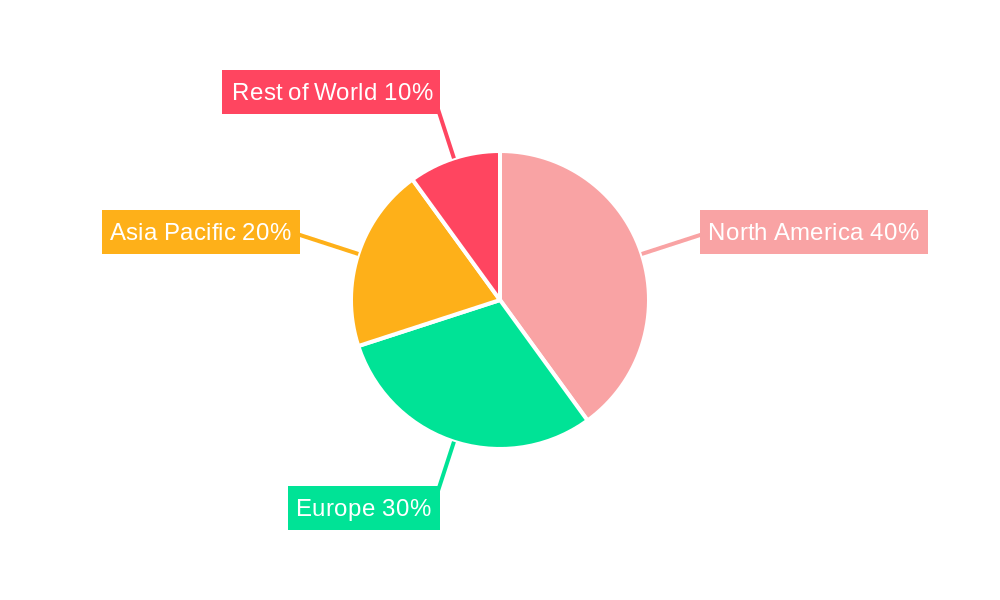
The market segmentation reflects the diverse application of spend analytics across various industries. The North American market currently dominates, owing to early adoption and a mature technological landscape. However, the Asia-Pacific region, driven by rapid economic growth and digital transformation initiatives in countries like India and China, is projected to witness significant growth in the coming years, quickly becoming a key market. Europe also represents a substantial market with consistent growth driven by robust regulatory frameworks and the increasing adoption of digital solutions across industries. The competitive landscape is characterized by a mix of established enterprise software vendors and specialized spend analytics solution providers. Strategic partnerships, acquisitions, and continuous product innovation are key strategies employed by these companies to maintain their market share and expand their reach. Future market growth will likely be influenced by advancements in artificial intelligence (AI) and machine learning (ML), enhancing the analytical capabilities of spend analytics platforms, and providing increasingly valuable insights to businesses.
Spend Analytics Software Market Report: 2019-2033 Forecast
This comprehensive report provides an in-depth analysis of the Spend Analytics Software industry, offering crucial insights for stakeholders, investors, and businesses operating within this dynamic market. With a study period spanning 2019-2033, a base year of 2025, and a forecast period of 2025-2033, this report delivers actionable intelligence based on rigorous research and analysis. The market size is projected to reach xx Million by 2033, exhibiting a CAGR of xx%.
Spend Analytics Software Industry Market Concentration & Dynamics
The Spend Analytics Software market exhibits a moderately concentrated landscape, with key players such as Coupa Software Inc, SAP SE, and IBM Corporation holding significant market share. However, the presence of numerous smaller, specialized vendors fosters a competitive environment driving innovation. The market is characterized by a dynamic innovation ecosystem, fueled by continuous advancements in AI, machine learning, and cloud computing. Regulatory frameworks, particularly concerning data privacy and security, significantly influence market dynamics. Substitute products, such as traditional spreadsheet-based spend analysis, are gradually losing ground to the efficiency and scalability offered by dedicated software solutions. M&A activity is robust, with several significant acquisitions shaping the market landscape in recent years. End-user trends show a growing preference for cloud-based solutions and integrated platforms offering comprehensive spend management capabilities.
- Market Share: Top 5 players hold approximately xx% of the market share (2024).
- M&A Activity: Over xx M&A deals recorded between 2019 and 2024.
- Key Innovation Areas: AI-driven insights, predictive analytics, and automated reporting.
Spend Analytics Software Industry Insights & Trends
The Spend Analytics Software market is experiencing robust growth, driven by the increasing need for organizations to optimize their procurement processes and gain better visibility into their spending patterns. The rising adoption of cloud-based solutions, coupled with the growing demand for advanced analytics and reporting capabilities, significantly fuels market expansion. Technological disruptions, such as the proliferation of AI and machine learning algorithms, are transforming the way businesses analyze and manage their spending. Evolving consumer behaviors, particularly the preference for integrated platforms and self-service functionalities, are reshaping vendor strategies and product development. The market is expected to witness continued growth, reaching an estimated value of xx Million by 2025 and xx Million by 2033.
Key Markets & Segments Leading Spend Analytics Software Industry
The North American region currently dominates the Spend Analytics Software market, driven by factors such as robust economic growth, advanced technological infrastructure, and a high concentration of large enterprises. The cloud-based deployment model is experiencing rapid growth due to its scalability, flexibility, and cost-effectiveness. Among end-users, the Banking, Financial Services and Insurance (BFSI) sector showcases the highest adoption rate due to stringent regulatory compliance requirements and the need for precise financial control. The Manufacturing sector also represents a significant market segment.
- Drivers for North American Dominance:
- High Technological Adoption
- Strong Economic Growth
- Large Enterprise Concentration
- Drivers for Cloud Deployment:
- Scalability and Flexibility
- Cost-Effectiveness
- Enhanced Accessibility
- Dominant End-User Segments: BFSI, Manufacturing, Healthcare & Life Sciences
Spend Analytics Software Industry Product Developments
Recent product innovations focus on enhancing AI capabilities to deliver more precise spend analysis, predictive insights, and automated reporting. Integration with other enterprise resource planning (ERP) systems is becoming increasingly crucial, providing a unified view of financial and operational data. The development of user-friendly interfaces and self-service dashboards improves accessibility for a broader range of users. These advancements solidify Spend Analytics software’s crucial role in modern business operations, enhancing procurement efficiency and cost savings.
Challenges in the Spend Analytics Software Industry Market
The market faces challenges such as high implementation costs, the need for skilled professionals to manage the software, and the complexity of integrating these systems with existing IT infrastructure. Data security and privacy concerns also present significant hurdles, particularly with the increasing regulatory scrutiny surrounding sensitive financial data. Intense competition from established players and emerging startups adds further pressure on margins. The estimated impact of these challenges on market growth is approximately a xx% reduction in the overall CAGR.
Forces Driving Spend Analytics Software Industry Growth
Several factors drive market growth, including the increasing adoption of digital transformation strategies by organizations of all sizes. Growing business complexities demand improved visibility into spending patterns, driving demand for sophisticated analytics solutions. Furthermore, stringent regulatory requirements, particularly in financial sectors, necessitate advanced spend management systems. The continuous advancement of AI, machine learning, and cloud technologies provides innovative solutions to address complex business needs.
Long-Term Growth Catalysts in the Spend Analytics Software Industry
Long-term growth will be fueled by continued technological innovation, strategic partnerships between software providers and consulting firms, and expansion into new and emerging markets. The integration of blockchain technology for enhanced security and transparency holds significant promise for the future. Furthermore, the expanding adoption of these solutions across diverse industry sectors will provide sustained market growth.
Emerging Opportunities in Spend Analytics Software Industry
Emerging opportunities include the integration of spend analytics with other business intelligence and analytics platforms, creating a more holistic view of business performance. The development of specialized solutions for niche industry segments presents a significant opportunity for market expansion. Furthermore, the growing demand for sustainability-focused spend management tools presents a new avenue for growth.
Leading Players in the Spend Analytics Software Industry Sector
- WNS Global Services Pvt Ltd
- IBM Corporation
- Capgemini SE
- Coupa Software Inc
- GEP Solutions Pvt Ltd
- Zycus Inc
- Ivalua Inc
- Jaggaer Inc
- Proactis Inc
- SAP SE
- Empronc Solutions Pvt Ltd
- Genpact Ltd
Key Milestones in Spend Analytics Software Industry Industry
- July 2022: SpendHQ's acquisition of Per Angusta, backed by USD 65 Million investment from Pamlico Capital, signifies a shift towards comprehensive strategic procurement platforms.
- February 2022: Coupa Software launches Community.ai, integrating AI-driven insights into B2B community interactions for improved spend management.
Strategic Outlook for Spend Analytics Software Industry Market
The Spend Analytics Software market exhibits significant long-term growth potential, driven by continuous technological advancements and the increasing need for efficient spend management across diverse industries. Strategic opportunities exist for players focused on innovation, strategic partnerships, and expansion into untapped markets. The market's future trajectory is promising, characterized by sustained growth and transformation driven by technological disruptions and evolving business needs.
Spend Analytics Software Industry Segmentation
-
1. Deployment
- 1.1. On-premise
- 1.2. On-cloud
-
2. End-User
- 2.1. Healthcare & Life Sciences
- 2.2. Energy & Utilities
- 2.3. Retail & E-commerce
- 2.4. Banking, Financial Services & Insurance
- 2.5. Manufacturing
- 2.6. IT & Telecommunications
- 2.7. Other End-Users
Spend Analytics Software Industry Segmentation By Geography
- 1. North America
- 2. Europe
- 3. Asia Pacific
- 4. Latin America
- 5. Middle East
Spend Analytics Software Industry REPORT HIGHLIGHTS
| Aspects | Details |
|---|---|
| Study Period | 2019-2033 |
| Base Year | 2024 |
| Estimated Year | 2025 |
| Forecast Period | 2025-2033 |
| Historical Period | 2019-2024 |
| Growth Rate | CAGR of 18.20% from 2019-2033 |
| Segmentation |
|
Table of Contents
- 1. Introduction
- 1.1. Research Scope
- 1.2. Market Segmentation
- 1.3. Research Methodology
- 1.4. Definitions and Assumptions
- 2. Executive Summary
- 2.1. Introduction
- 3. Market Dynamics
- 3.1. Introduction
- 3.2. Market Drivers
- 3.2.1. Growth in Environment Concerns and Awarness; Growth in Government Initiatives for Low Carbon Policies.
- 3.3. Market Restrains
- 3.3.1. High Product Cost; Lack of Government Regulations in Developing Nations
- 3.4. Market Trends
- 3.4.1. Retail and E-commerce is Expected to Witness Significant Growth
- 4. Market Factor Analysis
- 4.1. Porters Five Forces
- 4.2. Supply/Value Chain
- 4.3. PESTEL analysis
- 4.4. Market Entropy
- 4.5. Patent/Trademark Analysis
- 5. Global Spend Analytics Software Industry Analysis, Insights and Forecast, 2019-2031
- 5.1. Market Analysis, Insights and Forecast - by Deployment
- 5.1.1. On-premise
- 5.1.2. On-cloud
- 5.2. Market Analysis, Insights and Forecast - by End-User
- 5.2.1. Healthcare & Life Sciences
- 5.2.2. Energy & Utilities
- 5.2.3. Retail & E-commerce
- 5.2.4. Banking, Financial Services & Insurance
- 5.2.5. Manufacturing
- 5.2.6. IT & Telecommunications
- 5.2.7. Other End-Users
- 5.3. Market Analysis, Insights and Forecast - by Region
- 5.3.1. North America
- 5.3.2. Europe
- 5.3.3. Asia Pacific
- 5.3.4. Latin America
- 5.3.5. Middle East
- 5.1. Market Analysis, Insights and Forecast - by Deployment
- 6. North America Spend Analytics Software Industry Analysis, Insights and Forecast, 2019-2031
- 6.1. Market Analysis, Insights and Forecast - by Deployment
- 6.1.1. On-premise
- 6.1.2. On-cloud
- 6.2. Market Analysis, Insights and Forecast - by End-User
- 6.2.1. Healthcare & Life Sciences
- 6.2.2. Energy & Utilities
- 6.2.3. Retail & E-commerce
- 6.2.4. Banking, Financial Services & Insurance
- 6.2.5. Manufacturing
- 6.2.6. IT & Telecommunications
- 6.2.7. Other End-Users
- 6.1. Market Analysis, Insights and Forecast - by Deployment
- 7. Europe Spend Analytics Software Industry Analysis, Insights and Forecast, 2019-2031
- 7.1. Market Analysis, Insights and Forecast - by Deployment
- 7.1.1. On-premise
- 7.1.2. On-cloud
- 7.2. Market Analysis, Insights and Forecast - by End-User
- 7.2.1. Healthcare & Life Sciences
- 7.2.2. Energy & Utilities
- 7.2.3. Retail & E-commerce
- 7.2.4. Banking, Financial Services & Insurance
- 7.2.5. Manufacturing
- 7.2.6. IT & Telecommunications
- 7.2.7. Other End-Users
- 7.1. Market Analysis, Insights and Forecast - by Deployment
- 8. Asia Pacific Spend Analytics Software Industry Analysis, Insights and Forecast, 2019-2031
- 8.1. Market Analysis, Insights and Forecast - by Deployment
- 8.1.1. On-premise
- 8.1.2. On-cloud
- 8.2. Market Analysis, Insights and Forecast - by End-User
- 8.2.1. Healthcare & Life Sciences
- 8.2.2. Energy & Utilities
- 8.2.3. Retail & E-commerce
- 8.2.4. Banking, Financial Services & Insurance
- 8.2.5. Manufacturing
- 8.2.6. IT & Telecommunications
- 8.2.7. Other End-Users
- 8.1. Market Analysis, Insights and Forecast - by Deployment
- 9. Latin America Spend Analytics Software Industry Analysis, Insights and Forecast, 2019-2031
- 9.1. Market Analysis, Insights and Forecast - by Deployment
- 9.1.1. On-premise
- 9.1.2. On-cloud
- 9.2. Market Analysis, Insights and Forecast - by End-User
- 9.2.1. Healthcare & Life Sciences
- 9.2.2. Energy & Utilities
- 9.2.3. Retail & E-commerce
- 9.2.4. Banking, Financial Services & Insurance
- 9.2.5. Manufacturing
- 9.2.6. IT & Telecommunications
- 9.2.7. Other End-Users
- 9.1. Market Analysis, Insights and Forecast - by Deployment
- 10. Middle East Spend Analytics Software Industry Analysis, Insights and Forecast, 2019-2031
- 10.1. Market Analysis, Insights and Forecast - by Deployment
- 10.1.1. On-premise
- 10.1.2. On-cloud
- 10.2. Market Analysis, Insights and Forecast - by End-User
- 10.2.1. Healthcare & Life Sciences
- 10.2.2. Energy & Utilities
- 10.2.3. Retail & E-commerce
- 10.2.4. Banking, Financial Services & Insurance
- 10.2.5. Manufacturing
- 10.2.6. IT & Telecommunications
- 10.2.7. Other End-Users
- 10.1. Market Analysis, Insights and Forecast - by Deployment
- 11. North America Spend Analytics Software Industry Analysis, Insights and Forecast, 2019-2031
- 11.1. Market Analysis, Insights and Forecast - By Country/Sub-region
- 11.1.1 United States
- 11.1.2 Canada
- 11.1.3 Mexico
- 12. Europe Spend Analytics Software Industry Analysis, Insights and Forecast, 2019-2031
- 12.1. Market Analysis, Insights and Forecast - By Country/Sub-region
- 12.1.1 Germany
- 12.1.2 United Kingdom
- 12.1.3 France
- 12.1.4 Spain
- 12.1.5 Italy
- 12.1.6 Spain
- 12.1.7 Belgium
- 12.1.8 Netherland
- 12.1.9 Nordics
- 12.1.10 Rest of Europe
- 13. Asia Pacific Spend Analytics Software Industry Analysis, Insights and Forecast, 2019-2031
- 13.1. Market Analysis, Insights and Forecast - By Country/Sub-region
- 13.1.1 China
- 13.1.2 Japan
- 13.1.3 India
- 13.1.4 South Korea
- 13.1.5 Southeast Asia
- 13.1.6 Australia
- 13.1.7 Indonesia
- 13.1.8 Phillipes
- 13.1.9 Singapore
- 13.1.10 Thailandc
- 13.1.11 Rest of Asia Pacific
- 14. South America Spend Analytics Software Industry Analysis, Insights and Forecast, 2019-2031
- 14.1. Market Analysis, Insights and Forecast - By Country/Sub-region
- 14.1.1 Brazil
- 14.1.2 Argentina
- 14.1.3 Peru
- 14.1.4 Chile
- 14.1.5 Colombia
- 14.1.6 Ecuador
- 14.1.7 Venezuela
- 14.1.8 Rest of South America
- 15. North America Spend Analytics Software Industry Analysis, Insights and Forecast, 2019-2031
- 15.1. Market Analysis, Insights and Forecast - By Country/Sub-region
- 15.1.1 United States
- 15.1.2 Canada
- 15.1.3 Mexico
- 16. MEA Spend Analytics Software Industry Analysis, Insights and Forecast, 2019-2031
- 16.1. Market Analysis, Insights and Forecast - By Country/Sub-region
- 16.1.1 United Arab Emirates
- 16.1.2 Saudi Arabia
- 16.1.3 South Africa
- 16.1.4 Rest of Middle East and Africa
- 17. Competitive Analysis
- 17.1. Global Market Share Analysis 2024
- 17.2. Company Profiles
- 17.2.1 WNS Global Services Pvt Ltd
- 17.2.1.1. Overview
- 17.2.1.2. Products
- 17.2.1.3. SWOT Analysis
- 17.2.1.4. Recent Developments
- 17.2.1.5. Financials (Based on Availability)
- 17.2.2 IBM Corporation
- 17.2.2.1. Overview
- 17.2.2.2. Products
- 17.2.2.3. SWOT Analysis
- 17.2.2.4. Recent Developments
- 17.2.2.5. Financials (Based on Availability)
- 17.2.3 Capgemini SE
- 17.2.3.1. Overview
- 17.2.3.2. Products
- 17.2.3.3. SWOT Analysis
- 17.2.3.4. Recent Developments
- 17.2.3.5. Financials (Based on Availability)
- 17.2.4 Coupa Software Inc
- 17.2.4.1. Overview
- 17.2.4.2. Products
- 17.2.4.3. SWOT Analysis
- 17.2.4.4. Recent Developments
- 17.2.4.5. Financials (Based on Availability)
- 17.2.5 GEP Solutions Pvt Ltd
- 17.2.5.1. Overview
- 17.2.5.2. Products
- 17.2.5.3. SWOT Analysis
- 17.2.5.4. Recent Developments
- 17.2.5.5. Financials (Based on Availability)
- 17.2.6 Zycus Inc
- 17.2.6.1. Overview
- 17.2.6.2. Products
- 17.2.6.3. SWOT Analysis
- 17.2.6.4. Recent Developments
- 17.2.6.5. Financials (Based on Availability)
- 17.2.7 Ivalua Inc
- 17.2.7.1. Overview
- 17.2.7.2. Products
- 17.2.7.3. SWOT Analysis
- 17.2.7.4. Recent Developments
- 17.2.7.5. Financials (Based on Availability)
- 17.2.8 Jaggaer Inc
- 17.2.8.1. Overview
- 17.2.8.2. Products
- 17.2.8.3. SWOT Analysis
- 17.2.8.4. Recent Developments
- 17.2.8.5. Financials (Based on Availability)
- 17.2.9 Proactis Inc
- 17.2.9.1. Overview
- 17.2.9.2. Products
- 17.2.9.3. SWOT Analysis
- 17.2.9.4. Recent Developments
- 17.2.9.5. Financials (Based on Availability)
- 17.2.10 SAP SE
- 17.2.10.1. Overview
- 17.2.10.2. Products
- 17.2.10.3. SWOT Analysis
- 17.2.10.4. Recent Developments
- 17.2.10.5. Financials (Based on Availability)
- 17.2.11 Empronc Solutions Pvt Ltd *List Not Exhaustive
- 17.2.11.1. Overview
- 17.2.11.2. Products
- 17.2.11.3. SWOT Analysis
- 17.2.11.4. Recent Developments
- 17.2.11.5. Financials (Based on Availability)
- 17.2.12 Genpact Ltd
- 17.2.12.1. Overview
- 17.2.12.2. Products
- 17.2.12.3. SWOT Analysis
- 17.2.12.4. Recent Developments
- 17.2.12.5. Financials (Based on Availability)
- 17.2.1 WNS Global Services Pvt Ltd
List of Figures
- Figure 1: Global Spend Analytics Software Industry Revenue Breakdown (Million, %) by Region 2024 & 2032
- Figure 2: North America Spend Analytics Software Industry Revenue (Million), by Country 2024 & 2032
- Figure 3: North America Spend Analytics Software Industry Revenue Share (%), by Country 2024 & 2032
- Figure 4: Europe Spend Analytics Software Industry Revenue (Million), by Country 2024 & 2032
- Figure 5: Europe Spend Analytics Software Industry Revenue Share (%), by Country 2024 & 2032
- Figure 6: Asia Pacific Spend Analytics Software Industry Revenue (Million), by Country 2024 & 2032
- Figure 7: Asia Pacific Spend Analytics Software Industry Revenue Share (%), by Country 2024 & 2032
- Figure 8: South America Spend Analytics Software Industry Revenue (Million), by Country 2024 & 2032
- Figure 9: South America Spend Analytics Software Industry Revenue Share (%), by Country 2024 & 2032
- Figure 10: North America Spend Analytics Software Industry Revenue (Million), by Country 2024 & 2032
- Figure 11: North America Spend Analytics Software Industry Revenue Share (%), by Country 2024 & 2032
- Figure 12: MEA Spend Analytics Software Industry Revenue (Million), by Country 2024 & 2032
- Figure 13: MEA Spend Analytics Software Industry Revenue Share (%), by Country 2024 & 2032
- Figure 14: North America Spend Analytics Software Industry Revenue (Million), by Deployment 2024 & 2032
- Figure 15: North America Spend Analytics Software Industry Revenue Share (%), by Deployment 2024 & 2032
- Figure 16: North America Spend Analytics Software Industry Revenue (Million), by End-User 2024 & 2032
- Figure 17: North America Spend Analytics Software Industry Revenue Share (%), by End-User 2024 & 2032
- Figure 18: North America Spend Analytics Software Industry Revenue (Million), by Country 2024 & 2032
- Figure 19: North America Spend Analytics Software Industry Revenue Share (%), by Country 2024 & 2032
- Figure 20: Europe Spend Analytics Software Industry Revenue (Million), by Deployment 2024 & 2032
- Figure 21: Europe Spend Analytics Software Industry Revenue Share (%), by Deployment 2024 & 2032
- Figure 22: Europe Spend Analytics Software Industry Revenue (Million), by End-User 2024 & 2032
- Figure 23: Europe Spend Analytics Software Industry Revenue Share (%), by End-User 2024 & 2032
- Figure 24: Europe Spend Analytics Software Industry Revenue (Million), by Country 2024 & 2032
- Figure 25: Europe Spend Analytics Software Industry Revenue Share (%), by Country 2024 & 2032
- Figure 26: Asia Pacific Spend Analytics Software Industry Revenue (Million), by Deployment 2024 & 2032
- Figure 27: Asia Pacific Spend Analytics Software Industry Revenue Share (%), by Deployment 2024 & 2032
- Figure 28: Asia Pacific Spend Analytics Software Industry Revenue (Million), by End-User 2024 & 2032
- Figure 29: Asia Pacific Spend Analytics Software Industry Revenue Share (%), by End-User 2024 & 2032
- Figure 30: Asia Pacific Spend Analytics Software Industry Revenue (Million), by Country 2024 & 2032
- Figure 31: Asia Pacific Spend Analytics Software Industry Revenue Share (%), by Country 2024 & 2032
- Figure 32: Latin America Spend Analytics Software Industry Revenue (Million), by Deployment 2024 & 2032
- Figure 33: Latin America Spend Analytics Software Industry Revenue Share (%), by Deployment 2024 & 2032
- Figure 34: Latin America Spend Analytics Software Industry Revenue (Million), by End-User 2024 & 2032
- Figure 35: Latin America Spend Analytics Software Industry Revenue Share (%), by End-User 2024 & 2032
- Figure 36: Latin America Spend Analytics Software Industry Revenue (Million), by Country 2024 & 2032
- Figure 37: Latin America Spend Analytics Software Industry Revenue Share (%), by Country 2024 & 2032
- Figure 38: Middle East Spend Analytics Software Industry Revenue (Million), by Deployment 2024 & 2032
- Figure 39: Middle East Spend Analytics Software Industry Revenue Share (%), by Deployment 2024 & 2032
- Figure 40: Middle East Spend Analytics Software Industry Revenue (Million), by End-User 2024 & 2032
- Figure 41: Middle East Spend Analytics Software Industry Revenue Share (%), by End-User 2024 & 2032
- Figure 42: Middle East Spend Analytics Software Industry Revenue (Million), by Country 2024 & 2032
- Figure 43: Middle East Spend Analytics Software Industry Revenue Share (%), by Country 2024 & 2032
List of Tables
- Table 1: Global Spend Analytics Software Industry Revenue Million Forecast, by Region 2019 & 2032
- Table 2: Global Spend Analytics Software Industry Revenue Million Forecast, by Deployment 2019 & 2032
- Table 3: Global Spend Analytics Software Industry Revenue Million Forecast, by End-User 2019 & 2032
- Table 4: Global Spend Analytics Software Industry Revenue Million Forecast, by Region 2019 & 2032
- Table 5: Global Spend Analytics Software Industry Revenue Million Forecast, by Country 2019 & 2032
- Table 6: United States Spend Analytics Software Industry Revenue (Million) Forecast, by Application 2019 & 2032
- Table 7: Canada Spend Analytics Software Industry Revenue (Million) Forecast, by Application 2019 & 2032
- Table 8: Mexico Spend Analytics Software Industry Revenue (Million) Forecast, by Application 2019 & 2032
- Table 9: Global Spend Analytics Software Industry Revenue Million Forecast, by Country 2019 & 2032
- Table 10: Germany Spend Analytics Software Industry Revenue (Million) Forecast, by Application 2019 & 2032
- Table 11: United Kingdom Spend Analytics Software Industry Revenue (Million) Forecast, by Application 2019 & 2032
- Table 12: France Spend Analytics Software Industry Revenue (Million) Forecast, by Application 2019 & 2032
- Table 13: Spain Spend Analytics Software Industry Revenue (Million) Forecast, by Application 2019 & 2032
- Table 14: Italy Spend Analytics Software Industry Revenue (Million) Forecast, by Application 2019 & 2032
- Table 15: Spain Spend Analytics Software Industry Revenue (Million) Forecast, by Application 2019 & 2032
- Table 16: Belgium Spend Analytics Software Industry Revenue (Million) Forecast, by Application 2019 & 2032
- Table 17: Netherland Spend Analytics Software Industry Revenue (Million) Forecast, by Application 2019 & 2032
- Table 18: Nordics Spend Analytics Software Industry Revenue (Million) Forecast, by Application 2019 & 2032
- Table 19: Rest of Europe Spend Analytics Software Industry Revenue (Million) Forecast, by Application 2019 & 2032
- Table 20: Global Spend Analytics Software Industry Revenue Million Forecast, by Country 2019 & 2032
- Table 21: China Spend Analytics Software Industry Revenue (Million) Forecast, by Application 2019 & 2032
- Table 22: Japan Spend Analytics Software Industry Revenue (Million) Forecast, by Application 2019 & 2032
- Table 23: India Spend Analytics Software Industry Revenue (Million) Forecast, by Application 2019 & 2032
- Table 24: South Korea Spend Analytics Software Industry Revenue (Million) Forecast, by Application 2019 & 2032
- Table 25: Southeast Asia Spend Analytics Software Industry Revenue (Million) Forecast, by Application 2019 & 2032
- Table 26: Australia Spend Analytics Software Industry Revenue (Million) Forecast, by Application 2019 & 2032
- Table 27: Indonesia Spend Analytics Software Industry Revenue (Million) Forecast, by Application 2019 & 2032
- Table 28: Phillipes Spend Analytics Software Industry Revenue (Million) Forecast, by Application 2019 & 2032
- Table 29: Singapore Spend Analytics Software Industry Revenue (Million) Forecast, by Application 2019 & 2032
- Table 30: Thailandc Spend Analytics Software Industry Revenue (Million) Forecast, by Application 2019 & 2032
- Table 31: Rest of Asia Pacific Spend Analytics Software Industry Revenue (Million) Forecast, by Application 2019 & 2032
- Table 32: Global Spend Analytics Software Industry Revenue Million Forecast, by Country 2019 & 2032
- Table 33: Brazil Spend Analytics Software Industry Revenue (Million) Forecast, by Application 2019 & 2032
- Table 34: Argentina Spend Analytics Software Industry Revenue (Million) Forecast, by Application 2019 & 2032
- Table 35: Peru Spend Analytics Software Industry Revenue (Million) Forecast, by Application 2019 & 2032
- Table 36: Chile Spend Analytics Software Industry Revenue (Million) Forecast, by Application 2019 & 2032
- Table 37: Colombia Spend Analytics Software Industry Revenue (Million) Forecast, by Application 2019 & 2032
- Table 38: Ecuador Spend Analytics Software Industry Revenue (Million) Forecast, by Application 2019 & 2032
- Table 39: Venezuela Spend Analytics Software Industry Revenue (Million) Forecast, by Application 2019 & 2032
- Table 40: Rest of South America Spend Analytics Software Industry Revenue (Million) Forecast, by Application 2019 & 2032
- Table 41: Global Spend Analytics Software Industry Revenue Million Forecast, by Country 2019 & 2032
- Table 42: United States Spend Analytics Software Industry Revenue (Million) Forecast, by Application 2019 & 2032
- Table 43: Canada Spend Analytics Software Industry Revenue (Million) Forecast, by Application 2019 & 2032
- Table 44: Mexico Spend Analytics Software Industry Revenue (Million) Forecast, by Application 2019 & 2032
- Table 45: Global Spend Analytics Software Industry Revenue Million Forecast, by Country 2019 & 2032
- Table 46: United Arab Emirates Spend Analytics Software Industry Revenue (Million) Forecast, by Application 2019 & 2032
- Table 47: Saudi Arabia Spend Analytics Software Industry Revenue (Million) Forecast, by Application 2019 & 2032
- Table 48: South Africa Spend Analytics Software Industry Revenue (Million) Forecast, by Application 2019 & 2032
- Table 49: Rest of Middle East and Africa Spend Analytics Software Industry Revenue (Million) Forecast, by Application 2019 & 2032
- Table 50: Global Spend Analytics Software Industry Revenue Million Forecast, by Deployment 2019 & 2032
- Table 51: Global Spend Analytics Software Industry Revenue Million Forecast, by End-User 2019 & 2032
- Table 52: Global Spend Analytics Software Industry Revenue Million Forecast, by Country 2019 & 2032
- Table 53: Global Spend Analytics Software Industry Revenue Million Forecast, by Deployment 2019 & 2032
- Table 54: Global Spend Analytics Software Industry Revenue Million Forecast, by End-User 2019 & 2032
- Table 55: Global Spend Analytics Software Industry Revenue Million Forecast, by Country 2019 & 2032
- Table 56: Global Spend Analytics Software Industry Revenue Million Forecast, by Deployment 2019 & 2032
- Table 57: Global Spend Analytics Software Industry Revenue Million Forecast, by End-User 2019 & 2032
- Table 58: Global Spend Analytics Software Industry Revenue Million Forecast, by Country 2019 & 2032
- Table 59: Global Spend Analytics Software Industry Revenue Million Forecast, by Deployment 2019 & 2032
- Table 60: Global Spend Analytics Software Industry Revenue Million Forecast, by End-User 2019 & 2032
- Table 61: Global Spend Analytics Software Industry Revenue Million Forecast, by Country 2019 & 2032
- Table 62: Global Spend Analytics Software Industry Revenue Million Forecast, by Deployment 2019 & 2032
- Table 63: Global Spend Analytics Software Industry Revenue Million Forecast, by End-User 2019 & 2032
- Table 64: Global Spend Analytics Software Industry Revenue Million Forecast, by Country 2019 & 2032
Frequently Asked Questions
1. What is the projected Compound Annual Growth Rate (CAGR) of the Spend Analytics Software Industry?
The projected CAGR is approximately 18.20%.
2. Which companies are prominent players in the Spend Analytics Software Industry?
Key companies in the market include WNS Global Services Pvt Ltd, IBM Corporation, Capgemini SE, Coupa Software Inc, GEP Solutions Pvt Ltd, Zycus Inc, Ivalua Inc, Jaggaer Inc, Proactis Inc, SAP SE, Empronc Solutions Pvt Ltd *List Not Exhaustive, Genpact Ltd.
3. What are the main segments of the Spend Analytics Software Industry?
The market segments include Deployment, End-User.
4. Can you provide details about the market size?
The market size is estimated to be USD XX Million as of 2022.
5. What are some drivers contributing to market growth?
Growth in Environment Concerns and Awarness; Growth in Government Initiatives for Low Carbon Policies..
6. What are the notable trends driving market growth?
Retail and E-commerce is Expected to Witness Significant Growth.
7. Are there any restraints impacting market growth?
High Product Cost; Lack of Government Regulations in Developing Nations.
8. Can you provide examples of recent developments in the market?
July 2022: Based in Atlanta, Georgia, SpendHQ combines with Per Angusta, with Pamlico Capital investing USD 65 million to support the acquisition in order to build a new type of strategic procurement platform. These extensions from the spend analysis core, especially into category management, position SpendHQ as a provider capable of addressing both the transactional and strategic aspects of procurement activities outside of transactional processing.
9. What pricing options are available for accessing the report?
Pricing options include single-user, multi-user, and enterprise licenses priced at USD 4750, USD 5250, and USD 8750 respectively.
10. Is the market size provided in terms of value or volume?
The market size is provided in terms of value, measured in Million.
11. Are there any specific market keywords associated with the report?
Yes, the market keyword associated with the report is "Spend Analytics Software Industry," which aids in identifying and referencing the specific market segment covered.
12. How do I determine which pricing option suits my needs best?
The pricing options vary based on user requirements and access needs. Individual users may opt for single-user licenses, while businesses requiring broader access may choose multi-user or enterprise licenses for cost-effective access to the report.
13. Are there any additional resources or data provided in the Spend Analytics Software Industry report?
While the report offers comprehensive insights, it's advisable to review the specific contents or supplementary materials provided to ascertain if additional resources or data are available.
14. How can I stay updated on further developments or reports in the Spend Analytics Software Industry?
To stay informed about further developments, trends, and reports in the Spend Analytics Software Industry, consider subscribing to industry newsletters, following relevant companies and organizations, or regularly checking reputable industry news sources and publications.
Methodology
Step 1 - Identification of Relevant Samples Size from Population Database


Step 2 - Approaches for Defining Global Market Size (Value, Volume* & Price*)

Note*: In applicable scenarios
Step 3 - Data Sources
Primary Research
- Web Analytics
- Survey Reports
- Research Institute
- Latest Research Reports
- Opinion Leaders
Secondary Research
- Annual Reports
- White Paper
- Latest Press Release
- Industry Association
- Paid Database
- Investor Presentations

Step 4 - Data Triangulation
Involves using different sources of information in order to increase the validity of a study
These sources are likely to be stakeholders in a program - participants, other researchers, program staff, other community members, and so on.
Then we put all data in single framework & apply various statistical tools to find out the dynamic on the market.
During the analysis stage, feedback from the stakeholder groups would be compared to determine areas of agreement as well as areas of divergence
