

Key Insights
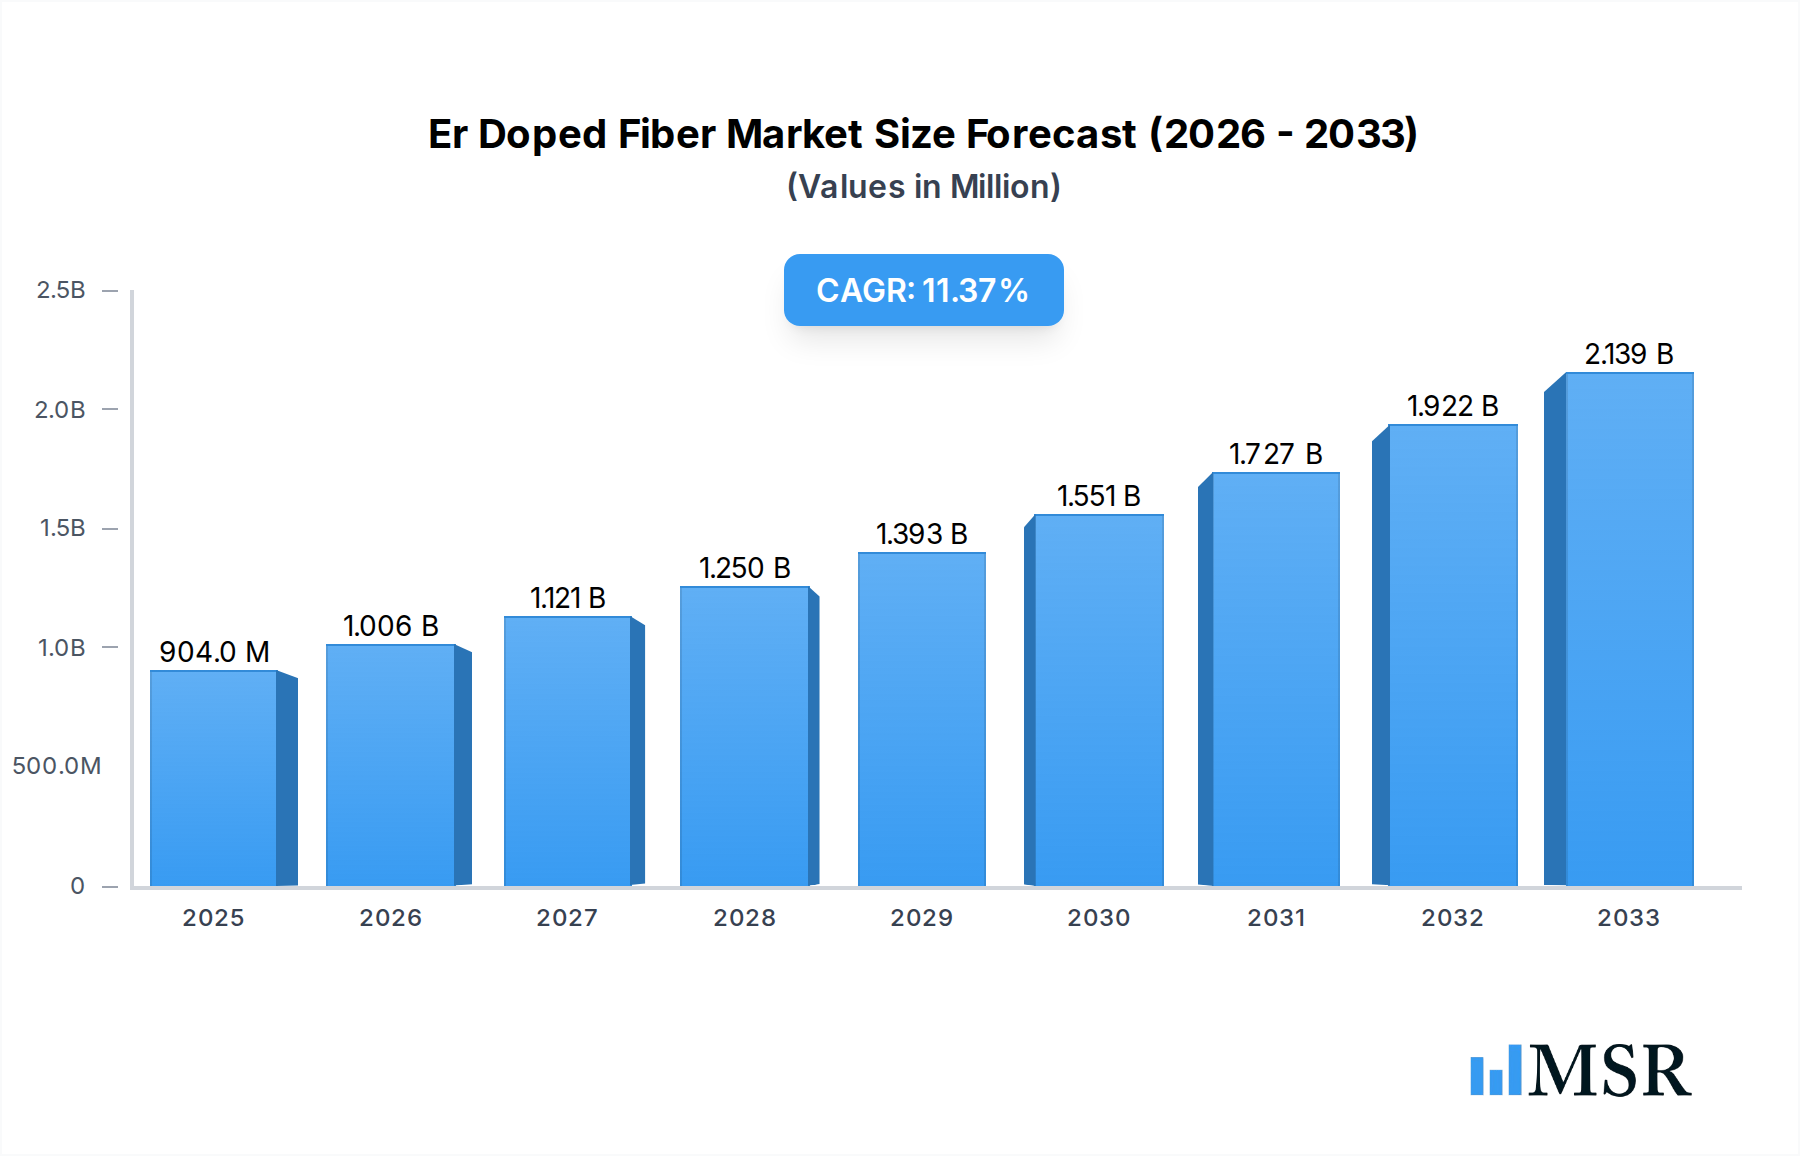
The Er Doped Fiber market is poised for significant expansion, projected to reach an impressive $904 million by 2025, driven by a robust 11.4% CAGR. This growth trajectory is largely fueled by the escalating demand for high-speed data transmission in telecommunications, a sector that consistently pushes the boundaries of optical networking. The intrinsic properties of Er Doped Fibers, such as their ability to amplify optical signals without converting them to electrical signals, make them indispensable for long-haul communication networks, subsea cables, and data centers. Beyond telecommunications, the burgeoning applications in medical diagnostics and imaging, industrial laser systems, and advanced scientific research further underpin this market's expansion. The increasing adoption of fiber optic technology in healthcare for minimally invasive surgeries and advanced imaging techniques, coupled with its role in powering high-precision industrial lasers and sophisticated analytical instruments, presents substantial growth opportunities.

Er Doped Fiber Market Size (In Million)
The market's dynamism is further shaped by emerging trends in miniaturization of optical components and the development of novel doping techniques, leading to improved fiber performance and cost-effectiveness. However, challenges such as the high initial investment costs for research and development, coupled with the need for specialized manufacturing processes, can present hurdles. Additionally, the stringent quality control requirements for certain sensitive applications, like medical and defense, necessitate substantial R&D expenditure. Despite these restraints, the continuous innovation in fiber optic technology, coupled with the increasing global connectivity demands across various sectors, suggests a promising future. The market is segmented by application into Medical, Industrial, Telecommunication, Scientific Research, Military and Defense, Environmental Monitoring, and Others, with Telecommunication expected to dominate. By type, Single Mode Fiber and Double Mode Fiber represent key segments.
Er Doped Fiber Company Market Share
This comprehensive report provides an in-depth analysis of the Er Doped Fiber market, meticulously tracking its trajectory from 2019 to 2033. Covering a study period of 15 years, with a base year of 2025, this report offers granular insights into market dynamics, key players, technological advancements, and future growth catalysts. We delve into the intricacies of Er Doped Fiber applications across crucial sectors, including Medical, Industrial, Telecommunication, Scientific Research, Military and Defense, and Environmental Monitoring. The report further dissects the market by fiber type, focusing on Single Mode Fiber and Double Mode Fiber.
Er Doped Fiber Market Concentration & Dynamics
The Er Doped Fiber market exhibits a moderate to high concentration, characterized by the presence of a few dominant players and a significant number of specialized manufacturers. Innovation ecosystems are robust, driven by continuous research and development in optical amplification technologies. Regulatory frameworks, while evolving, generally support the growth of telecommunications and advanced scientific research. Substitute products, such as other rare-earth doped fibers or alternative amplification technologies, present a dynamic competitive landscape. End-user trends reveal a growing demand for higher bandwidth and lower latency in telecommunications, alongside increasing adoption in sophisticated medical imaging and industrial sensing applications. Merger and acquisition (M&A) activities, though not at a frenzied pace, are strategic, aimed at consolidating market share, acquiring specific technological expertise, or expanding geographical reach. Estimated M&A deal counts are in the low double digits annually, with deal values often ranging from tens of millions to hundreds of millions of dollars. Key market share holders are anticipated to maintain their positions through technological superiority and established supply chains.
Er Doped Fiber Industry Insights & Trends
The Er Doped Fiber industry is on a significant growth trajectory, propelled by an increasing global demand for high-speed data transmission and advanced optical sensing solutions. The market size for Er Doped Fiber is projected to reach over $1,500 million by 2025 and is expected to witness a Compound Annual Growth Rate (CAGR) of over 8% during the forecast period of 2025–2033. This sustained growth is primarily fueled by the relentless expansion of telecommunication networks, including the deployment of 5G infrastructure, which requires high-performance optical amplifiers. The burgeoning demand for faster internet speeds and increased data capacity in both residential and enterprise sectors is a critical market driver. Beyond telecommunications, advancements in scientific research are opening new avenues for Er Doped Fiber applications, particularly in areas like spectroscopy, laser development, and advanced imaging techniques. The medical sector is witnessing an increased adoption of Er Doped Fiber lasers and amplifiers for minimally invasive surgical procedures, diagnostic tools, and advanced therapeutic applications, contributing to its market significance. Industrial applications are also expanding, with Er Doped Fibers finding utility in precision machining, remote sensing, and industrial automation, where their unique optical properties offer significant advantages. The ever-growing need for reliable and high-capacity data transmission infrastructure, coupled with ongoing technological innovations in fiber optics, solidifies the positive outlook for the Er Doped Fiber market.
Key Markets & Segments Leading Er Doped Fiber
The Telecommunication segment is the undisputed leader in the Er Doped Fiber market, driven by the global imperative for high-speed data transmission. This dominance is evident across major economic regions, with North America and Asia-Pacific showcasing particularly strong demand.
- Telecommunication Dominance Drivers:
- Infrastructure Expansion: The continuous build-out of fiber optic networks, including fiber-to-the-home (FTTH) and the deployment of 5G mobile networks, necessitates the widespread use of Er Doped Fiber Amplifiers (EDFAs) for signal boosting.
- Increasing Data Traffic: The exponential growth in internet usage, streaming services, cloud computing, and data-intensive applications is placing immense pressure on existing network capacities, requiring advanced amplification solutions.
- Technological Advancements: Innovations in erbium-doped fiber technology, leading to higher gain, lower noise, and increased efficiency, are crucial for meeting the evolving demands of telecommunication providers.
The Scientific Research segment is another significant contributor, fueled by the need for precise and powerful laser sources and optical instruments.
- Scientific Research Drivers:
- Advanced Spectroscopy: Er Doped Fibers are integral to developing highly sensitive spectroscopic instruments for chemical analysis, environmental monitoring, and materials science.
- Laser Development: Their ability to operate efficiently in the 1550 nm wavelength range makes them ideal for numerous laser applications, including those used in fundamental physics research and advanced material processing.
- Optical Microscopy: Innovations in fluorescence microscopy and optical coherence tomography (OCT) are increasingly leveraging the unique properties of Er Doped Fibers.
The Medical segment is experiencing robust growth, driven by the precision and efficacy of Er Doped Fiber-based lasers in various healthcare applications.
- Medical Drivers:
- Minimally Invasive Surgery: Er Doped Fiber lasers are becoming indispensable for precise surgical interventions, offering reduced recovery times and improved patient outcomes.
- Diagnostic Imaging: Applications in optical coherence tomography (OCT) for ophthalmology and other medical imaging fields are expanding rapidly.
- Therapeutic Applications: The development of laser-based therapies for conditions ranging from dermatology to pain management is a growing area of adoption.
Single Mode Fiber constitutes the largest share within the Type segment, primarily due to its fundamental role in long-haul telecommunications and high-bandwidth applications where signal integrity is paramount. Double Mode Fiber, while niche, is gaining traction in specialized sensing and compact optical device applications.
Er Doped Fiber Product Developments
Recent product developments in Er Doped Fiber have focused on enhancing amplifier efficiency, reducing noise figures, and miniaturizing components for greater integration. Manufacturers like Le Verre Fluoré and Coractive are innovating with new doping concentrations and fiber architectures to achieve higher output powers and broader spectral bandwidths. Thorlabs and Newport Corporation are introducing advanced fiber laser modules and optical amplifiers incorporating these specialized fibers, catering to scientific research and industrial applications. These advancements are enabling more compact, energy-efficient, and versatile optical systems, pushing the boundaries of performance in telecommunications, medical diagnostics, and advanced sensing technologies.
Challenges in the Er Doped Fiber Market
The Er Doped Fiber market, despite its growth, faces several challenges. High manufacturing costs associated with specialized doping processes and quality control can limit broader adoption in price-sensitive segments. Supply chain disruptions, as evidenced by recent global events, can impact the availability of raw materials and finished products, leading to price volatility. Intense competition from alternative amplification technologies and other rare-earth doped fibers necessitates continuous innovation and cost optimization. Furthermore, evolving international standards and regulatory compliance, particularly for medical and defense applications, add complexity and development time.
Forces Driving Er Doped Fiber Growth
Several key forces are propelling the growth of the Er Doped Fiber market. The insatiable global demand for high-speed telecommunications, including the rollout of 5G networks and the expansion of data centers, is a primary driver. Technological advancements in optical networking and the increasing need for higher bandwidth and lower latency are crucial. The growing adoption of advanced optical sensing technologies in industrial automation, environmental monitoring, and security systems further bolsters demand. Moreover, the increasing sophistication and application of medical lasers and diagnostic tools are creating significant market opportunities.
Challenges in the Er Doped Fiber Market
Long-term growth catalysts for the Er Doped Fiber market lie in sustained innovation and strategic market expansion. The continued development of novel doping techniques and fiber compositions will unlock new performance capabilities, enabling applications in previously inaccessible areas. Strategic partnerships and collaborations between fiber manufacturers, amplifier developers, and end-users will accelerate product development and market penetration. Exploring and capitalizing on emerging market applications, such as quantum computing and advanced material processing, presents significant future growth potential. The increasing focus on energy-efficient optical solutions will also favor Er Doped Fiber technologies that offer improved performance-to-power ratios.
Emerging Opportunities in Er Doped Fiber
Emerging opportunities in the Er Doped Fiber market are diverse and promising. The expanding field of quantum technologies offers new avenues for highly coherent light sources. Advancements in advanced manufacturing and additive manufacturing techniques could lead to more cost-effective and customized fiber production. The growing demand for reliable remote sensing and monitoring solutions in sectors like agriculture, defense, and infrastructure inspection presents a significant opportunity. Furthermore, the continuous evolution of augmented and virtual reality (AR/VR) technologies may necessitate the development of high-capacity, low-latency optical communication systems where Er Doped Fibers will play a vital role.
Leading Players in the Er Doped Fiber Sector
- Le Verre Fluoré
- Thorlabs
- Raybium
- AMS Technologies
- Coractive
- Newport Corporation
Key Milestones in Er Doped Fiber Industry
- 2019: Significant advancements in low-noise EDFAs for submarine cable systems, enabling higher data transmission capacities.
- 2020: Introduction of compact and high-power Er Doped Fiber lasers for industrial cutting and welding applications.
- 2021: Increased research and development focus on novel doping techniques to extend the operational wavelength range of Er Doped Fibers.
- 2022: Accelerated adoption of Er Doped Fiber amplifiers in the global deployment of 5G infrastructure.
- 2023: Emergence of specialized Er Doped Fibers for medical therapeutic applications, including skin rejuvenation and tumor treatment.
- 2024: Increased investment in R&D for Er Doped Fibers suitable for next-generation optical communication networks beyond 5G.
Strategic Outlook for Er Doped Fiber Market
The strategic outlook for the Er Doped Fiber market is highly positive, driven by the confluence of several growth accelerators. The ongoing digital transformation and the relentless pursuit of higher bandwidth across all sectors will continue to fuel demand for robust optical amplification solutions. Investments in next-generation telecommunication infrastructure, coupled with the expanding applications in scientific research and healthcare, will solidify the market's upward trajectory. Companies that focus on continuous innovation, cost optimization, and strategic market penetration, particularly in emerging geographical regions and application areas, are poised for significant growth and market leadership.
Er Doped Fiber Segmentation
-
1. Application
- 1.1. Medical
- 1.2. Industrial
- 1.3. Telecommunication
- 1.4. Scientific Research
- 1.5. Military and Defense
- 1.6. Environmental Monitoring
- 1.7. Others
-
2. Type
- 2.1. Single Mode Fiber
- 2.2. Double Mode Fiber
Er Doped Fiber Segmentation By Geography
-
1. North America
- 1.1. United States
- 1.2. Canada
- 1.3. Mexico
-
2. South America
- 2.1. Brazil
- 2.2. Argentina
- 2.3. Rest of South America
-
3. Europe
- 3.1. United Kingdom
- 3.2. Germany
- 3.3. France
- 3.4. Italy
- 3.5. Spain
- 3.6. Russia
- 3.7. Benelux
- 3.8. Nordics
- 3.9. Rest of Europe
-
4. Middle East & Africa
- 4.1. Turkey
- 4.2. Israel
- 4.3. GCC
- 4.4. North Africa
- 4.5. South Africa
- 4.6. Rest of Middle East & Africa
-
5. Asia Pacific
- 5.1. China
- 5.2. India
- 5.3. Japan
- 5.4. South Korea
- 5.5. ASEAN
- 5.6. Oceania
- 5.7. Rest of Asia Pacific
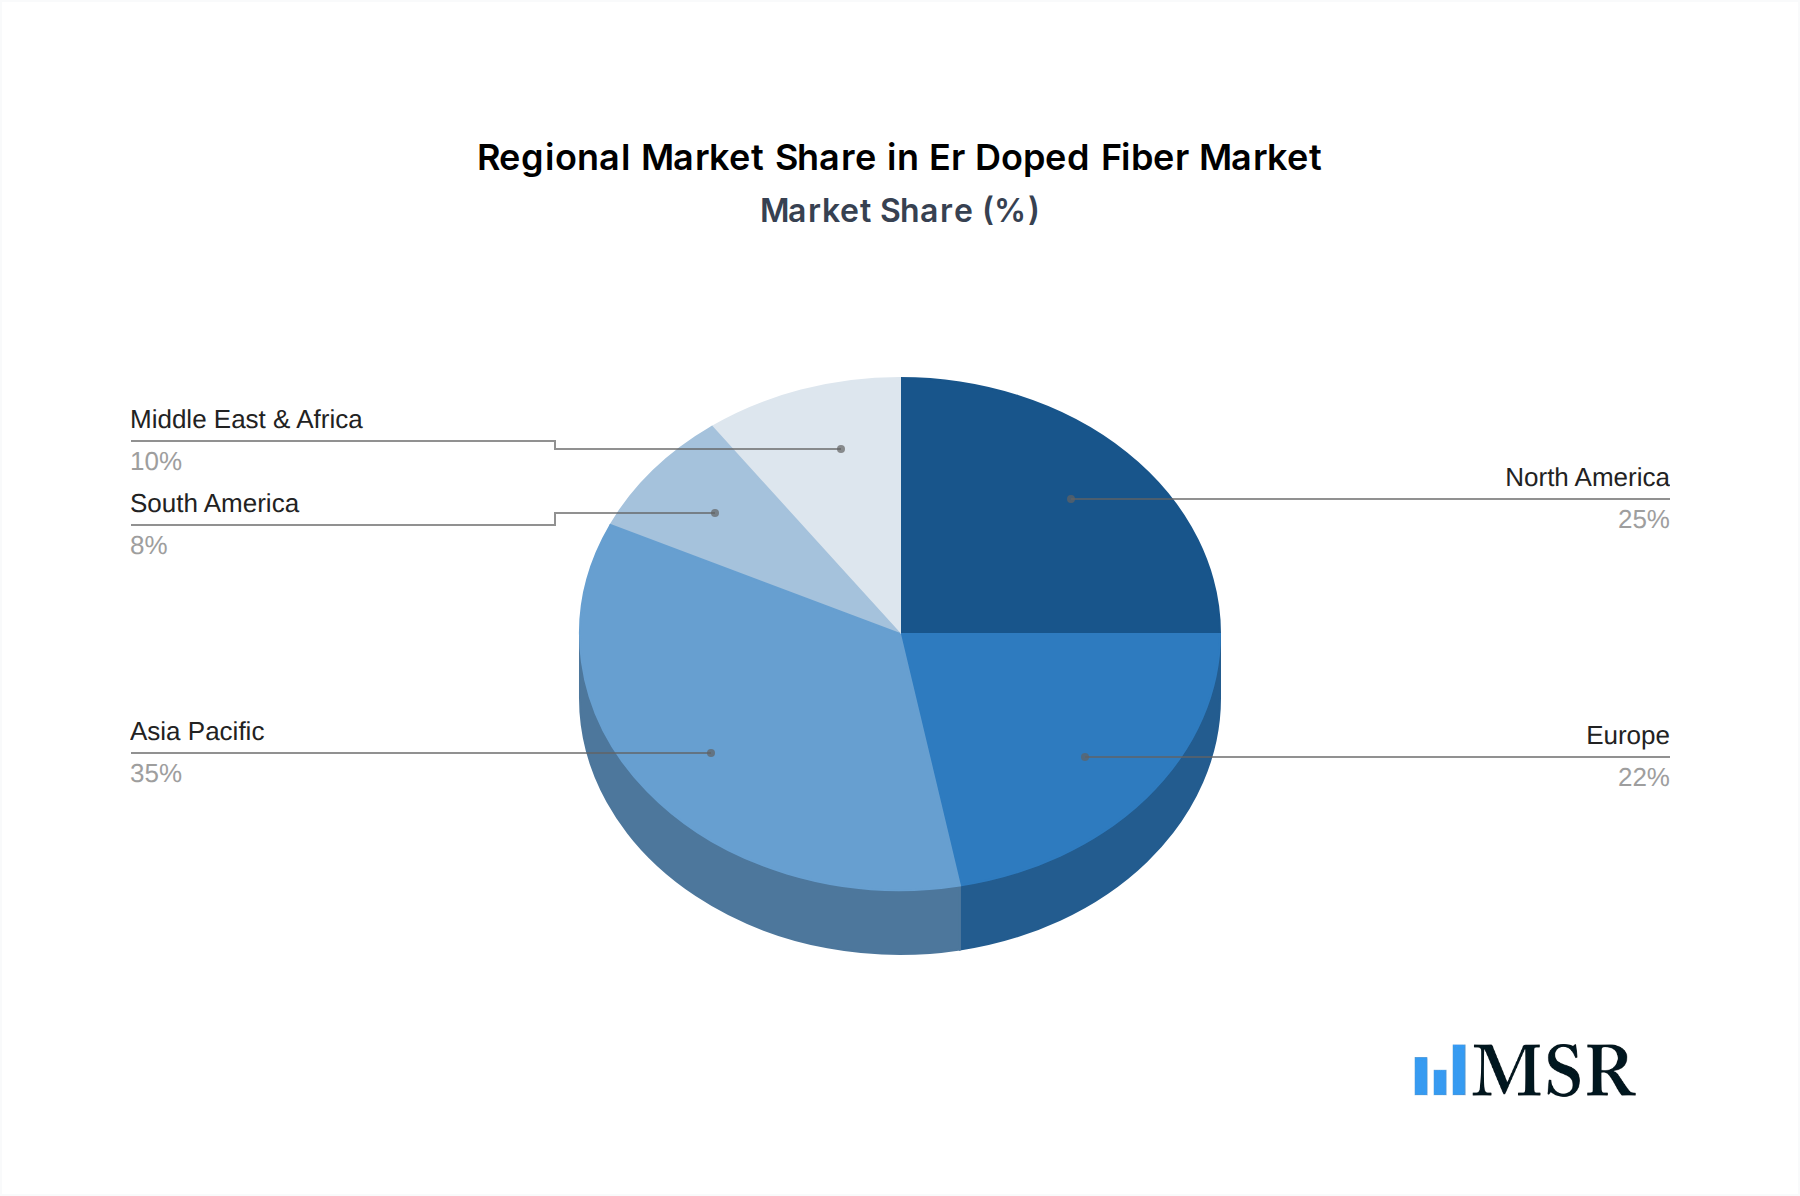
Er Doped Fiber Regional Market Share
Geographic Coverage of Er Doped Fiber
Er Doped Fiber REPORT HIGHLIGHTS
| Aspects | Details |
|---|---|
| Study Period | 2020-2034 |
| Base Year | 2025 |
| Estimated Year | 2026 |
| Forecast Period | 2026-2034 |
| Historical Period | 2020-2025 |
| Growth Rate | CAGR of 11.4% from 2020-2034 |
| Segmentation |
|
Table of Contents
- 1. Introduction
- 1.1. Research Scope
- 1.2. Market Segmentation
- 1.3. Research Methodology
- 1.4. Definitions and Assumptions
- 2. Executive Summary
- 2.1. Introduction
- 3. Market Dynamics
- 3.1. Introduction
- 3.2. Market Drivers
- 3.3. Market Restrains
- 3.4. Market Trends
- 4. Market Factor Analysis
- 4.1. Porters Five Forces
- 4.2. Supply/Value Chain
- 4.3. PESTEL analysis
- 4.4. Market Entropy
- 4.5. Patent/Trademark Analysis
- 5. Global Er Doped Fiber Analysis, Insights and Forecast, 2020-2032
- 5.1. Market Analysis, Insights and Forecast - by Application
- 5.1.1. Medical
- 5.1.2. Industrial
- 5.1.3. Telecommunication
- 5.1.4. Scientific Research
- 5.1.5. Military and Defense
- 5.1.6. Environmental Monitoring
- 5.1.7. Others
- 5.2. Market Analysis, Insights and Forecast - by Type
- 5.2.1. Single Mode Fiber
- 5.2.2. Double Mode Fiber
- 5.3. Market Analysis, Insights and Forecast - by Region
- 5.3.1. North America
- 5.3.2. South America
- 5.3.3. Europe
- 5.3.4. Middle East & Africa
- 5.3.5. Asia Pacific
- 5.1. Market Analysis, Insights and Forecast - by Application
- 6. North America Er Doped Fiber Analysis, Insights and Forecast, 2020-2032
- 6.1. Market Analysis, Insights and Forecast - by Application
- 6.1.1. Medical
- 6.1.2. Industrial
- 6.1.3. Telecommunication
- 6.1.4. Scientific Research
- 6.1.5. Military and Defense
- 6.1.6. Environmental Monitoring
- 6.1.7. Others
- 6.2. Market Analysis, Insights and Forecast - by Type
- 6.2.1. Single Mode Fiber
- 6.2.2. Double Mode Fiber
- 6.1. Market Analysis, Insights and Forecast - by Application
- 7. South America Er Doped Fiber Analysis, Insights and Forecast, 2020-2032
- 7.1. Market Analysis, Insights and Forecast - by Application
- 7.1.1. Medical
- 7.1.2. Industrial
- 7.1.3. Telecommunication
- 7.1.4. Scientific Research
- 7.1.5. Military and Defense
- 7.1.6. Environmental Monitoring
- 7.1.7. Others
- 7.2. Market Analysis, Insights and Forecast - by Type
- 7.2.1. Single Mode Fiber
- 7.2.2. Double Mode Fiber
- 7.1. Market Analysis, Insights and Forecast - by Application
- 8. Europe Er Doped Fiber Analysis, Insights and Forecast, 2020-2032
- 8.1. Market Analysis, Insights and Forecast - by Application
- 8.1.1. Medical
- 8.1.2. Industrial
- 8.1.3. Telecommunication
- 8.1.4. Scientific Research
- 8.1.5. Military and Defense
- 8.1.6. Environmental Monitoring
- 8.1.7. Others
- 8.2. Market Analysis, Insights and Forecast - by Type
- 8.2.1. Single Mode Fiber
- 8.2.2. Double Mode Fiber
- 8.1. Market Analysis, Insights and Forecast - by Application
- 9. Middle East & Africa Er Doped Fiber Analysis, Insights and Forecast, 2020-2032
- 9.1. Market Analysis, Insights and Forecast - by Application
- 9.1.1. Medical
- 9.1.2. Industrial
- 9.1.3. Telecommunication
- 9.1.4. Scientific Research
- 9.1.5. Military and Defense
- 9.1.6. Environmental Monitoring
- 9.1.7. Others
- 9.2. Market Analysis, Insights and Forecast - by Type
- 9.2.1. Single Mode Fiber
- 9.2.2. Double Mode Fiber
- 9.1. Market Analysis, Insights and Forecast - by Application
- 10. Asia Pacific Er Doped Fiber Analysis, Insights and Forecast, 2020-2032
- 10.1. Market Analysis, Insights and Forecast - by Application
- 10.1.1. Medical
- 10.1.2. Industrial
- 10.1.3. Telecommunication
- 10.1.4. Scientific Research
- 10.1.5. Military and Defense
- 10.1.6. Environmental Monitoring
- 10.1.7. Others
- 10.2. Market Analysis, Insights and Forecast - by Type
- 10.2.1. Single Mode Fiber
- 10.2.2. Double Mode Fiber
- 10.1. Market Analysis, Insights and Forecast - by Application
- 11. Competitive Analysis
- 11.1. Global Market Share Analysis 2025
- 11.2. Company Profiles
- 11.2.1 Le Verre Fluoré
- 11.2.1.1. Overview
- 11.2.1.2. Products
- 11.2.1.3. SWOT Analysis
- 11.2.1.4. Recent Developments
- 11.2.1.5. Financials (Based on Availability)
- 11.2.2 Thorlabs
- 11.2.2.1. Overview
- 11.2.2.2. Products
- 11.2.2.3. SWOT Analysis
- 11.2.2.4. Recent Developments
- 11.2.2.5. Financials (Based on Availability)
- 11.2.3 Raybium
- 11.2.3.1. Overview
- 11.2.3.2. Products
- 11.2.3.3. SWOT Analysis
- 11.2.3.4. Recent Developments
- 11.2.3.5. Financials (Based on Availability)
- 11.2.4 AMS Technologies
- 11.2.4.1. Overview
- 11.2.4.2. Products
- 11.2.4.3. SWOT Analysis
- 11.2.4.4. Recent Developments
- 11.2.4.5. Financials (Based on Availability)
- 11.2.5 Coractive
- 11.2.5.1. Overview
- 11.2.5.2. Products
- 11.2.5.3. SWOT Analysis
- 11.2.5.4. Recent Developments
- 11.2.5.5. Financials (Based on Availability)
- 11.2.6 Newport Corporation
- 11.2.6.1. Overview
- 11.2.6.2. Products
- 11.2.6.3. SWOT Analysis
- 11.2.6.4. Recent Developments
- 11.2.6.5. Financials (Based on Availability)
- 11.2.1 Le Verre Fluoré
List of Figures
- Figure 1: Global Er Doped Fiber Revenue Breakdown (undefined, %) by Region 2025 & 2033
- Figure 2: Global Er Doped Fiber Volume Breakdown (K, %) by Region 2025 & 2033
- Figure 3: North America Er Doped Fiber Revenue (undefined), by Application 2025 & 2033
- Figure 4: North America Er Doped Fiber Volume (K), by Application 2025 & 2033
- Figure 5: North America Er Doped Fiber Revenue Share (%), by Application 2025 & 2033
- Figure 6: North America Er Doped Fiber Volume Share (%), by Application 2025 & 2033
- Figure 7: North America Er Doped Fiber Revenue (undefined), by Type 2025 & 2033
- Figure 8: North America Er Doped Fiber Volume (K), by Type 2025 & 2033
- Figure 9: North America Er Doped Fiber Revenue Share (%), by Type 2025 & 2033
- Figure 10: North America Er Doped Fiber Volume Share (%), by Type 2025 & 2033
- Figure 11: North America Er Doped Fiber Revenue (undefined), by Country 2025 & 2033
- Figure 12: North America Er Doped Fiber Volume (K), by Country 2025 & 2033
- Figure 13: North America Er Doped Fiber Revenue Share (%), by Country 2025 & 2033
- Figure 14: North America Er Doped Fiber Volume Share (%), by Country 2025 & 2033
- Figure 15: South America Er Doped Fiber Revenue (undefined), by Application 2025 & 2033
- Figure 16: South America Er Doped Fiber Volume (K), by Application 2025 & 2033
- Figure 17: South America Er Doped Fiber Revenue Share (%), by Application 2025 & 2033
- Figure 18: South America Er Doped Fiber Volume Share (%), by Application 2025 & 2033
- Figure 19: South America Er Doped Fiber Revenue (undefined), by Type 2025 & 2033
- Figure 20: South America Er Doped Fiber Volume (K), by Type 2025 & 2033
- Figure 21: South America Er Doped Fiber Revenue Share (%), by Type 2025 & 2033
- Figure 22: South America Er Doped Fiber Volume Share (%), by Type 2025 & 2033
- Figure 23: South America Er Doped Fiber Revenue (undefined), by Country 2025 & 2033
- Figure 24: South America Er Doped Fiber Volume (K), by Country 2025 & 2033
- Figure 25: South America Er Doped Fiber Revenue Share (%), by Country 2025 & 2033
- Figure 26: South America Er Doped Fiber Volume Share (%), by Country 2025 & 2033
- Figure 27: Europe Er Doped Fiber Revenue (undefined), by Application 2025 & 2033
- Figure 28: Europe Er Doped Fiber Volume (K), by Application 2025 & 2033
- Figure 29: Europe Er Doped Fiber Revenue Share (%), by Application 2025 & 2033
- Figure 30: Europe Er Doped Fiber Volume Share (%), by Application 2025 & 2033
- Figure 31: Europe Er Doped Fiber Revenue (undefined), by Type 2025 & 2033
- Figure 32: Europe Er Doped Fiber Volume (K), by Type 2025 & 2033
- Figure 33: Europe Er Doped Fiber Revenue Share (%), by Type 2025 & 2033
- Figure 34: Europe Er Doped Fiber Volume Share (%), by Type 2025 & 2033
- Figure 35: Europe Er Doped Fiber Revenue (undefined), by Country 2025 & 2033
- Figure 36: Europe Er Doped Fiber Volume (K), by Country 2025 & 2033
- Figure 37: Europe Er Doped Fiber Revenue Share (%), by Country 2025 & 2033
- Figure 38: Europe Er Doped Fiber Volume Share (%), by Country 2025 & 2033
- Figure 39: Middle East & Africa Er Doped Fiber Revenue (undefined), by Application 2025 & 2033
- Figure 40: Middle East & Africa Er Doped Fiber Volume (K), by Application 2025 & 2033
- Figure 41: Middle East & Africa Er Doped Fiber Revenue Share (%), by Application 2025 & 2033
- Figure 42: Middle East & Africa Er Doped Fiber Volume Share (%), by Application 2025 & 2033
- Figure 43: Middle East & Africa Er Doped Fiber Revenue (undefined), by Type 2025 & 2033
- Figure 44: Middle East & Africa Er Doped Fiber Volume (K), by Type 2025 & 2033
- Figure 45: Middle East & Africa Er Doped Fiber Revenue Share (%), by Type 2025 & 2033
- Figure 46: Middle East & Africa Er Doped Fiber Volume Share (%), by Type 2025 & 2033
- Figure 47: Middle East & Africa Er Doped Fiber Revenue (undefined), by Country 2025 & 2033
- Figure 48: Middle East & Africa Er Doped Fiber Volume (K), by Country 2025 & 2033
- Figure 49: Middle East & Africa Er Doped Fiber Revenue Share (%), by Country 2025 & 2033
- Figure 50: Middle East & Africa Er Doped Fiber Volume Share (%), by Country 2025 & 2033
- Figure 51: Asia Pacific Er Doped Fiber Revenue (undefined), by Application 2025 & 2033
- Figure 52: Asia Pacific Er Doped Fiber Volume (K), by Application 2025 & 2033
- Figure 53: Asia Pacific Er Doped Fiber Revenue Share (%), by Application 2025 & 2033
- Figure 54: Asia Pacific Er Doped Fiber Volume Share (%), by Application 2025 & 2033
- Figure 55: Asia Pacific Er Doped Fiber Revenue (undefined), by Type 2025 & 2033
- Figure 56: Asia Pacific Er Doped Fiber Volume (K), by Type 2025 & 2033
- Figure 57: Asia Pacific Er Doped Fiber Revenue Share (%), by Type 2025 & 2033
- Figure 58: Asia Pacific Er Doped Fiber Volume Share (%), by Type 2025 & 2033
- Figure 59: Asia Pacific Er Doped Fiber Revenue (undefined), by Country 2025 & 2033
- Figure 60: Asia Pacific Er Doped Fiber Volume (K), by Country 2025 & 2033
- Figure 61: Asia Pacific Er Doped Fiber Revenue Share (%), by Country 2025 & 2033
- Figure 62: Asia Pacific Er Doped Fiber Volume Share (%), by Country 2025 & 2033
List of Tables
- Table 1: Global Er Doped Fiber Revenue undefined Forecast, by Application 2020 & 2033
- Table 2: Global Er Doped Fiber Volume K Forecast, by Application 2020 & 2033
- Table 3: Global Er Doped Fiber Revenue undefined Forecast, by Type 2020 & 2033
- Table 4: Global Er Doped Fiber Volume K Forecast, by Type 2020 & 2033
- Table 5: Global Er Doped Fiber Revenue undefined Forecast, by Region 2020 & 2033
- Table 6: Global Er Doped Fiber Volume K Forecast, by Region 2020 & 2033
- Table 7: Global Er Doped Fiber Revenue undefined Forecast, by Application 2020 & 2033
- Table 8: Global Er Doped Fiber Volume K Forecast, by Application 2020 & 2033
- Table 9: Global Er Doped Fiber Revenue undefined Forecast, by Type 2020 & 2033
- Table 10: Global Er Doped Fiber Volume K Forecast, by Type 2020 & 2033
- Table 11: Global Er Doped Fiber Revenue undefined Forecast, by Country 2020 & 2033
- Table 12: Global Er Doped Fiber Volume K Forecast, by Country 2020 & 2033
- Table 13: United States Er Doped Fiber Revenue (undefined) Forecast, by Application 2020 & 2033
- Table 14: United States Er Doped Fiber Volume (K) Forecast, by Application 2020 & 2033
- Table 15: Canada Er Doped Fiber Revenue (undefined) Forecast, by Application 2020 & 2033
- Table 16: Canada Er Doped Fiber Volume (K) Forecast, by Application 2020 & 2033
- Table 17: Mexico Er Doped Fiber Revenue (undefined) Forecast, by Application 2020 & 2033
- Table 18: Mexico Er Doped Fiber Volume (K) Forecast, by Application 2020 & 2033
- Table 19: Global Er Doped Fiber Revenue undefined Forecast, by Application 2020 & 2033
- Table 20: Global Er Doped Fiber Volume K Forecast, by Application 2020 & 2033
- Table 21: Global Er Doped Fiber Revenue undefined Forecast, by Type 2020 & 2033
- Table 22: Global Er Doped Fiber Volume K Forecast, by Type 2020 & 2033
- Table 23: Global Er Doped Fiber Revenue undefined Forecast, by Country 2020 & 2033
- Table 24: Global Er Doped Fiber Volume K Forecast, by Country 2020 & 2033
- Table 25: Brazil Er Doped Fiber Revenue (undefined) Forecast, by Application 2020 & 2033
- Table 26: Brazil Er Doped Fiber Volume (K) Forecast, by Application 2020 & 2033
- Table 27: Argentina Er Doped Fiber Revenue (undefined) Forecast, by Application 2020 & 2033
- Table 28: Argentina Er Doped Fiber Volume (K) Forecast, by Application 2020 & 2033
- Table 29: Rest of South America Er Doped Fiber Revenue (undefined) Forecast, by Application 2020 & 2033
- Table 30: Rest of South America Er Doped Fiber Volume (K) Forecast, by Application 2020 & 2033
- Table 31: Global Er Doped Fiber Revenue undefined Forecast, by Application 2020 & 2033
- Table 32: Global Er Doped Fiber Volume K Forecast, by Application 2020 & 2033
- Table 33: Global Er Doped Fiber Revenue undefined Forecast, by Type 2020 & 2033
- Table 34: Global Er Doped Fiber Volume K Forecast, by Type 2020 & 2033
- Table 35: Global Er Doped Fiber Revenue undefined Forecast, by Country 2020 & 2033
- Table 36: Global Er Doped Fiber Volume K Forecast, by Country 2020 & 2033
- Table 37: United Kingdom Er Doped Fiber Revenue (undefined) Forecast, by Application 2020 & 2033
- Table 38: United Kingdom Er Doped Fiber Volume (K) Forecast, by Application 2020 & 2033
- Table 39: Germany Er Doped Fiber Revenue (undefined) Forecast, by Application 2020 & 2033
- Table 40: Germany Er Doped Fiber Volume (K) Forecast, by Application 2020 & 2033
- Table 41: France Er Doped Fiber Revenue (undefined) Forecast, by Application 2020 & 2033
- Table 42: France Er Doped Fiber Volume (K) Forecast, by Application 2020 & 2033
- Table 43: Italy Er Doped Fiber Revenue (undefined) Forecast, by Application 2020 & 2033
- Table 44: Italy Er Doped Fiber Volume (K) Forecast, by Application 2020 & 2033
- Table 45: Spain Er Doped Fiber Revenue (undefined) Forecast, by Application 2020 & 2033
- Table 46: Spain Er Doped Fiber Volume (K) Forecast, by Application 2020 & 2033
- Table 47: Russia Er Doped Fiber Revenue (undefined) Forecast, by Application 2020 & 2033
- Table 48: Russia Er Doped Fiber Volume (K) Forecast, by Application 2020 & 2033
- Table 49: Benelux Er Doped Fiber Revenue (undefined) Forecast, by Application 2020 & 2033
- Table 50: Benelux Er Doped Fiber Volume (K) Forecast, by Application 2020 & 2033
- Table 51: Nordics Er Doped Fiber Revenue (undefined) Forecast, by Application 2020 & 2033
- Table 52: Nordics Er Doped Fiber Volume (K) Forecast, by Application 2020 & 2033
- Table 53: Rest of Europe Er Doped Fiber Revenue (undefined) Forecast, by Application 2020 & 2033
- Table 54: Rest of Europe Er Doped Fiber Volume (K) Forecast, by Application 2020 & 2033
- Table 55: Global Er Doped Fiber Revenue undefined Forecast, by Application 2020 & 2033
- Table 56: Global Er Doped Fiber Volume K Forecast, by Application 2020 & 2033
- Table 57: Global Er Doped Fiber Revenue undefined Forecast, by Type 2020 & 2033
- Table 58: Global Er Doped Fiber Volume K Forecast, by Type 2020 & 2033
- Table 59: Global Er Doped Fiber Revenue undefined Forecast, by Country 2020 & 2033
- Table 60: Global Er Doped Fiber Volume K Forecast, by Country 2020 & 2033
- Table 61: Turkey Er Doped Fiber Revenue (undefined) Forecast, by Application 2020 & 2033
- Table 62: Turkey Er Doped Fiber Volume (K) Forecast, by Application 2020 & 2033
- Table 63: Israel Er Doped Fiber Revenue (undefined) Forecast, by Application 2020 & 2033
- Table 64: Israel Er Doped Fiber Volume (K) Forecast, by Application 2020 & 2033
- Table 65: GCC Er Doped Fiber Revenue (undefined) Forecast, by Application 2020 & 2033
- Table 66: GCC Er Doped Fiber Volume (K) Forecast, by Application 2020 & 2033
- Table 67: North Africa Er Doped Fiber Revenue (undefined) Forecast, by Application 2020 & 2033
- Table 68: North Africa Er Doped Fiber Volume (K) Forecast, by Application 2020 & 2033
- Table 69: South Africa Er Doped Fiber Revenue (undefined) Forecast, by Application 2020 & 2033
- Table 70: South Africa Er Doped Fiber Volume (K) Forecast, by Application 2020 & 2033
- Table 71: Rest of Middle East & Africa Er Doped Fiber Revenue (undefined) Forecast, by Application 2020 & 2033
- Table 72: Rest of Middle East & Africa Er Doped Fiber Volume (K) Forecast, by Application 2020 & 2033
- Table 73: Global Er Doped Fiber Revenue undefined Forecast, by Application 2020 & 2033
- Table 74: Global Er Doped Fiber Volume K Forecast, by Application 2020 & 2033
- Table 75: Global Er Doped Fiber Revenue undefined Forecast, by Type 2020 & 2033
- Table 76: Global Er Doped Fiber Volume K Forecast, by Type 2020 & 2033
- Table 77: Global Er Doped Fiber Revenue undefined Forecast, by Country 2020 & 2033
- Table 78: Global Er Doped Fiber Volume K Forecast, by Country 2020 & 2033
- Table 79: China Er Doped Fiber Revenue (undefined) Forecast, by Application 2020 & 2033
- Table 80: China Er Doped Fiber Volume (K) Forecast, by Application 2020 & 2033
- Table 81: India Er Doped Fiber Revenue (undefined) Forecast, by Application 2020 & 2033
- Table 82: India Er Doped Fiber Volume (K) Forecast, by Application 2020 & 2033
- Table 83: Japan Er Doped Fiber Revenue (undefined) Forecast, by Application 2020 & 2033
- Table 84: Japan Er Doped Fiber Volume (K) Forecast, by Application 2020 & 2033
- Table 85: South Korea Er Doped Fiber Revenue (undefined) Forecast, by Application 2020 & 2033
- Table 86: South Korea Er Doped Fiber Volume (K) Forecast, by Application 2020 & 2033
- Table 87: ASEAN Er Doped Fiber Revenue (undefined) Forecast, by Application 2020 & 2033
- Table 88: ASEAN Er Doped Fiber Volume (K) Forecast, by Application 2020 & 2033
- Table 89: Oceania Er Doped Fiber Revenue (undefined) Forecast, by Application 2020 & 2033
- Table 90: Oceania Er Doped Fiber Volume (K) Forecast, by Application 2020 & 2033
- Table 91: Rest of Asia Pacific Er Doped Fiber Revenue (undefined) Forecast, by Application 2020 & 2033
- Table 92: Rest of Asia Pacific Er Doped Fiber Volume (K) Forecast, by Application 2020 & 2033
Frequently Asked Questions
1. What is the projected Compound Annual Growth Rate (CAGR) of the Er Doped Fiber?
The projected CAGR is approximately 11.4%.
2. Which companies are prominent players in the Er Doped Fiber?
Key companies in the market include Le Verre Fluoré, Thorlabs, Raybium, AMS Technologies, Coractive, Newport Corporation.
3. What are the main segments of the Er Doped Fiber?
The market segments include Application, Type.
4. Can you provide details about the market size?
The market size is estimated to be USD XXX N/A as of 2022.
5. What are some drivers contributing to market growth?
N/A
6. What are the notable trends driving market growth?
N/A
7. Are there any restraints impacting market growth?
N/A
8. Can you provide examples of recent developments in the market?
N/A
9. What pricing options are available for accessing the report?
Pricing options include single-user, multi-user, and enterprise licenses priced at USD 3950.00, USD 5925.00, and USD 7900.00 respectively.
10. Is the market size provided in terms of value or volume?
The market size is provided in terms of value, measured in N/A and volume, measured in K.
11. Are there any specific market keywords associated with the report?
Yes, the market keyword associated with the report is "Er Doped Fiber," which aids in identifying and referencing the specific market segment covered.
12. How do I determine which pricing option suits my needs best?
The pricing options vary based on user requirements and access needs. Individual users may opt for single-user licenses, while businesses requiring broader access may choose multi-user or enterprise licenses for cost-effective access to the report.
13. Are there any additional resources or data provided in the Er Doped Fiber report?
While the report offers comprehensive insights, it's advisable to review the specific contents or supplementary materials provided to ascertain if additional resources or data are available.
14. How can I stay updated on further developments or reports in the Er Doped Fiber?
To stay informed about further developments, trends, and reports in the Er Doped Fiber, consider subscribing to industry newsletters, following relevant companies and organizations, or regularly checking reputable industry news sources and publications.
Methodology
Step 1 - Identification of Relevant Samples Size from Population Database


Step 2 - Approaches for Defining Global Market Size (Value, Volume* & Price*)

Note*: In applicable scenarios
Step 3 - Data Sources
Primary Research
- Web Analytics
- Survey Reports
- Research Institute
- Latest Research Reports
- Opinion Leaders
Secondary Research
- Annual Reports
- White Paper
- Latest Press Release
- Industry Association
- Paid Database
- Investor Presentations

Step 4 - Data Triangulation
Involves using different sources of information in order to increase the validity of a study
These sources are likely to be stakeholders in a program - participants, other researchers, program staff, other community members, and so on.
Then we put all data in single framework & apply various statistical tools to find out the dynamic on the market.
During the analysis stage, feedback from the stakeholder groups would be compared to determine areas of agreement as well as areas of divergence