

Key Insights
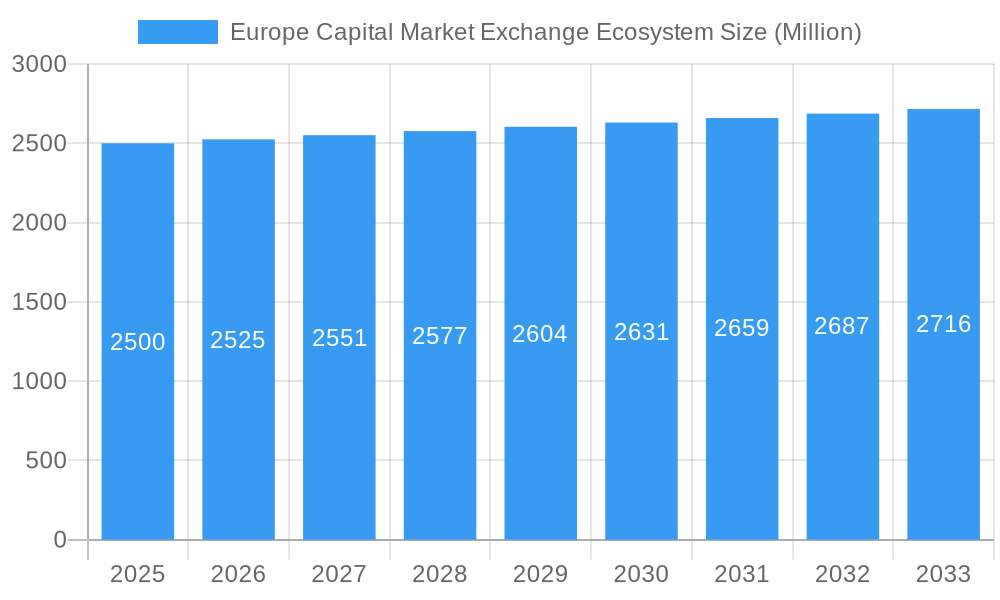
The European capital market exchange ecosystem, featuring prominent entities like Euronext, Nasdaq Nordic, and the London Stock Exchange, demonstrates robust expansion. Key growth drivers include escalating cross-border investment, rapid technological advancements, and a rising number of publicly listed companies. The market is projected to achieve a Compound Annual Growth Rate (CAGR) of 5.8%, underscoring sustained growth. This expansion is further fueled by regulatory reforms enhancing market efficiency, the proliferation of fintech solutions improving trading capabilities, and increasing demand for sophisticated financial instruments. Nevertheless, challenges persist, such as geopolitical instability impacting investor confidence, the ongoing effects of Brexit on international transactions, and potential competition from alternative trading venues. The market is segmented by equities, bonds, derivatives, and other financial instruments, with varying growth trajectories influenced by market sentiment and economic conditions. Regional growth disparities are anticipated, with more vibrant economic zones in Western Europe expected to outperform regions facing economic challenges.
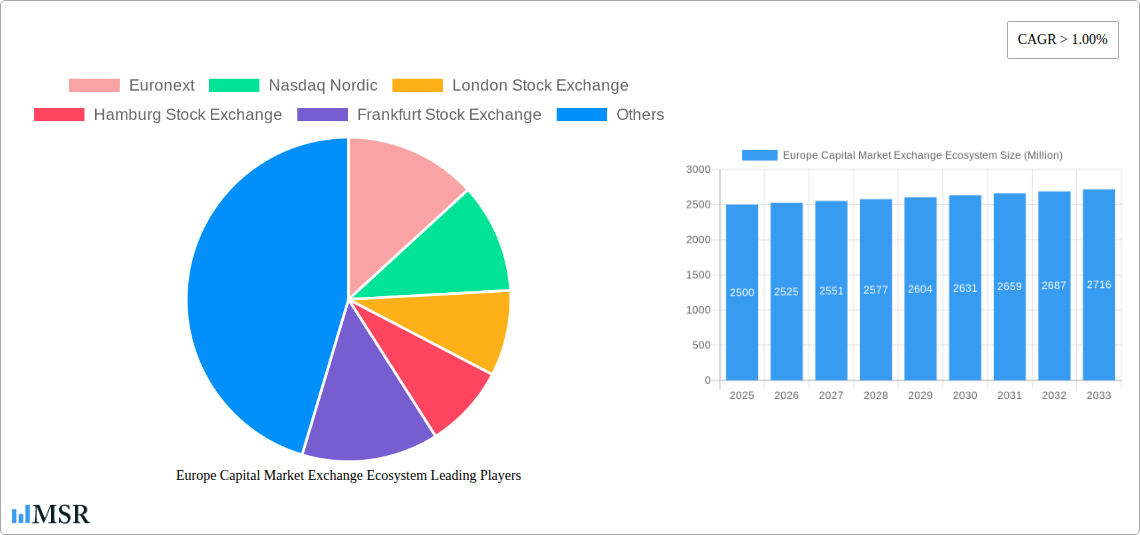
Europe Capital Market Exchange Ecosystem Market Size (In Million)
The forecast period from 2025 to 2033 presents substantial opportunities for market participants. Strategic alliances, continuous technological innovation, and strict regulatory adherence will be paramount for success. Further in-depth research, incorporating granular data on specific market segments and regional performance, is essential to refine growth projections. Expansion into emerging European markets, coupled with a focus on sustainable and ethical investment principles, represents a significant avenue for future growth. Companies are poised to leverage data analytics and artificial intelligence to gain deeper insights into market trends and optimize trading strategies. The dynamic evolution of regulatory frameworks will necessitate agile business models that prioritize compliance and transparency.
Europe Capital Market Exchange Ecosystem Company Market Share
Europe Capital Market Exchange Ecosystem: Market Analysis & Forecast (2025-2033)
This comprehensive report offers a detailed analysis of the Europe Capital Market Exchange Ecosystem, examining market dynamics, industry trends, key stakeholders, and future growth prospects. The study period encompasses 2025-2033, with 2025 serving as the base year. Leveraging historical data from 2019-2024, this report delivers precise and insightful predictions. It is an indispensable resource for investors, industry stakeholders, and anyone seeking to comprehend the intricacies and potential of this dynamic market. The European capital markets, with an estimated market size of 151.36 million in 2025, are undergoing significant transformation driven by technological innovation, regulatory shifts, and evolving investor behaviors. This report provides actionable intelligence for strategic decision-making.
Europe Capital Market Exchange Ecosystem Market Concentration & Dynamics
This section analyzes the competitive landscape, encompassing market concentration, innovation, regulations, substitutes, end-user trends, and mergers and acquisitions (M&A) activity within the European capital market exchange ecosystem.
The European capital market exchange ecosystem is characterized by a moderately concentrated market structure. Key players such as Euronext, London Stock Exchange, and Deutsche Börse (Frankfurt Stock Exchange) hold significant market share, while numerous smaller exchanges cater to niche segments. The estimated market share for Euronext in 2025 is xx%, London Stock Exchange xx%, and Deutsche Börse xx%. However, the level of concentration varies significantly across different segments and geographies.
- Market Share: Significant variations exist across different asset classes and geographical regions.
- Innovation Ecosystems: Incubators and accelerators are fostering innovation in fintech and regtech, particularly in areas like blockchain and AI-driven trading.
- Regulatory Frameworks: MiFID II and other regulations significantly shape market operations and drive innovation in compliance technologies.
- Substitute Products: The emergence of decentralized finance (DeFi) platforms presents a potential long-term challenge to traditional exchanges.
- End-User Trends: The increasing use of algorithmic trading and high-frequency trading is changing market dynamics.
- M&A Activity: The number of M&A deals in the European capital market exchange ecosystem averaged xx per year between 2019 and 2024, indicating a moderate level of consolidation.
Europe Capital Market Exchange Ecosystem Industry Insights & Trends
This section examines the key drivers, technological disruptions, and evolving consumer behaviors influencing the growth of the Europe Capital Market Exchange Ecosystem. The market is projected to experience a Compound Annual Growth Rate (CAGR) of xx% during the forecast period (2025-2033), reaching an estimated value of EUR XX Million by 2033.
Several factors are driving market growth, including increasing globalization, rising institutional investment, the growth of exchange-traded products (ETPs), and technological advancements like blockchain technology and AI. However, regulatory uncertainty and geopolitical risks present challenges to sustainable growth. Technological disruptions, such as the rise of algorithmic trading and the increasing adoption of digital assets, are reshaping the market landscape. Consumer behavior is also evolving, with investors increasingly demanding greater transparency, efficiency, and access to sophisticated trading tools.
Key Markets & Segments Leading Europe Capital Market Exchange Ecosystem
This section identifies the dominant regions, countries, and segments within the European capital market exchange ecosystem. The UK, France, and Germany are currently the leading markets, benefiting from established infrastructure, deep liquidity, and strong regulatory frameworks. However, other markets, such as the Nordic countries, are experiencing rapid growth driven by technological advancements and robust innovation ecosystems.
- Dominant Regions: The UK, France, and Germany maintain their dominance due to:
- Established infrastructure
- Deep liquidity pools
- Robust regulatory frameworks
- Large investor bases
- Growth Drivers:
- Economic growth in key European economies
- Strong investor confidence
- Government initiatives promoting financial innovation
The dominance of these regions is expected to continue, albeit with increasing competition from other emerging markets within the EU.
Europe Capital Market Exchange Ecosystem Product Developments
Recent product innovations focus on enhancing trading efficiency, improving data analytics capabilities, and strengthening regulatory compliance. The introduction of new trading platforms, advanced order management systems, and sophisticated risk management tools are enhancing the competitiveness of European exchanges. Technological advancements, such as the use of artificial intelligence (AI) and machine learning (ML) for fraud detection and algorithmic trading, are significantly impacting the market.
Challenges in the Europe Capital Market Exchange Ecosystem Market
The European capital market exchange ecosystem faces several challenges, including regulatory hurdles, increasing competition from global players, cybersecurity threats, and the need for continuous technological upgrades to maintain a competitive edge. The cost of compliance with evolving regulations places a considerable burden on smaller exchanges. The impact of geopolitical uncertainty and Brexit on market sentiment also poses a significant challenge.
Forces Driving Europe Capital Market Exchange Ecosystem Growth
Key growth drivers include the increasing adoption of digital assets, the growth of fintech and regtech, increasing demand for ESG investing, and supportive government policies promoting financial innovation. Technological advancements, such as the use of blockchain technology and artificial intelligence, are further driving efficiency and innovation.
Long-Term Growth Catalysts in the Europe Capital Market Exchange Ecosystem
Long-term growth will be fueled by continued innovation in trading technologies, strategic partnerships between exchanges and fintech companies, and the expansion into new markets, including those in Central and Eastern Europe. The increased focus on ESG investing will further drive growth within specific segments.
Emerging Opportunities in Europe Capital Market Exchange Ecosystem
Emerging opportunities include the expansion of digital asset trading platforms, the growing demand for sustainable finance products, and the integration of AI and machine learning into trading and risk management processes. The development of innovative financial products tailored to meet the evolving needs of investors will also present significant growth opportunities.
Leading Players in the Europe Capital Market Exchange Ecosystem Sector
- Euronext
- Nasdaq Nordic
- London Stock Exchange
- Hamburg Stock Exchange
- Frankfurt Stock Exchange
- Italian Stock Exchange
- SIX Swiss Exchange
- Budapest Stock Exchange
- Moscow Exchange
- Ukrainian Exchange
Key Milestones in Europe Capital Market Exchange Ecosystem Industry
- October 2023: Euronext introduced a new VaR-based margin methodology on the Euronext Milan equities, ETF, and financial derivatives markets, improving risk management and market stability.
- March 2023: Innovate UK and the London Stock Exchange partnered to enhance financial access for innovative businesses, unlocking EUR 6 trillion of long-term capital for growth and innovation in the UK.
Strategic Outlook for Europe Capital Market Exchange Ecosystem Market
The future of the European capital market exchange ecosystem is bright, driven by technological advancements, regulatory reforms, and the increasing demand for sophisticated financial products. Strategic opportunities lie in expanding into new markets, developing innovative trading platforms, and strengthening partnerships to further enhance market efficiency and competitiveness. The ecosystem will continue to evolve, requiring exchanges to adapt to emerging technologies and changing investor preferences to maintain their leading positions.
Europe Capital Market Exchange Ecosystem Segmentation
-
1. Type of Market
- 1.1. Primary Market
- 1.2. Secondary Market
-
2. Financial Instruments
- 2.1. Debt
- 2.2. Equity
-
3. Investors
- 3.1. Retail Investors
- 3.2. Institutional Investors
Europe Capital Market Exchange Ecosystem Segmentation By Geography
-
1. Europe
- 1.1. United Kingdom
- 1.2. Germany
- 1.3. France
- 1.4. Italy
- 1.5. Spain
- 1.6. Netherlands
- 1.7. Belgium
- 1.8. Sweden
- 1.9. Norway
- 1.10. Poland
- 1.11. Denmark
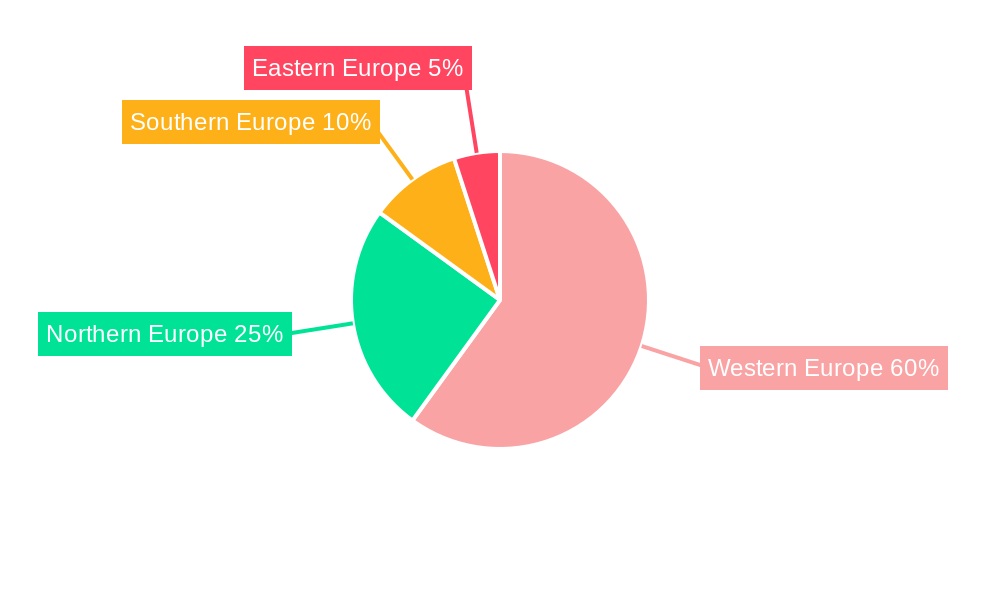
Europe Capital Market Exchange Ecosystem Regional Market Share
Geographic Coverage of Europe Capital Market Exchange Ecosystem
Europe Capital Market Exchange Ecosystem REPORT HIGHLIGHTS
| Aspects | Details |
|---|---|
| Study Period | 2020-2034 |
| Base Year | 2025 |
| Estimated Year | 2026 |
| Forecast Period | 2026-2034 |
| Historical Period | 2020-2025 |
| Growth Rate | CAGR of 5.8% from 2020-2034 |
| Segmentation |
|
Table of Contents
- 1. Introduction
- 1.1. Research Scope
- 1.2. Market Segmentation
- 1.3. Research Objective
- 1.4. Definitions and Assumptions
- 2. Executive Summary
- 2.1. Market Snapshot
- 3. Market Dynamics
- 3.1. Market Drivers
- 3.2. Market Restrains
- 3.3. Market Trends
- 3.4. Market Opportunities
- 4. Market Factor Analysis
- 4.1. Porters Five Forces
- 4.1.1. Bargaining Power of Suppliers
- 4.1.2. Bargaining Power of Buyers
- 4.1.3. Threat of New Entrants
- 4.1.4. Threat of Substitutes
- 4.1.5. Competitive Rivalry
- 4.2. PESTEL analysis
- 4.3. BCG Analysis
- 4.3.1. Stars (High Growth, High Market Share)
- 4.3.2. Cash Cows (Low Growth, High Market Share)
- 4.3.3. Question Mark (High Growth, Low Market Share)
- 4.3.4. Dogs (Low Growth, Low Market Share)
- 4.4. Ansoff Matrix Analysis
- 4.5. Supply Chain Analysis
- 4.6. Regulatory Landscape
- 4.7. Current Market Potential and Opportunity Assessment (TAM–SAM–SOM Framework)
- 4.8. MSR Analyst Note
- 4.1. Porters Five Forces
- 5. Market Analysis, Insights and Forecast 2021-2033
- 5.1. Market Analysis, Insights and Forecast - by Type of Market
- 5.1.1. Primary Market
- 5.1.2. Secondary Market
- 5.2. Market Analysis, Insights and Forecast - by Financial Instruments
- 5.2.1. Debt
- 5.2.2. Equity
- 5.3. Market Analysis, Insights and Forecast - by Investors
- 5.3.1. Retail Investors
- 5.3.2. Institutional Investors
- 5.4. Market Analysis, Insights and Forecast - by Region
- 5.4.1. Europe
- 5.1. Market Analysis, Insights and Forecast - by Type of Market
- 6. Europe Capital Market Exchange Ecosystem Analysis, Insights and Forecast, 2021-2033
- 6.1. Market Analysis, Insights and Forecast - by Type of Market
- 6.1.1. Primary Market
- 6.1.2. Secondary Market
- 6.2. Market Analysis, Insights and Forecast - by Financial Instruments
- 6.2.1. Debt
- 6.2.2. Equity
- 6.3. Market Analysis, Insights and Forecast - by Investors
- 6.3.1. Retail Investors
- 6.3.2. Institutional Investors
- 6.1. Market Analysis, Insights and Forecast - by Type of Market
- 7. Competitive Analysis
- 7.1. Company Profiles
- 7.1.1 Euronext
- 7.1.1.1. Company Overview
- 7.1.1.2. Products
- 7.1.1.3. Company Financials
- 7.1.1.4. SWOT Analysis
- 7.1.2 Nasdaq Nordic
- 7.1.2.1. Company Overview
- 7.1.2.2. Products
- 7.1.2.3. Company Financials
- 7.1.2.4. SWOT Analysis
- 7.1.3 London Stock Exchange
- 7.1.3.1. Company Overview
- 7.1.3.2. Products
- 7.1.3.3. Company Financials
- 7.1.3.4. SWOT Analysis
- 7.1.4 Hamburg Stock Exchange
- 7.1.4.1. Company Overview
- 7.1.4.2. Products
- 7.1.4.3. Company Financials
- 7.1.4.4. SWOT Analysis
- 7.1.5 Frankfurt Stock Exchange
- 7.1.5.1. Company Overview
- 7.1.5.2. Products
- 7.1.5.3. Company Financials
- 7.1.5.4. SWOT Analysis
- 7.1.6 Italian Stock Exchange
- 7.1.6.1. Company Overview
- 7.1.6.2. Products
- 7.1.6.3. Company Financials
- 7.1.6.4. SWOT Analysis
- 7.1.7 SIX Swiss Exchange
- 7.1.7.1. Company Overview
- 7.1.7.2. Products
- 7.1.7.3. Company Financials
- 7.1.7.4. SWOT Analysis
- 7.1.8 Budapest Stock Exchange
- 7.1.8.1. Company Overview
- 7.1.8.2. Products
- 7.1.8.3. Company Financials
- 7.1.8.4. SWOT Analysis
- 7.1.9 Moscow Exchange
- 7.1.9.1. Company Overview
- 7.1.9.2. Products
- 7.1.9.3. Company Financials
- 7.1.9.4. SWOT Analysis
- 7.1.10 Ukrainian Exchange**List Not Exhaustive
- 7.1.10.1. Company Overview
- 7.1.10.2. Products
- 7.1.10.3. Company Financials
- 7.1.10.4. SWOT Analysis
- 7.1.1 Euronext
- 7.2. Market Entropy
- 7.2.1 Company's Key Areas Served
- 7.2.2 Recent Developments
- 7.3. Company Market Share Analysis 2025
- 7.3.1 Top 5 Companies Market Share Analysis
- 7.3.2 Top 3 Companies Market Share Analysis
- 7.4. List of Potential Customers
- 8. Research Methodology
List of Figures
- Figure 1: Europe Capital Market Exchange Ecosystem Revenue Breakdown (million, %) by Product 2025 & 2033
- Figure 2: Europe Capital Market Exchange Ecosystem Share (%) by Company 2025
List of Tables
- Table 1: Europe Capital Market Exchange Ecosystem Revenue million Forecast, by Type of Market 2020 & 2033
- Table 2: Europe Capital Market Exchange Ecosystem Revenue million Forecast, by Financial Instruments 2020 & 2033
- Table 3: Europe Capital Market Exchange Ecosystem Revenue million Forecast, by Investors 2020 & 2033
- Table 4: Europe Capital Market Exchange Ecosystem Revenue million Forecast, by Region 2020 & 2033
- Table 5: Europe Capital Market Exchange Ecosystem Revenue million Forecast, by Type of Market 2020 & 2033
- Table 6: Europe Capital Market Exchange Ecosystem Revenue million Forecast, by Financial Instruments 2020 & 2033
- Table 7: Europe Capital Market Exchange Ecosystem Revenue million Forecast, by Investors 2020 & 2033
- Table 8: Europe Capital Market Exchange Ecosystem Revenue million Forecast, by Country 2020 & 2033
- Table 9: United Kingdom Europe Capital Market Exchange Ecosystem Revenue (million) Forecast, by Application 2020 & 2033
- Table 10: Germany Europe Capital Market Exchange Ecosystem Revenue (million) Forecast, by Application 2020 & 2033
- Table 11: France Europe Capital Market Exchange Ecosystem Revenue (million) Forecast, by Application 2020 & 2033
- Table 12: Italy Europe Capital Market Exchange Ecosystem Revenue (million) Forecast, by Application 2020 & 2033
- Table 13: Spain Europe Capital Market Exchange Ecosystem Revenue (million) Forecast, by Application 2020 & 2033
- Table 14: Netherlands Europe Capital Market Exchange Ecosystem Revenue (million) Forecast, by Application 2020 & 2033
- Table 15: Belgium Europe Capital Market Exchange Ecosystem Revenue (million) Forecast, by Application 2020 & 2033
- Table 16: Sweden Europe Capital Market Exchange Ecosystem Revenue (million) Forecast, by Application 2020 & 2033
- Table 17: Norway Europe Capital Market Exchange Ecosystem Revenue (million) Forecast, by Application 2020 & 2033
- Table 18: Poland Europe Capital Market Exchange Ecosystem Revenue (million) Forecast, by Application 2020 & 2033
- Table 19: Denmark Europe Capital Market Exchange Ecosystem Revenue (million) Forecast, by Application 2020 & 2033
Frequently Asked Questions
1. What is the projected Compound Annual Growth Rate (CAGR) of the Europe Capital Market Exchange Ecosystem?
The projected CAGR is approximately 5.8%.
2. Which companies are prominent players in the Europe Capital Market Exchange Ecosystem?
Key companies in the market include Euronext, Nasdaq Nordic, London Stock Exchange, Hamburg Stock Exchange, Frankfurt Stock Exchange, Italian Stock Exchange, SIX Swiss Exchange, Budapest Stock Exchange, Moscow Exchange, Ukrainian Exchange**List Not Exhaustive.
3. What are the main segments of the Europe Capital Market Exchange Ecosystem?
The market segments include Type of Market, Financial Instruments, Investors.
4. Can you provide details about the market size?
The market size is estimated to be USD 151.36 million as of 2022.
5. What are some drivers contributing to market growth?
N/A
6. What are the notable trends driving market growth?
Significance of Primary Market in European Capital Market Exchange Ecosystem.
7. Are there any restraints impacting market growth?
N/A
8. Can you provide examples of recent developments in the market?
In October 2023, Euronext introduced a new VaR-based margin methodology on the Euronext Milan equities, ETF and financial derivatives markets.
9. What pricing options are available for accessing the report?
Pricing options include single-user, multi-user, and enterprise licenses priced at USD 4750, USD 4950, and USD 6800 respectively.
10. Is the market size provided in terms of value or volume?
The market size is provided in terms of value, measured in million.
11. Are there any specific market keywords associated with the report?
Yes, the market keyword associated with the report is "Europe Capital Market Exchange Ecosystem," which aids in identifying and referencing the specific market segment covered.
12. How do I determine which pricing option suits my needs best?
The pricing options vary based on user requirements and access needs. Individual users may opt for single-user licenses, while businesses requiring broader access may choose multi-user or enterprise licenses for cost-effective access to the report.
13. Are there any additional resources or data provided in the Europe Capital Market Exchange Ecosystem report?
While the report offers comprehensive insights, it's advisable to review the specific contents or supplementary materials provided to ascertain if additional resources or data are available.
14. How can I stay updated on further developments or reports in the Europe Capital Market Exchange Ecosystem?
To stay informed about further developments, trends, and reports in the Europe Capital Market Exchange Ecosystem, consider subscribing to industry newsletters, following relevant companies and organizations, or regularly checking reputable industry news sources and publications.
Methodology
Step 1 - Identification of Relevant Samples Size from Population Database


Step 2 - Approaches for Defining Global Market Size (Value, Volume* & Price*)

Note*: In applicable scenarios
Step 3 - Data Sources
Primary Research
- Web Analytics
- Survey Reports
- Research Institute
- Latest Research Reports
- Opinion Leaders
Secondary Research
- Annual Reports
- White Paper
- Latest Press Release
- Industry Association
- Paid Database
- Investor Presentations

Step 4 - Data Triangulation
Involves using different sources of information in order to increase the validity of a study
These sources are likely to be stakeholders in a program - participants, other researchers, program staff, other community members, and so on.
Then we put all data in single framework & apply various statistical tools to find out the dynamic on the market.
During the analysis stage, feedback from the stakeholder groups would be compared to determine areas of agreement as well as areas of divergence