

Key Insights
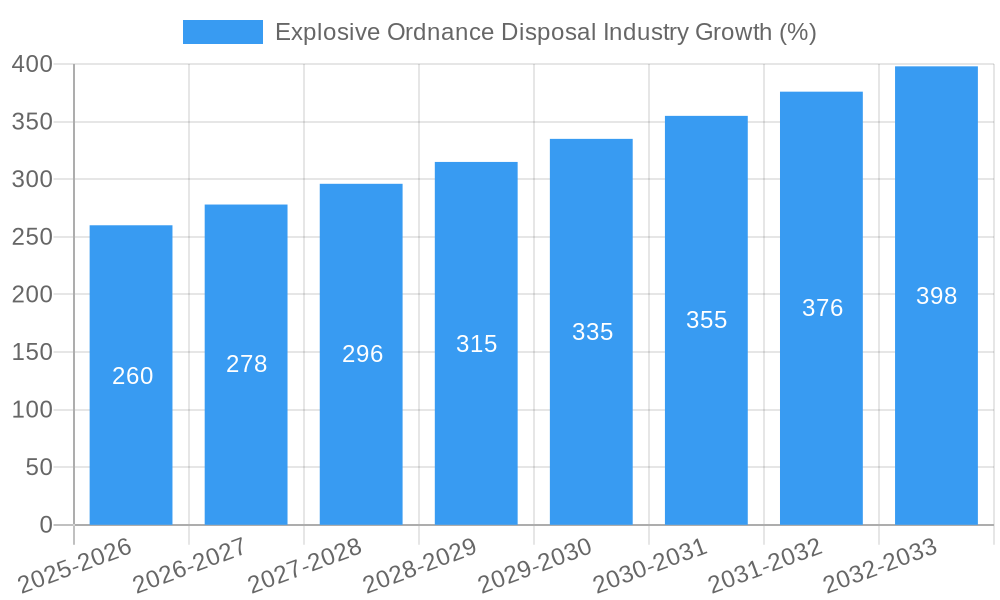
The Explosive Ordnance Disposal (EOD) industry, valued at $5.43 billion in 2025, is projected to experience robust growth, driven by escalating global geopolitical instability, rising terrorist activities, and the increasing need for effective mine clearance operations. A Compound Annual Growth Rate (CAGR) of 4.71% is anticipated from 2025 to 2033, indicating a significant expansion of the market. Key growth drivers include advancements in robotics and sensor technology, leading to the development of more sophisticated and efficient EOD equipment. The demand for advanced explosive detectors, EOD robots, and protective suits is particularly strong, fueled by the need for enhanced safety and effectiveness in hazardous environments. Government initiatives focusing on national security and infrastructure protection, coupled with increasing investments in military and law enforcement modernization programs, further contribute to market expansion. While regulatory hurdles and the high cost of advanced EOD technologies can pose challenges, the overall market outlook remains positive due to the critical nature of EOD operations and continuous innovation within the sector.
The market segmentation reveals significant opportunities across various end-users. The military sector remains a dominant force, accounting for a substantial portion of the market share due to its extensive use of EOD equipment in conflict zones and peacekeeping operations. However, the law enforcement sector is also demonstrating strong growth, driven by increasing domestic threats and the need for enhanced security capabilities in urban areas. Within the product type segment, EOD robots are expected to witness the highest growth rate due to their ability to neutralize explosive devices remotely, minimizing risk to human personnel. Geographically, North America and Europe currently hold the largest market shares, but the Asia-Pacific region is poised for significant expansion, driven by rising defense budgets and escalating internal security concerns in several key countries. Companies like L3Harris Technologies, Northrop Grumman, and Cobham are key players, constantly innovating and competing for market share through technological advancements and strategic partnerships. The continued focus on technological improvements, coupled with rising global security concerns, is expected to propel the EOD industry to even greater heights in the coming years.

Explosive Ordnance Disposal (EOD) Industry Market Report: 2019-2033
This comprehensive report provides a detailed analysis of the Explosive Ordnance Disposal (EOD) industry, projecting a market value of $XX Million by 2033. The study covers the period 2019-2033, with 2025 serving as the base and estimated year. This in-depth analysis will equip stakeholders with actionable insights into market dynamics, technological advancements, and emerging opportunities within this critical sector.
Explosive Ordnance Disposal Industry Market Concentration & Dynamics
The global Explosive Ordnance Disposal (EOD) market exhibits a moderately concentrated landscape, with key players like L3Harris Technologies Inc, Northrop Grumman Corporation, and Teledyne FLIR LLC holding significant market share. The market's dynamics are shaped by several factors:
- Innovation Ecosystems: Continuous R&D efforts drive innovation in EOD technologies, particularly in robotics, detection systems, and protective gear. This leads to a competitive landscape focused on technological differentiation.
- Regulatory Frameworks: Stringent safety regulations and export controls influence market access and product development. Compliance requirements vary across regions, impacting market penetration strategies.
- Substitute Products: Limited effective substitutes exist for specialized EOD equipment, though advancements in AI and autonomous systems might introduce new competitive solutions in the long term.
- End-User Trends: Growing demand from military forces globally, particularly in conflict zones and peacekeeping operations, is a major growth driver. Law enforcement agencies also represent a significant, albeit smaller, segment.
- M&A Activities: The industry has witnessed a moderate level of mergers and acquisitions (M&A) activity in recent years, with approximately xx M&A deals recorded between 2019 and 2024. These activities consolidate market share and accelerate technological integration. Market share analysis reveals that the top 5 players account for approximately xx% of the global market.
Explosive Ordnance Disposal Industry Industry Insights & Trends
The global EOD market experienced significant growth during the historical period (2019-2024), achieving a Compound Annual Growth Rate (CAGR) of xx%. This growth is projected to continue during the forecast period (2025-2033), with an estimated CAGR of xx%, driven by several key factors:
The escalating demand for advanced EOD solutions from military and law enforcement agencies globally is a primary driver. Increased global instability and terrorist activities fuel this demand, prompting significant investments in sophisticated EOD equipment and training. Technological advancements, such as the development of more effective and portable explosive detectors, autonomous EOD robots, and improved personal protective equipment, are enhancing operational effectiveness and reducing risks to personnel. The market is also witnessing a shift toward the adoption of unmanned systems, driving innovation and demand. Furthermore, government initiatives and funding programs dedicated to counter-terrorism and homeland security are bolstering market growth. The increasing awareness of improvised explosive devices (IEDs) and their devastating impact also fuels the demand for robust EOD solutions.
Key Markets & Segments Leading Explosive Ordnance Disposal Industry
The Military segment dominates the EOD market, accounting for approximately xx% of the global revenue in 2025. This is primarily due to the extensive use of EOD equipment in military operations worldwide. The North American region is the leading market due to substantial military spending and technological advancements.
Key Drivers:
- Military: High defense budgets, ongoing conflicts, and the threat of terrorism.
- Law Enforcement: Increased instances of bomb threats and IED attacks.
- North America: High defense expenditure, technological leadership, and a robust security infrastructure.
Dominance Analysis: The significant investments made by North American governments and the presence of major EOD technology manufacturers in the region solidify its leading position. The military segment's dominance reflects the crucial role EOD plays in safeguarding military personnel and assets.
Segment Breakdown (2025 Estimated Values in Millions):
- EOD Suits and Blankets: $xx Million
- EOD Robots: $xx Million
- Explosive Detectors: $xx Million
- Other Types: $xx Million
Explosive Ordnance Disposal Industry Product Developments
Recent product innovations focus on enhancing the effectiveness and safety of EOD operations. Miniaturization of explosive detectors, advancements in robotic dexterity and autonomy, and the development of lighter, more durable EOD suits are key advancements. These innovations provide enhanced capabilities, improved operator safety, and reduced operational costs, giving companies a competitive edge in the market.
Challenges in the Explosive Ordnance Disposal Industry Market
The EOD market faces challenges including stringent regulatory approvals, supply chain disruptions impacting the availability of critical components, and intense competition from established and emerging players. These factors can result in increased production costs and delays in product delivery, impacting overall market growth by an estimated xx% annually.
Forces Driving Explosive Ordnance Disposal Industry Growth
Technological advancements, increased defense spending, and rising awareness of IED threats are key growth drivers. Government initiatives promoting homeland security and counter-terrorism efforts also contribute significantly. Furthermore, the growing adoption of advanced technologies such as AI and autonomous systems fuels market expansion.
Long-Term Growth Catalysts in the Explosive Ordnance Disposal Industry
Long-term growth will be driven by continuous technological innovation, strategic partnerships between technology developers and end-users, and market expansion into developing regions with increasing security concerns. This includes the development of AI-powered detection systems and autonomous robots for enhanced operational efficiency.
Emerging Opportunities in Explosive Ordnance Disposal Industry
Emerging opportunities lie in the development of advanced robotic systems with enhanced dexterity and AI capabilities, the integration of advanced sensing technologies into EOD equipment, and expansion into new markets with growing security concerns. Furthermore, the development of lightweight and comfortable EOD suits represents a significant opportunity for market growth.
Leading Players in the Explosive Ordnance Disposal Industry Sector
- L3Harris Technologies Inc
- Westminster International Ltd
- Cobham Limited
- United Shield International Ltd
- NABCO Systems LLC
- Garrett Metal Detectors
- Reamda Ltd
- ABP
- Med-Eng Holdings ULC (Cadre Holdings Inc )
- Northrop Grumman Corporation
- Scanna MSC
- Teledyne FLIR LLC
Key Milestones in Explosive Ordnance Disposal Industry Industry
- 2020: Launch of a new generation of autonomous EOD robots by Northrop Grumman.
- 2021: Acquisition of a smaller EOD technology company by L3Harris Technologies.
- 2022: Introduction of a new lightweight EOD suit by Westminster International.
- 2023: Significant investment in R&D for AI-powered explosive detection by Teledyne FLIR.
- 2024: Several successful deployments of advanced EOD robots in various conflict zones.
Strategic Outlook for Explosive Ordnance Disposal Industry Market
The EOD market presents substantial growth potential driven by ongoing geopolitical instability, technological advancements, and increased government investments in security. Strategic opportunities include focusing on innovative product development, strengthening supply chains, and expanding into emerging markets to capitalize on the industry's long-term growth trajectory.
Explosive Ordnance Disposal Industry Segmentation
-
1. Type
- 1.1. EOD Suits and Blankets
- 1.2. EOD Robots
- 1.3. Explosive Detectors
- 1.4. Other Types
-
2. End User
- 2.1. Military
- 2.2. Law Enforcement
Explosive Ordnance Disposal Industry Segmentation By Geography
-
1. North America
- 1.1. United States
- 1.2. Canada
-
2. Europe
- 2.1. Germany
- 2.2. United Kingdom
- 2.3. France
- 2.4. Russia
- 2.5. Rest of Europe
-
3. Asia Pacific
- 3.1. India
- 3.2. China
- 3.3. Japan
- 3.4. South Korea
- 3.5. Rest of Asia Pacific
- 4. Rest of the World

Explosive Ordnance Disposal Industry REPORT HIGHLIGHTS
| Aspects | Details |
|---|---|
| Study Period | 2019-2033 |
| Base Year | 2024 |
| Estimated Year | 2025 |
| Forecast Period | 2025-2033 |
| Historical Period | 2019-2024 |
| Growth Rate | CAGR of 4.71% from 2019-2033 |
| Segmentation |
|
Table of Contents
- 1. Introduction
- 1.1. Research Scope
- 1.2. Market Segmentation
- 1.3. Research Methodology
- 1.4. Definitions and Assumptions
- 2. Executive Summary
- 2.1. Introduction
- 3. Market Dynamics
- 3.1. Introduction
- 3.2. Market Drivers
- 3.2.1. Increase in Internet of Things (IoT) and Autonomous Systems; Rise in Demand for Military and Defense Satellite Communication Solutions
- 3.3. Market Restrains
- 3.3.1. Cybersecurity Threats to Satellite Communication; Interference in Transmission of Data
- 3.4. Market Trends
- 3.4.1. Military Segment will Showcase Significant Growth Due to Adoption of Unmanned Systems for EOD Operations
- 4. Market Factor Analysis
- 4.1. Porters Five Forces
- 4.2. Supply/Value Chain
- 4.3. PESTEL analysis
- 4.4. Market Entropy
- 4.5. Patent/Trademark Analysis
- 5. Global Explosive Ordnance Disposal Industry Analysis, Insights and Forecast, 2019-2031
- 5.1. Market Analysis, Insights and Forecast - by Type
- 5.1.1. EOD Suits and Blankets
- 5.1.2. EOD Robots
- 5.1.3. Explosive Detectors
- 5.1.4. Other Types
- 5.2. Market Analysis, Insights and Forecast - by End User
- 5.2.1. Military
- 5.2.2. Law Enforcement
- 5.3. Market Analysis, Insights and Forecast - by Region
- 5.3.1. North America
- 5.3.2. Europe
- 5.3.3. Asia Pacific
- 5.3.4. Rest of the World
- 5.1. Market Analysis, Insights and Forecast - by Type
- 6. North America Explosive Ordnance Disposal Industry Analysis, Insights and Forecast, 2019-2031
- 6.1. Market Analysis, Insights and Forecast - by Type
- 6.1.1. EOD Suits and Blankets
- 6.1.2. EOD Robots
- 6.1.3. Explosive Detectors
- 6.1.4. Other Types
- 6.2. Market Analysis, Insights and Forecast - by End User
- 6.2.1. Military
- 6.2.2. Law Enforcement
- 6.1. Market Analysis, Insights and Forecast - by Type
- 7. Europe Explosive Ordnance Disposal Industry Analysis, Insights and Forecast, 2019-2031
- 7.1. Market Analysis, Insights and Forecast - by Type
- 7.1.1. EOD Suits and Blankets
- 7.1.2. EOD Robots
- 7.1.3. Explosive Detectors
- 7.1.4. Other Types
- 7.2. Market Analysis, Insights and Forecast - by End User
- 7.2.1. Military
- 7.2.2. Law Enforcement
- 7.1. Market Analysis, Insights and Forecast - by Type
- 8. Asia Pacific Explosive Ordnance Disposal Industry Analysis, Insights and Forecast, 2019-2031
- 8.1. Market Analysis, Insights and Forecast - by Type
- 8.1.1. EOD Suits and Blankets
- 8.1.2. EOD Robots
- 8.1.3. Explosive Detectors
- 8.1.4. Other Types
- 8.2. Market Analysis, Insights and Forecast - by End User
- 8.2.1. Military
- 8.2.2. Law Enforcement
- 8.1. Market Analysis, Insights and Forecast - by Type
- 9. Rest of the World Explosive Ordnance Disposal Industry Analysis, Insights and Forecast, 2019-2031
- 9.1. Market Analysis, Insights and Forecast - by Type
- 9.1.1. EOD Suits and Blankets
- 9.1.2. EOD Robots
- 9.1.3. Explosive Detectors
- 9.1.4. Other Types
- 9.2. Market Analysis, Insights and Forecast - by End User
- 9.2.1. Military
- 9.2.2. Law Enforcement
- 9.1. Market Analysis, Insights and Forecast - by Type
- 10. North America Explosive Ordnance Disposal Industry Analysis, Insights and Forecast, 2019-2031
- 10.1. Market Analysis, Insights and Forecast - By Country/Sub-region
- 10.1.1 United States
- 10.1.2 Canada
- 11. Europe Explosive Ordnance Disposal Industry Analysis, Insights and Forecast, 2019-2031
- 11.1. Market Analysis, Insights and Forecast - By Country/Sub-region
- 11.1.1 Germany
- 11.1.2 United Kingdom
- 11.1.3 France
- 11.1.4 Russia
- 11.1.5 Rest of Europe
- 12. Asia Pacific Explosive Ordnance Disposal Industry Analysis, Insights and Forecast, 2019-2031
- 12.1. Market Analysis, Insights and Forecast - By Country/Sub-region
- 12.1.1 India
- 12.1.2 China
- 12.1.3 Japan
- 12.1.4 South Korea
- 12.1.5 Rest of Asia Pacific
- 13. Rest of the World Explosive Ordnance Disposal Industry Analysis, Insights and Forecast, 2019-2031
- 13.1. Market Analysis, Insights and Forecast - By Country/Sub-region
- 13.1.1.
- 14. Competitive Analysis
- 14.1. Global Market Share Analysis 2024
- 14.2. Company Profiles
- 14.2.1 L3Harris Technologies Inc
- 14.2.1.1. Overview
- 14.2.1.2. Products
- 14.2.1.3. SWOT Analysis
- 14.2.1.4. Recent Developments
- 14.2.1.5. Financials (Based on Availability)
- 14.2.2 Westminster International Ltd
- 14.2.2.1. Overview
- 14.2.2.2. Products
- 14.2.2.3. SWOT Analysis
- 14.2.2.4. Recent Developments
- 14.2.2.5. Financials (Based on Availability)
- 14.2.3 Cobham Limited
- 14.2.3.1. Overview
- 14.2.3.2. Products
- 14.2.3.3. SWOT Analysis
- 14.2.3.4. Recent Developments
- 14.2.3.5. Financials (Based on Availability)
- 14.2.4 United Shield International Ltd
- 14.2.4.1. Overview
- 14.2.4.2. Products
- 14.2.4.3. SWOT Analysis
- 14.2.4.4. Recent Developments
- 14.2.4.5. Financials (Based on Availability)
- 14.2.5 NABCO Systems LLC
- 14.2.5.1. Overview
- 14.2.5.2. Products
- 14.2.5.3. SWOT Analysis
- 14.2.5.4. Recent Developments
- 14.2.5.5. Financials (Based on Availability)
- 14.2.6 Garrett Metal Detectors
- 14.2.6.1. Overview
- 14.2.6.2. Products
- 14.2.6.3. SWOT Analysis
- 14.2.6.4. Recent Developments
- 14.2.6.5. Financials (Based on Availability)
- 14.2.7 Reamda Ltd
- 14.2.7.1. Overview
- 14.2.7.2. Products
- 14.2.7.3. SWOT Analysis
- 14.2.7.4. Recent Developments
- 14.2.7.5. Financials (Based on Availability)
- 14.2.8 ABP
- 14.2.8.1. Overview
- 14.2.8.2. Products
- 14.2.8.3. SWOT Analysis
- 14.2.8.4. Recent Developments
- 14.2.8.5. Financials (Based on Availability)
- 14.2.9 Med-Eng Holdings ULC (Cadre Holdings Inc )
- 14.2.9.1. Overview
- 14.2.9.2. Products
- 14.2.9.3. SWOT Analysis
- 14.2.9.4. Recent Developments
- 14.2.9.5. Financials (Based on Availability)
- 14.2.10 Northrop Grumman Corporation
- 14.2.10.1. Overview
- 14.2.10.2. Products
- 14.2.10.3. SWOT Analysis
- 14.2.10.4. Recent Developments
- 14.2.10.5. Financials (Based on Availability)
- 14.2.11 Scanna MSC
- 14.2.11.1. Overview
- 14.2.11.2. Products
- 14.2.11.3. SWOT Analysis
- 14.2.11.4. Recent Developments
- 14.2.11.5. Financials (Based on Availability)
- 14.2.12 Teledyne FLIR LLC
- 14.2.12.1. Overview
- 14.2.12.2. Products
- 14.2.12.3. SWOT Analysis
- 14.2.12.4. Recent Developments
- 14.2.12.5. Financials (Based on Availability)
- 14.2.1 L3Harris Technologies Inc
List of Figures
- Figure 1: Global Explosive Ordnance Disposal Industry Revenue Breakdown (Million, %) by Region 2024 & 2032
- Figure 2: North America Explosive Ordnance Disposal Industry Revenue (Million), by Country 2024 & 2032
- Figure 3: North America Explosive Ordnance Disposal Industry Revenue Share (%), by Country 2024 & 2032
- Figure 4: Europe Explosive Ordnance Disposal Industry Revenue (Million), by Country 2024 & 2032
- Figure 5: Europe Explosive Ordnance Disposal Industry Revenue Share (%), by Country 2024 & 2032
- Figure 6: Asia Pacific Explosive Ordnance Disposal Industry Revenue (Million), by Country 2024 & 2032
- Figure 7: Asia Pacific Explosive Ordnance Disposal Industry Revenue Share (%), by Country 2024 & 2032
- Figure 8: Rest of the World Explosive Ordnance Disposal Industry Revenue (Million), by Country 2024 & 2032
- Figure 9: Rest of the World Explosive Ordnance Disposal Industry Revenue Share (%), by Country 2024 & 2032
- Figure 10: North America Explosive Ordnance Disposal Industry Revenue (Million), by Type 2024 & 2032
- Figure 11: North America Explosive Ordnance Disposal Industry Revenue Share (%), by Type 2024 & 2032
- Figure 12: North America Explosive Ordnance Disposal Industry Revenue (Million), by End User 2024 & 2032
- Figure 13: North America Explosive Ordnance Disposal Industry Revenue Share (%), by End User 2024 & 2032
- Figure 14: North America Explosive Ordnance Disposal Industry Revenue (Million), by Country 2024 & 2032
- Figure 15: North America Explosive Ordnance Disposal Industry Revenue Share (%), by Country 2024 & 2032
- Figure 16: Europe Explosive Ordnance Disposal Industry Revenue (Million), by Type 2024 & 2032
- Figure 17: Europe Explosive Ordnance Disposal Industry Revenue Share (%), by Type 2024 & 2032
- Figure 18: Europe Explosive Ordnance Disposal Industry Revenue (Million), by End User 2024 & 2032
- Figure 19: Europe Explosive Ordnance Disposal Industry Revenue Share (%), by End User 2024 & 2032
- Figure 20: Europe Explosive Ordnance Disposal Industry Revenue (Million), by Country 2024 & 2032
- Figure 21: Europe Explosive Ordnance Disposal Industry Revenue Share (%), by Country 2024 & 2032
- Figure 22: Asia Pacific Explosive Ordnance Disposal Industry Revenue (Million), by Type 2024 & 2032
- Figure 23: Asia Pacific Explosive Ordnance Disposal Industry Revenue Share (%), by Type 2024 & 2032
- Figure 24: Asia Pacific Explosive Ordnance Disposal Industry Revenue (Million), by End User 2024 & 2032
- Figure 25: Asia Pacific Explosive Ordnance Disposal Industry Revenue Share (%), by End User 2024 & 2032
- Figure 26: Asia Pacific Explosive Ordnance Disposal Industry Revenue (Million), by Country 2024 & 2032
- Figure 27: Asia Pacific Explosive Ordnance Disposal Industry Revenue Share (%), by Country 2024 & 2032
- Figure 28: Rest of the World Explosive Ordnance Disposal Industry Revenue (Million), by Type 2024 & 2032
- Figure 29: Rest of the World Explosive Ordnance Disposal Industry Revenue Share (%), by Type 2024 & 2032
- Figure 30: Rest of the World Explosive Ordnance Disposal Industry Revenue (Million), by End User 2024 & 2032
- Figure 31: Rest of the World Explosive Ordnance Disposal Industry Revenue Share (%), by End User 2024 & 2032
- Figure 32: Rest of the World Explosive Ordnance Disposal Industry Revenue (Million), by Country 2024 & 2032
- Figure 33: Rest of the World Explosive Ordnance Disposal Industry Revenue Share (%), by Country 2024 & 2032
List of Tables
- Table 1: Global Explosive Ordnance Disposal Industry Revenue Million Forecast, by Region 2019 & 2032
- Table 2: Global Explosive Ordnance Disposal Industry Revenue Million Forecast, by Type 2019 & 2032
- Table 3: Global Explosive Ordnance Disposal Industry Revenue Million Forecast, by End User 2019 & 2032
- Table 4: Global Explosive Ordnance Disposal Industry Revenue Million Forecast, by Region 2019 & 2032
- Table 5: Global Explosive Ordnance Disposal Industry Revenue Million Forecast, by Country 2019 & 2032
- Table 6: United States Explosive Ordnance Disposal Industry Revenue (Million) Forecast, by Application 2019 & 2032
- Table 7: Canada Explosive Ordnance Disposal Industry Revenue (Million) Forecast, by Application 2019 & 2032
- Table 8: Global Explosive Ordnance Disposal Industry Revenue Million Forecast, by Country 2019 & 2032
- Table 9: Germany Explosive Ordnance Disposal Industry Revenue (Million) Forecast, by Application 2019 & 2032
- Table 10: United Kingdom Explosive Ordnance Disposal Industry Revenue (Million) Forecast, by Application 2019 & 2032
- Table 11: France Explosive Ordnance Disposal Industry Revenue (Million) Forecast, by Application 2019 & 2032
- Table 12: Russia Explosive Ordnance Disposal Industry Revenue (Million) Forecast, by Application 2019 & 2032
- Table 13: Rest of Europe Explosive Ordnance Disposal Industry Revenue (Million) Forecast, by Application 2019 & 2032
- Table 14: Global Explosive Ordnance Disposal Industry Revenue Million Forecast, by Country 2019 & 2032
- Table 15: India Explosive Ordnance Disposal Industry Revenue (Million) Forecast, by Application 2019 & 2032
- Table 16: China Explosive Ordnance Disposal Industry Revenue (Million) Forecast, by Application 2019 & 2032
- Table 17: Japan Explosive Ordnance Disposal Industry Revenue (Million) Forecast, by Application 2019 & 2032
- Table 18: South Korea Explosive Ordnance Disposal Industry Revenue (Million) Forecast, by Application 2019 & 2032
- Table 19: Rest of Asia Pacific Explosive Ordnance Disposal Industry Revenue (Million) Forecast, by Application 2019 & 2032
- Table 20: Global Explosive Ordnance Disposal Industry Revenue Million Forecast, by Country 2019 & 2032
- Table 21: Explosive Ordnance Disposal Industry Revenue (Million) Forecast, by Application 2019 & 2032
- Table 22: Global Explosive Ordnance Disposal Industry Revenue Million Forecast, by Type 2019 & 2032
- Table 23: Global Explosive Ordnance Disposal Industry Revenue Million Forecast, by End User 2019 & 2032
- Table 24: Global Explosive Ordnance Disposal Industry Revenue Million Forecast, by Country 2019 & 2032
- Table 25: United States Explosive Ordnance Disposal Industry Revenue (Million) Forecast, by Application 2019 & 2032
- Table 26: Canada Explosive Ordnance Disposal Industry Revenue (Million) Forecast, by Application 2019 & 2032
- Table 27: Global Explosive Ordnance Disposal Industry Revenue Million Forecast, by Type 2019 & 2032
- Table 28: Global Explosive Ordnance Disposal Industry Revenue Million Forecast, by End User 2019 & 2032
- Table 29: Global Explosive Ordnance Disposal Industry Revenue Million Forecast, by Country 2019 & 2032
- Table 30: Germany Explosive Ordnance Disposal Industry Revenue (Million) Forecast, by Application 2019 & 2032
- Table 31: United Kingdom Explosive Ordnance Disposal Industry Revenue (Million) Forecast, by Application 2019 & 2032
- Table 32: France Explosive Ordnance Disposal Industry Revenue (Million) Forecast, by Application 2019 & 2032
- Table 33: Russia Explosive Ordnance Disposal Industry Revenue (Million) Forecast, by Application 2019 & 2032
- Table 34: Rest of Europe Explosive Ordnance Disposal Industry Revenue (Million) Forecast, by Application 2019 & 2032
- Table 35: Global Explosive Ordnance Disposal Industry Revenue Million Forecast, by Type 2019 & 2032
- Table 36: Global Explosive Ordnance Disposal Industry Revenue Million Forecast, by End User 2019 & 2032
- Table 37: Global Explosive Ordnance Disposal Industry Revenue Million Forecast, by Country 2019 & 2032
- Table 38: India Explosive Ordnance Disposal Industry Revenue (Million) Forecast, by Application 2019 & 2032
- Table 39: China Explosive Ordnance Disposal Industry Revenue (Million) Forecast, by Application 2019 & 2032
- Table 40: Japan Explosive Ordnance Disposal Industry Revenue (Million) Forecast, by Application 2019 & 2032
- Table 41: South Korea Explosive Ordnance Disposal Industry Revenue (Million) Forecast, by Application 2019 & 2032
- Table 42: Rest of Asia Pacific Explosive Ordnance Disposal Industry Revenue (Million) Forecast, by Application 2019 & 2032
- Table 43: Global Explosive Ordnance Disposal Industry Revenue Million Forecast, by Type 2019 & 2032
- Table 44: Global Explosive Ordnance Disposal Industry Revenue Million Forecast, by End User 2019 & 2032
- Table 45: Global Explosive Ordnance Disposal Industry Revenue Million Forecast, by Country 2019 & 2032
Frequently Asked Questions
1. What is the projected Compound Annual Growth Rate (CAGR) of the Explosive Ordnance Disposal Industry?
The projected CAGR is approximately 4.71%.
2. Which companies are prominent players in the Explosive Ordnance Disposal Industry?
Key companies in the market include L3Harris Technologies Inc, Westminster International Ltd, Cobham Limited, United Shield International Ltd, NABCO Systems LLC, Garrett Metal Detectors, Reamda Ltd, ABP, Med-Eng Holdings ULC (Cadre Holdings Inc ), Northrop Grumman Corporation, Scanna MSC, Teledyne FLIR LLC.
3. What are the main segments of the Explosive Ordnance Disposal Industry?
The market segments include Type, End User.
4. Can you provide details about the market size?
The market size is estimated to be USD 5.43 Million as of 2022.
5. What are some drivers contributing to market growth?
Increase in Internet of Things (IoT) and Autonomous Systems; Rise in Demand for Military and Defense Satellite Communication Solutions.
6. What are the notable trends driving market growth?
Military Segment will Showcase Significant Growth Due to Adoption of Unmanned Systems for EOD Operations.
7. Are there any restraints impacting market growth?
Cybersecurity Threats to Satellite Communication; Interference in Transmission of Data.
8. Can you provide examples of recent developments in the market?
N/A
9. What pricing options are available for accessing the report?
Pricing options include single-user, multi-user, and enterprise licenses priced at USD 4750, USD 5250, and USD 8750 respectively.
10. Is the market size provided in terms of value or volume?
The market size is provided in terms of value, measured in Million.
11. Are there any specific market keywords associated with the report?
Yes, the market keyword associated with the report is "Explosive Ordnance Disposal Industry," which aids in identifying and referencing the specific market segment covered.
12. How do I determine which pricing option suits my needs best?
The pricing options vary based on user requirements and access needs. Individual users may opt for single-user licenses, while businesses requiring broader access may choose multi-user or enterprise licenses for cost-effective access to the report.
13. Are there any additional resources or data provided in the Explosive Ordnance Disposal Industry report?
While the report offers comprehensive insights, it's advisable to review the specific contents or supplementary materials provided to ascertain if additional resources or data are available.
14. How can I stay updated on further developments or reports in the Explosive Ordnance Disposal Industry?
To stay informed about further developments, trends, and reports in the Explosive Ordnance Disposal Industry, consider subscribing to industry newsletters, following relevant companies and organizations, or regularly checking reputable industry news sources and publications.
Methodology
Step 1 - Identification of Relevant Samples Size from Population Database


Step 2 - Approaches for Defining Global Market Size (Value, Volume* & Price*)

Note*: In applicable scenarios
Step 3 - Data Sources
Primary Research
- Web Analytics
- Survey Reports
- Research Institute
- Latest Research Reports
- Opinion Leaders
Secondary Research
- Annual Reports
- White Paper
- Latest Press Release
- Industry Association
- Paid Database
- Investor Presentations

Step 4 - Data Triangulation
Involves using different sources of information in order to increase the validity of a study
These sources are likely to be stakeholders in a program - participants, other researchers, program staff, other community members, and so on.
Then we put all data in single framework & apply various statistical tools to find out the dynamic on the market.
During the analysis stage, feedback from the stakeholder groups would be compared to determine areas of agreement as well as areas of divergence
