

Key Insights
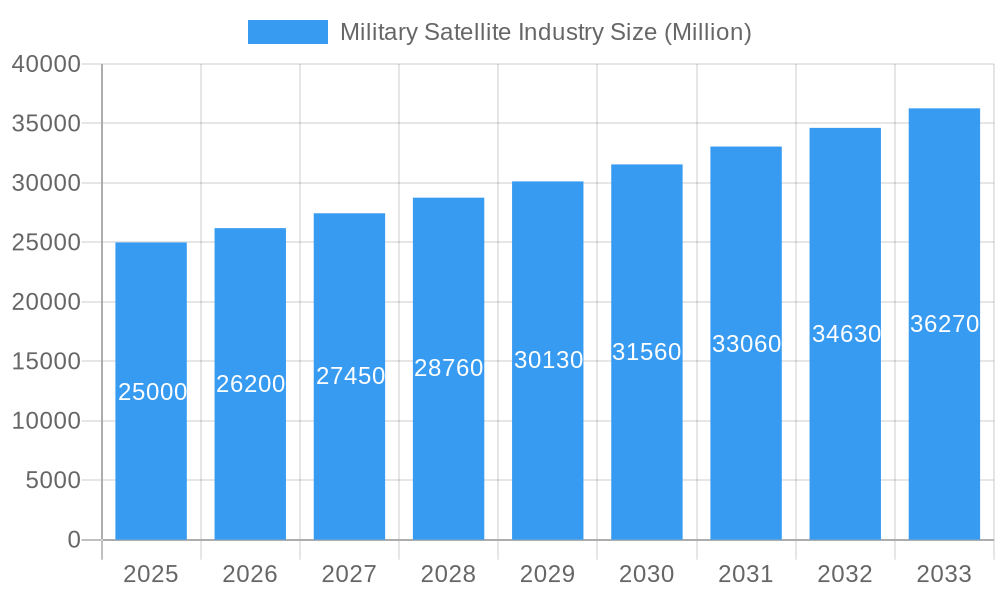
The global military satellite market is poised for significant expansion, driven by escalating geopolitical complexities, defense capability modernization initiatives, and the escalating demand for advanced surveillance and communication solutions. The market, projected to reach $36 billion by 2025, is anticipated to experience a Compound Annual Growth Rate (CAGR) of approximately 10% through 2033. This growth trajectory is underpinned by several critical factors. Nations are prioritizing investment in space-based assets to enhance situational awareness, intelligence gathering, and the deployment of precision-guided munitions. Concurrently, technological advancements in satellite design, including miniaturization, superior sensor technology, and augmented communication capabilities, are improving cost-effectiveness and operational versatility. The proliferation of new space technologies, such as satellite constellations, is reshaping the strategic landscape by offering increased resilience and expanded coverage. Furthermore, the integration of artificial intelligence and machine learning in satellite data analysis is accelerating decision-making processes, ensuring greater accuracy.
Military Satellite Industry Market Size (In Billion)
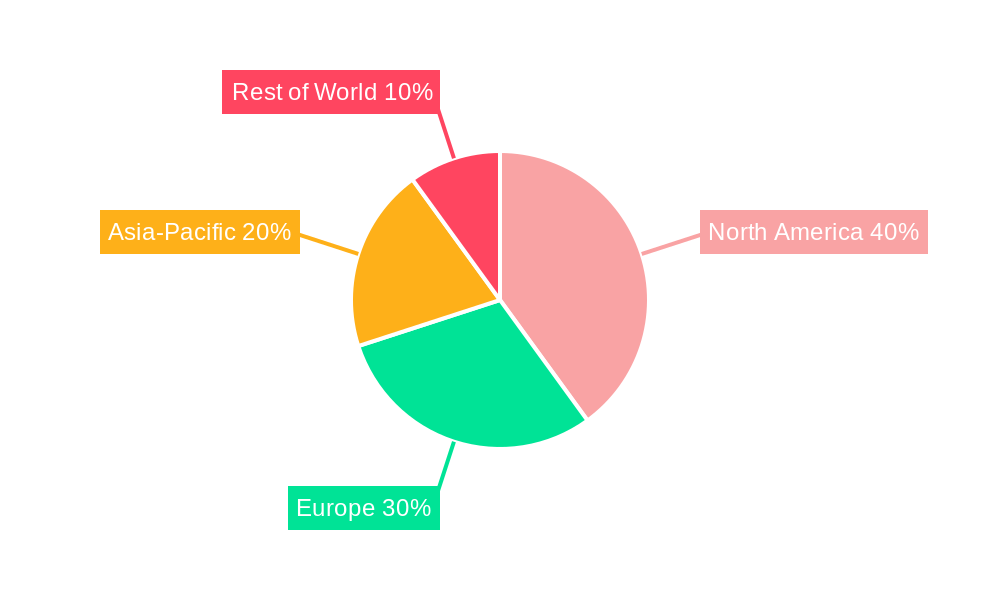
The military satellite market exhibits diverse segmentation, categorized by satellite mass (from under 10kg to over 1000kg), orbit class (GEO, LEO, MEO), and critical subsystems (including propulsion, bus, solar arrays, and structures). Application areas encompass communication, earth observation, navigation, and space situational awareness. Prominent market participants such as Raytheon, Lockheed Martin, and Airbus are consistently driving innovation to address the evolving requirements of military clients. Market concentration generally aligns with defense spending patterns, with North America and Europe currently dominating market share. However, the Asia-Pacific region is expected to witness substantial growth, attributed to increased investments in space technology by regional powers.
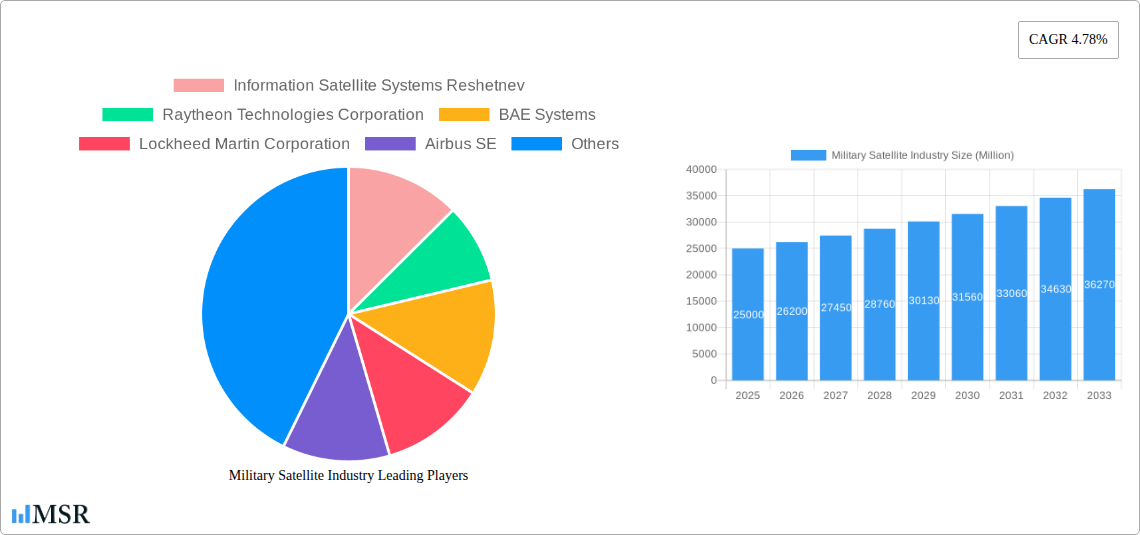
Military Satellite Industry Company Market Share
Military Satellite Industry: Comprehensive Market Analysis (2025-2033)
This in-depth report delivers a thorough analysis of the military satellite industry, providing critical insights for stakeholders across the entire value chain. Covering the forecast period from 2025 to 2033, with a base year of 2025, this report offers actionable intelligence on market dynamics, key segments, leading players, and emerging opportunities. It analyzes the market size, valued at $36 billion in 2025, projecting a CAGR of 10% during the forecast period. This report is an essential resource for businesses, investors, and government agencies seeking to navigate this rapidly evolving sector.
Military Satellite Industry Market Concentration & Dynamics
The Military Satellite Industry is characterized by a moderately concentrated market structure, with a handful of major players holding significant market share. The top five companies—Lockheed Martin Corporation, Raytheon Technologies Corporation, Boeing, Airbus SE, and Northrop Grumman—account for approximately xx% of the global market. However, the industry also features a number of smaller, specialized companies focused on niche segments like smallsat constellations and specific satellite subsystems. This dynamic landscape is further shaped by ongoing mergers and acquisitions (M&A) activity. The historical period (2019-2024) witnessed approximately xx M&A deals, indicating a high level of consolidation.
- Market Concentration: High, with top 5 players holding xx% market share.
- Innovation Ecosystems: Active, with significant R&D investments by major players and emerging startups.
- Regulatory Frameworks: Stringent, with national and international regulations governing satellite launches, operations, and data security.
- Substitute Products: Limited, although emerging technologies like high-altitude drones may offer some level of substitution.
- End-User Trends: Increasing demand for smaller, more agile satellites for diverse military applications.
- M&A Activity: High, driving consolidation and technological integration.
Military Satellite Industry Industry Insights & Trends
The Military Satellite Industry is experiencing robust growth driven by increasing defense budgets, geopolitical instability, and the growing demand for advanced military capabilities. The market size is projected to reach xx Million by 2033. Technological advancements, such as miniaturization, improved sensors, and AI-powered data analysis, are revolutionizing military satellite applications. Furthermore, the shift towards networked satellite constellations and the increasing adoption of commercial technologies are reshaping the industry landscape. The growing adoption of smallsats for tactical communication and surveillance is further contributing to market expansion, coupled with rising needs for improved situational awareness and intelligence gathering. This trend is influencing the market for smaller satellite mass segments (10-100kg and 100-500kg). The increasing reliance on space-based assets for navigation, communication, and intelligence gathering fuels robust growth. Challenges remain, such as the high cost of development and launch, vulnerability to space debris, and the potential for anti-satellite weapons.
Key Markets & Segments Leading Military Satellite Industry
The North American region holds a dominant position in the Military Satellite Industry, driven by substantial defense spending and advanced technological capabilities. However, significant growth is anticipated in the Asia-Pacific region due to increasing defense modernization programs in countries like China and India. Within the segment breakdown, the LEO (Low Earth Orbit) segment is experiencing particularly strong growth due to the increasing deployment of smallsat constellations. Similarly, the 10-100kg and 100-500kg satellite mass segments are rapidly expanding owing to their cost-effectiveness and adaptability for various military applications. The communication application segment maintains the largest share, with significant contributions from navigation and earth observation applications.
Market Drivers:
- Increased Defense Budgets
- Geopolitical Tensions
- Technological Advancements (Miniaturization, AI)
- Growing Demand for Situational Awareness
- Adoption of Small Satellites
Dominant Regions: North America, followed by Asia-Pacific.
Dominant Segments: LEO Orbit, Satellite Mass (10-100kg, 100-500kg), Communication Applications
Military Satellite Industry Product Developments
Recent advancements focus on miniaturized satellites, improved sensor technologies, and advanced data processing capabilities. These innovations enable enhanced situational awareness, improved communication networks, and more precise targeting capabilities. The development of anti-jamming and anti-spoofing technologies is crucial for maintaining communication reliability in contested environments. The integration of AI and machine learning is transforming data analysis and autonomous satellite operations, offering a significant competitive edge.
Challenges in the Military Satellite Industry Market
The Military Satellite Industry faces challenges including high development and launch costs, stringent regulatory hurdles, supply chain vulnerabilities, and intense competition. These factors can impact project timelines and budgets. The threat of anti-satellite weapons also poses a significant risk. Furthermore, ensuring secure and reliable communication networks in increasingly contested space environments remains a major concern.
Forces Driving Military Satellite Industry Growth
Technological advancements, increasing defense budgets, and the growing need for resilient and secure space-based capabilities drive industry growth. Government investments in space-related research and development stimulate innovation and market expansion. The development of reusable launch vehicles also contributes to cost reduction and increased accessibility to space.
Long-Term Growth Catalysts in Military Satellite Industry
Long-term growth is driven by the continued development of advanced technologies, strategic partnerships between commercial and military entities, and expansion into new markets. The emergence of new space-based services, such as space-based internet and improved navigation systems, offers significant potential.
Emerging Opportunities in Military Satellite Industry
Emerging opportunities include the development of resilient and secure satellite constellations, advanced sensor technologies for improved intelligence gathering, and the integration of AI and machine learning for enhanced autonomous operations. The development of hybrid satellite architectures combining traditional GEO with LEO and MEO constellations represents a significant opportunity.
Leading Players in the Military Satellite Industry Sector
Key Milestones in Military Satellite Industry Industry
- February 2023: Blue Canyon Technologies LLC (Raytheon Technologies subsidiary) provided hardware for multiple SmallSat missions on Transporter-6, launching 114 small payloads into polar orbit.
- February 2023: Blue Canyon Technologies LLC (Raytheon Technologies subsidiary) provided hardware for multiple smallsat missions on Transporter-6, launching 114 small payloads into polar orbit.
- January 2023: Raytheon Intelligence & Space awarded a contract to develop a prototype missile tracking system (MTC) for the US Space Force, focusing on medium Earth orbit.
Strategic Outlook for Military Satellite Industry Market
The Military Satellite Industry is poised for significant growth, driven by technological advancements, increasing defense budgets, and the growing importance of space-based assets for national security. Strategic partnerships, investment in R&D, and the development of innovative technologies will be crucial for companies seeking to capitalize on future market opportunities. The industry will continue to see a shift toward smaller, more agile satellites, constellations, and increased reliance on commercial technologies.
Military Satellite Industry Segmentation
-
1. Satellite Mass
- 1.1. 10-100kg
- 1.2. 100-500kg
- 1.3. 500-1000kg
- 1.4. Below 10 Kg
- 1.5. above 1000kg
-
2. Orbit Class
- 2.1. GEO
- 2.2. LEO
- 2.3. MEO
-
3. Satellite Subsystem
- 3.1. Propulsion Hardware and Propellant
- 3.2. Satellite Bus & Subsystems
- 3.3. Solar Array & Power Hardware
- 3.4. Structures, Harness & Mechanisms
-
4. Application
- 4.1. Communication
- 4.2. Earth Observation
- 4.3. Navigation
- 4.4. Space Observation
- 4.5. Others
Military Satellite Industry Segmentation By Geography
-
1. North America
- 1.1. United States
- 1.2. Canada
- 1.3. Mexico
-
2. South America
- 2.1. Brazil
- 2.2. Argentina
- 2.3. Rest of South America
-
3. Europe
- 3.1. United Kingdom
- 3.2. Germany
- 3.3. France
- 3.4. Italy
- 3.5. Spain
- 3.6. Russia
- 3.7. Benelux
- 3.8. Nordics
- 3.9. Rest of Europe
-
4. Middle East & Africa
- 4.1. Turkey
- 4.2. Israel
- 4.3. GCC
- 4.4. North Africa
- 4.5. South Africa
- 4.6. Rest of Middle East & Africa
-
5. Asia Pacific
- 5.1. China
- 5.2. India
- 5.3. Japan
- 5.4. South Korea
- 5.5. ASEAN
- 5.6. Oceania
- 5.7. Rest of Asia Pacific
Military Satellite Industry Regional Market Share
Geographic Coverage of Military Satellite Industry
Military Satellite Industry REPORT HIGHLIGHTS
| Aspects | Details |
|---|---|
| Study Period | 2020-2034 |
| Base Year | 2025 |
| Estimated Year | 2026 |
| Forecast Period | 2026-2034 |
| Historical Period | 2020-2025 |
| Growth Rate | CAGR of 10% from 2020-2034 |
| Segmentation |
|
Table of Contents
- 1. Introduction
- 1.1. Research Scope
- 1.2. Market Segmentation
- 1.3. Research Objective
- 1.4. Definitions and Assumptions
- 2. Executive Summary
- 2.1. Market Snapshot
- 3. Market Dynamics
- 3.1. Market Drivers
- 3.2. Market Restrains
- 3.3. Market Trends
- 3.4. Market Opportunities
- 4. Market Factor Analysis
- 4.1. Porters Five Forces
- 4.1.1. Bargaining Power of Suppliers
- 4.1.2. Bargaining Power of Buyers
- 4.1.3. Threat of New Entrants
- 4.1.4. Threat of Substitutes
- 4.1.5. Competitive Rivalry
- 4.2. PESTEL analysis
- 4.3. BCG Analysis
- 4.3.1. Stars (High Growth, High Market Share)
- 4.3.2. Cash Cows (Low Growth, High Market Share)
- 4.3.3. Question Mark (High Growth, Low Market Share)
- 4.3.4. Dogs (Low Growth, Low Market Share)
- 4.4. Ansoff Matrix Analysis
- 4.5. Supply Chain Analysis
- 4.6. Regulatory Landscape
- 4.7. Current Market Potential and Opportunity Assessment (TAM–SAM–SOM Framework)
- 4.8. MSR Analyst Note
- 4.1. Porters Five Forces
- 5. Market Analysis, Insights and Forecast 2021-2033
- 5.1. Market Analysis, Insights and Forecast - by Satellite Mass
- 5.1.1. 10-100kg
- 5.1.2. 100-500kg
- 5.1.3. 500-1000kg
- 5.1.4. Below 10 Kg
- 5.1.5. above 1000kg
- 5.2. Market Analysis, Insights and Forecast - by Orbit Class
- 5.2.1. GEO
- 5.2.2. LEO
- 5.2.3. MEO
- 5.3. Market Analysis, Insights and Forecast - by Satellite Subsystem
- 5.3.1. Propulsion Hardware and Propellant
- 5.3.2. Satellite Bus & Subsystems
- 5.3.3. Solar Array & Power Hardware
- 5.3.4. Structures, Harness & Mechanisms
- 5.4. Market Analysis, Insights and Forecast - by Application
- 5.4.1. Communication
- 5.4.2. Earth Observation
- 5.4.3. Navigation
- 5.4.4. Space Observation
- 5.4.5. Others
- 5.5. Market Analysis, Insights and Forecast - by Region
- 5.5.1. North America
- 5.5.2. South America
- 5.5.3. Europe
- 5.5.4. Middle East & Africa
- 5.5.5. Asia Pacific
- 5.1. Market Analysis, Insights and Forecast - by Satellite Mass
- 6. Global Military Satellite Industry Analysis, Insights and Forecast, 2021-2033
- 6.1. Market Analysis, Insights and Forecast - by Satellite Mass
- 6.1.1. 10-100kg
- 6.1.2. 100-500kg
- 6.1.3. 500-1000kg
- 6.1.4. Below 10 Kg
- 6.1.5. above 1000kg
- 6.2. Market Analysis, Insights and Forecast - by Orbit Class
- 6.2.1. GEO
- 6.2.2. LEO
- 6.2.3. MEO
- 6.3. Market Analysis, Insights and Forecast - by Satellite Subsystem
- 6.3.1. Propulsion Hardware and Propellant
- 6.3.2. Satellite Bus & Subsystems
- 6.3.3. Solar Array & Power Hardware
- 6.3.4. Structures, Harness & Mechanisms
- 6.4. Market Analysis, Insights and Forecast - by Application
- 6.4.1. Communication
- 6.4.2. Earth Observation
- 6.4.3. Navigation
- 6.4.4. Space Observation
- 6.4.5. Others
- 6.1. Market Analysis, Insights and Forecast - by Satellite Mass
- 7. North America Military Satellite Industry Analysis, Insights and Forecast, 2020-2032
- 7.1. Market Analysis, Insights and Forecast - by Satellite Mass
- 7.1.1. 10-100kg
- 7.1.2. 100-500kg
- 7.1.3. 500-1000kg
- 7.1.4. Below 10 Kg
- 7.1.5. above 1000kg
- 7.2. Market Analysis, Insights and Forecast - by Orbit Class
- 7.2.1. GEO
- 7.2.2. LEO
- 7.2.3. MEO
- 7.3. Market Analysis, Insights and Forecast - by Satellite Subsystem
- 7.3.1. Propulsion Hardware and Propellant
- 7.3.2. Satellite Bus & Subsystems
- 7.3.3. Solar Array & Power Hardware
- 7.3.4. Structures, Harness & Mechanisms
- 7.4. Market Analysis, Insights and Forecast - by Application
- 7.4.1. Communication
- 7.4.2. Earth Observation
- 7.4.3. Navigation
- 7.4.4. Space Observation
- 7.4.5. Others
- 7.1. Market Analysis, Insights and Forecast - by Satellite Mass
- 8. South America Military Satellite Industry Analysis, Insights and Forecast, 2020-2032
- 8.1. Market Analysis, Insights and Forecast - by Satellite Mass
- 8.1.1. 10-100kg
- 8.1.2. 100-500kg
- 8.1.3. 500-1000kg
- 8.1.4. Below 10 Kg
- 8.1.5. above 1000kg
- 8.2. Market Analysis, Insights and Forecast - by Orbit Class
- 8.2.1. GEO
- 8.2.2. LEO
- 8.2.3. MEO
- 8.3. Market Analysis, Insights and Forecast - by Satellite Subsystem
- 8.3.1. Propulsion Hardware and Propellant
- 8.3.2. Satellite Bus & Subsystems
- 8.3.3. Solar Array & Power Hardware
- 8.3.4. Structures, Harness & Mechanisms
- 8.4. Market Analysis, Insights and Forecast - by Application
- 8.4.1. Communication
- 8.4.2. Earth Observation
- 8.4.3. Navigation
- 8.4.4. Space Observation
- 8.4.5. Others
- 8.1. Market Analysis, Insights and Forecast - by Satellite Mass
- 9. Europe Military Satellite Industry Analysis, Insights and Forecast, 2020-2032
- 9.1. Market Analysis, Insights and Forecast - by Satellite Mass
- 9.1.1. 10-100kg
- 9.1.2. 100-500kg
- 9.1.3. 500-1000kg
- 9.1.4. Below 10 Kg
- 9.1.5. above 1000kg
- 9.2. Market Analysis, Insights and Forecast - by Orbit Class
- 9.2.1. GEO
- 9.2.2. LEO
- 9.2.3. MEO
- 9.3. Market Analysis, Insights and Forecast - by Satellite Subsystem
- 9.3.1. Propulsion Hardware and Propellant
- 9.3.2. Satellite Bus & Subsystems
- 9.3.3. Solar Array & Power Hardware
- 9.3.4. Structures, Harness & Mechanisms
- 9.4. Market Analysis, Insights and Forecast - by Application
- 9.4.1. Communication
- 9.4.2. Earth Observation
- 9.4.3. Navigation
- 9.4.4. Space Observation
- 9.4.5. Others
- 9.1. Market Analysis, Insights and Forecast - by Satellite Mass
- 10. Middle East & Africa Military Satellite Industry Analysis, Insights and Forecast, 2020-2032
- 10.1. Market Analysis, Insights and Forecast - by Satellite Mass
- 10.1.1. 10-100kg
- 10.1.2. 100-500kg
- 10.1.3. 500-1000kg
- 10.1.4. Below 10 Kg
- 10.1.5. above 1000kg
- 10.2. Market Analysis, Insights and Forecast - by Orbit Class
- 10.2.1. GEO
- 10.2.2. LEO
- 10.2.3. MEO
- 10.3. Market Analysis, Insights and Forecast - by Satellite Subsystem
- 10.3.1. Propulsion Hardware and Propellant
- 10.3.2. Satellite Bus & Subsystems
- 10.3.3. Solar Array & Power Hardware
- 10.3.4. Structures, Harness & Mechanisms
- 10.4. Market Analysis, Insights and Forecast - by Application
- 10.4.1. Communication
- 10.4.2. Earth Observation
- 10.4.3. Navigation
- 10.4.4. Space Observation
- 10.4.5. Others
- 10.1. Market Analysis, Insights and Forecast - by Satellite Mass
- 11. Asia Pacific Military Satellite Industry Analysis, Insights and Forecast, 2020-2032
- 11.1. Market Analysis, Insights and Forecast - by Satellite Mass
- 11.1.1. 10-100kg
- 11.1.2. 100-500kg
- 11.1.3. 500-1000kg
- 11.1.4. Below 10 Kg
- 11.1.5. above 1000kg
- 11.2. Market Analysis, Insights and Forecast - by Orbit Class
- 11.2.1. GEO
- 11.2.2. LEO
- 11.2.3. MEO
- 11.3. Market Analysis, Insights and Forecast - by Satellite Subsystem
- 11.3.1. Propulsion Hardware and Propellant
- 11.3.2. Satellite Bus & Subsystems
- 11.3.3. Solar Array & Power Hardware
- 11.3.4. Structures, Harness & Mechanisms
- 11.4. Market Analysis, Insights and Forecast - by Application
- 11.4.1. Communication
- 11.4.2. Earth Observation
- 11.4.3. Navigation
- 11.4.4. Space Observation
- 11.4.5. Others
- 11.1. Market Analysis, Insights and Forecast - by Satellite Mass
- 12. Competitive Analysis
- 12.1. Company Profiles
- 12.1.1 Information Satellite Systems Reshetnev
- 12.1.1.1. Company Overview
- 12.1.1.2. Products
- 12.1.1.3. Company Financials
- 12.1.1.4. SWOT Analysis
- 12.1.2 Raytheon Technologies Corporation
- 12.1.2.1. Company Overview
- 12.1.2.2. Products
- 12.1.2.3. Company Financials
- 12.1.2.4. SWOT Analysis
- 12.1.3 BAE Systems
- 12.1.3.1. Company Overview
- 12.1.3.2. Products
- 12.1.3.3. Company Financials
- 12.1.3.4. SWOT Analysis
- 12.1.4 Lockheed Martin Corporation
- 12.1.4.1. Company Overview
- 12.1.4.2. Products
- 12.1.4.3. Company Financials
- 12.1.4.4. SWOT Analysis
- 12.1.5 Airbus SE
- 12.1.5.1. Company Overview
- 12.1.5.2. Products
- 12.1.5.3. Company Financials
- 12.1.5.4. SWOT Analysis
- 12.1.6 Viasat Inc
- 12.1.6.1. Company Overview
- 12.1.6.2. Products
- 12.1.6.3. Company Financials
- 12.1.6.4. SWOT Analysis
- 12.1.7 China Aerospace Science and Technology Corporation (CASC)
- 12.1.7.1. Company Overview
- 12.1.7.2. Products
- 12.1.7.3. Company Financials
- 12.1.7.4. SWOT Analysis
- 12.1.8 General Dynamics
- 12.1.8.1. Company Overview
- 12.1.8.2. Products
- 12.1.8.3. Company Financials
- 12.1.8.4. SWOT Analysis
- 12.1.9 Thales
- 12.1.9.1. Company Overview
- 12.1.9.2. Products
- 12.1.9.3. Company Financials
- 12.1.9.4. SWOT Analysis
- 12.1.10 Elbit Systems
- 12.1.10.1. Company Overview
- 12.1.10.2. Products
- 12.1.10.3. Company Financials
- 12.1.10.4. SWOT Analysis
- 12.1.11 ROSCOSMOS
- 12.1.11.1. Company Overview
- 12.1.11.2. Products
- 12.1.11.3. Company Financials
- 12.1.11.4. SWOT Analysis
- 12.1.12 Indian Space Research Organisation (ISRO)
- 12.1.12.1. Company Overview
- 12.1.12.2. Products
- 12.1.12.3. Company Financials
- 12.1.12.4. SWOT Analysis
- 12.1.1 Information Satellite Systems Reshetnev
- 12.2. Market Entropy
- 12.2.1 Company's Key Areas Served
- 12.2.2 Recent Developments
- 12.3. Company Market Share Analysis 2025
- 12.3.1 Top 5 Companies Market Share Analysis
- 12.3.2 Top 3 Companies Market Share Analysis
- 12.4. List of Potential Customers
- 13. Research Methodology
List of Figures
- Figure 1: Global Military Satellite Industry Revenue Breakdown (billion, %) by Region 2025 & 2033
- Figure 2: North America Military Satellite Industry Revenue (billion), by Satellite Mass 2025 & 2033
- Figure 3: North America Military Satellite Industry Revenue Share (%), by Satellite Mass 2025 & 2033
- Figure 4: North America Military Satellite Industry Revenue (billion), by Orbit Class 2025 & 2033
- Figure 5: North America Military Satellite Industry Revenue Share (%), by Orbit Class 2025 & 2033
- Figure 6: North America Military Satellite Industry Revenue (billion), by Satellite Subsystem 2025 & 2033
- Figure 7: North America Military Satellite Industry Revenue Share (%), by Satellite Subsystem 2025 & 2033
- Figure 8: North America Military Satellite Industry Revenue (billion), by Application 2025 & 2033
- Figure 9: North America Military Satellite Industry Revenue Share (%), by Application 2025 & 2033
- Figure 10: North America Military Satellite Industry Revenue (billion), by Country 2025 & 2033
- Figure 11: North America Military Satellite Industry Revenue Share (%), by Country 2025 & 2033
- Figure 12: South America Military Satellite Industry Revenue (billion), by Satellite Mass 2025 & 2033
- Figure 13: South America Military Satellite Industry Revenue Share (%), by Satellite Mass 2025 & 2033
- Figure 14: South America Military Satellite Industry Revenue (billion), by Orbit Class 2025 & 2033
- Figure 15: South America Military Satellite Industry Revenue Share (%), by Orbit Class 2025 & 2033
- Figure 16: South America Military Satellite Industry Revenue (billion), by Satellite Subsystem 2025 & 2033
- Figure 17: South America Military Satellite Industry Revenue Share (%), by Satellite Subsystem 2025 & 2033
- Figure 18: South America Military Satellite Industry Revenue (billion), by Application 2025 & 2033
- Figure 19: South America Military Satellite Industry Revenue Share (%), by Application 2025 & 2033
- Figure 20: South America Military Satellite Industry Revenue (billion), by Country 2025 & 2033
- Figure 21: South America Military Satellite Industry Revenue Share (%), by Country 2025 & 2033
- Figure 22: Europe Military Satellite Industry Revenue (billion), by Satellite Mass 2025 & 2033
- Figure 23: Europe Military Satellite Industry Revenue Share (%), by Satellite Mass 2025 & 2033
- Figure 24: Europe Military Satellite Industry Revenue (billion), by Orbit Class 2025 & 2033
- Figure 25: Europe Military Satellite Industry Revenue Share (%), by Orbit Class 2025 & 2033
- Figure 26: Europe Military Satellite Industry Revenue (billion), by Satellite Subsystem 2025 & 2033
- Figure 27: Europe Military Satellite Industry Revenue Share (%), by Satellite Subsystem 2025 & 2033
- Figure 28: Europe Military Satellite Industry Revenue (billion), by Application 2025 & 2033
- Figure 29: Europe Military Satellite Industry Revenue Share (%), by Application 2025 & 2033
- Figure 30: Europe Military Satellite Industry Revenue (billion), by Country 2025 & 2033
- Figure 31: Europe Military Satellite Industry Revenue Share (%), by Country 2025 & 2033
- Figure 32: Middle East & Africa Military Satellite Industry Revenue (billion), by Satellite Mass 2025 & 2033
- Figure 33: Middle East & Africa Military Satellite Industry Revenue Share (%), by Satellite Mass 2025 & 2033
- Figure 34: Middle East & Africa Military Satellite Industry Revenue (billion), by Orbit Class 2025 & 2033
- Figure 35: Middle East & Africa Military Satellite Industry Revenue Share (%), by Orbit Class 2025 & 2033
- Figure 36: Middle East & Africa Military Satellite Industry Revenue (billion), by Satellite Subsystem 2025 & 2033
- Figure 37: Middle East & Africa Military Satellite Industry Revenue Share (%), by Satellite Subsystem 2025 & 2033
- Figure 38: Middle East & Africa Military Satellite Industry Revenue (billion), by Application 2025 & 2033
- Figure 39: Middle East & Africa Military Satellite Industry Revenue Share (%), by Application 2025 & 2033
- Figure 40: Middle East & Africa Military Satellite Industry Revenue (billion), by Country 2025 & 2033
- Figure 41: Middle East & Africa Military Satellite Industry Revenue Share (%), by Country 2025 & 2033
- Figure 42: Asia Pacific Military Satellite Industry Revenue (billion), by Satellite Mass 2025 & 2033
- Figure 43: Asia Pacific Military Satellite Industry Revenue Share (%), by Satellite Mass 2025 & 2033
- Figure 44: Asia Pacific Military Satellite Industry Revenue (billion), by Orbit Class 2025 & 2033
- Figure 45: Asia Pacific Military Satellite Industry Revenue Share (%), by Orbit Class 2025 & 2033
- Figure 46: Asia Pacific Military Satellite Industry Revenue (billion), by Satellite Subsystem 2025 & 2033
- Figure 47: Asia Pacific Military Satellite Industry Revenue Share (%), by Satellite Subsystem 2025 & 2033
- Figure 48: Asia Pacific Military Satellite Industry Revenue (billion), by Application 2025 & 2033
- Figure 49: Asia Pacific Military Satellite Industry Revenue Share (%), by Application 2025 & 2033
- Figure 50: Asia Pacific Military Satellite Industry Revenue (billion), by Country 2025 & 2033
- Figure 51: Asia Pacific Military Satellite Industry Revenue Share (%), by Country 2025 & 2033
List of Tables
- Table 1: Global Military Satellite Industry Revenue billion Forecast, by Satellite Mass 2020 & 2033
- Table 2: Global Military Satellite Industry Revenue billion Forecast, by Orbit Class 2020 & 2033
- Table 3: Global Military Satellite Industry Revenue billion Forecast, by Satellite Subsystem 2020 & 2033
- Table 4: Global Military Satellite Industry Revenue billion Forecast, by Application 2020 & 2033
- Table 5: Global Military Satellite Industry Revenue billion Forecast, by Region 2020 & 2033
- Table 6: Global Military Satellite Industry Revenue billion Forecast, by Satellite Mass 2020 & 2033
- Table 7: Global Military Satellite Industry Revenue billion Forecast, by Orbit Class 2020 & 2033
- Table 8: Global Military Satellite Industry Revenue billion Forecast, by Satellite Subsystem 2020 & 2033
- Table 9: Global Military Satellite Industry Revenue billion Forecast, by Application 2020 & 2033
- Table 10: Global Military Satellite Industry Revenue billion Forecast, by Country 2020 & 2033
- Table 11: United States Military Satellite Industry Revenue (billion) Forecast, by Application 2020 & 2033
- Table 12: Canada Military Satellite Industry Revenue (billion) Forecast, by Application 2020 & 2033
- Table 13: Mexico Military Satellite Industry Revenue (billion) Forecast, by Application 2020 & 2033
- Table 14: Global Military Satellite Industry Revenue billion Forecast, by Satellite Mass 2020 & 2033
- Table 15: Global Military Satellite Industry Revenue billion Forecast, by Orbit Class 2020 & 2033
- Table 16: Global Military Satellite Industry Revenue billion Forecast, by Satellite Subsystem 2020 & 2033
- Table 17: Global Military Satellite Industry Revenue billion Forecast, by Application 2020 & 2033
- Table 18: Global Military Satellite Industry Revenue billion Forecast, by Country 2020 & 2033
- Table 19: Brazil Military Satellite Industry Revenue (billion) Forecast, by Application 2020 & 2033
- Table 20: Argentina Military Satellite Industry Revenue (billion) Forecast, by Application 2020 & 2033
- Table 21: Rest of South America Military Satellite Industry Revenue (billion) Forecast, by Application 2020 & 2033
- Table 22: Global Military Satellite Industry Revenue billion Forecast, by Satellite Mass 2020 & 2033
- Table 23: Global Military Satellite Industry Revenue billion Forecast, by Orbit Class 2020 & 2033
- Table 24: Global Military Satellite Industry Revenue billion Forecast, by Satellite Subsystem 2020 & 2033
- Table 25: Global Military Satellite Industry Revenue billion Forecast, by Application 2020 & 2033
- Table 26: Global Military Satellite Industry Revenue billion Forecast, by Country 2020 & 2033
- Table 27: United Kingdom Military Satellite Industry Revenue (billion) Forecast, by Application 2020 & 2033
- Table 28: Germany Military Satellite Industry Revenue (billion) Forecast, by Application 2020 & 2033
- Table 29: France Military Satellite Industry Revenue (billion) Forecast, by Application 2020 & 2033
- Table 30: Italy Military Satellite Industry Revenue (billion) Forecast, by Application 2020 & 2033
- Table 31: Spain Military Satellite Industry Revenue (billion) Forecast, by Application 2020 & 2033
- Table 32: Russia Military Satellite Industry Revenue (billion) Forecast, by Application 2020 & 2033
- Table 33: Benelux Military Satellite Industry Revenue (billion) Forecast, by Application 2020 & 2033
- Table 34: Nordics Military Satellite Industry Revenue (billion) Forecast, by Application 2020 & 2033
- Table 35: Rest of Europe Military Satellite Industry Revenue (billion) Forecast, by Application 2020 & 2033
- Table 36: Global Military Satellite Industry Revenue billion Forecast, by Satellite Mass 2020 & 2033
- Table 37: Global Military Satellite Industry Revenue billion Forecast, by Orbit Class 2020 & 2033
- Table 38: Global Military Satellite Industry Revenue billion Forecast, by Satellite Subsystem 2020 & 2033
- Table 39: Global Military Satellite Industry Revenue billion Forecast, by Application 2020 & 2033
- Table 40: Global Military Satellite Industry Revenue billion Forecast, by Country 2020 & 2033
- Table 41: Turkey Military Satellite Industry Revenue (billion) Forecast, by Application 2020 & 2033
- Table 42: Israel Military Satellite Industry Revenue (billion) Forecast, by Application 2020 & 2033
- Table 43: GCC Military Satellite Industry Revenue (billion) Forecast, by Application 2020 & 2033
- Table 44: North Africa Military Satellite Industry Revenue (billion) Forecast, by Application 2020 & 2033
- Table 45: South Africa Military Satellite Industry Revenue (billion) Forecast, by Application 2020 & 2033
- Table 46: Rest of Middle East & Africa Military Satellite Industry Revenue (billion) Forecast, by Application 2020 & 2033
- Table 47: Global Military Satellite Industry Revenue billion Forecast, by Satellite Mass 2020 & 2033
- Table 48: Global Military Satellite Industry Revenue billion Forecast, by Orbit Class 2020 & 2033
- Table 49: Global Military Satellite Industry Revenue billion Forecast, by Satellite Subsystem 2020 & 2033
- Table 50: Global Military Satellite Industry Revenue billion Forecast, by Application 2020 & 2033
- Table 51: Global Military Satellite Industry Revenue billion Forecast, by Country 2020 & 2033
- Table 52: China Military Satellite Industry Revenue (billion) Forecast, by Application 2020 & 2033
- Table 53: India Military Satellite Industry Revenue (billion) Forecast, by Application 2020 & 2033
- Table 54: Japan Military Satellite Industry Revenue (billion) Forecast, by Application 2020 & 2033
- Table 55: South Korea Military Satellite Industry Revenue (billion) Forecast, by Application 2020 & 2033
- Table 56: ASEAN Military Satellite Industry Revenue (billion) Forecast, by Application 2020 & 2033
- Table 57: Oceania Military Satellite Industry Revenue (billion) Forecast, by Application 2020 & 2033
- Table 58: Rest of Asia Pacific Military Satellite Industry Revenue (billion) Forecast, by Application 2020 & 2033
Frequently Asked Questions
1. What is the projected Compound Annual Growth Rate (CAGR) of the Military Satellite Industry?
The projected CAGR is approximately 10%.
2. Which companies are prominent players in the Military Satellite Industry?
Key companies in the market include Information Satellite Systems Reshetnev, Raytheon Technologies Corporation, BAE Systems, Lockheed Martin Corporation, Airbus SE, Viasat Inc, China Aerospace Science and Technology Corporation (CASC), General Dynamics, Thales, Elbit Systems, ROSCOSMOS, Indian Space Research Organisation (ISRO).
3. What are the main segments of the Military Satellite Industry?
The market segments include Satellite Mass, Orbit Class, Satellite Subsystem, Application.
4. Can you provide details about the market size?
The market size is estimated to be USD 36 billion as of 2022.
5. What are some drivers contributing to market growth?
N/A
6. What are the notable trends driving market growth?
OTHER KEY INDUSTRY TRENDS COVERED IN THE REPORT.
7. Are there any restraints impacting market growth?
N/A
8. Can you provide examples of recent developments in the market?
February 2023: Blue Canyon Technologies LLC, a subsidiary of Raytheon Technologies, provided critical hardware components for several of the SmallSat missions aboard the Transporter-6 launch that pitched 114 small payloads into polar orbit.February 2023: Blue Canyon Technologies LLC, a subsidiary of Raytheon Technologies, provided critical hardware components for several of the smallsat missions aboard the Transporter-6 launch, which pitched 114 small payloads into polar orbit.January 2023: Raytheon Intelligence & Space was awarded a major contract to develop a prototype missile tracking system for the US Space Force. MTC is the service's first missile tracking system for medium earth orbit. Under this contract, Raytheon Intelligence & Space will act as the main contractor, developing and delivering a state-of-the-art space vehicle, missile tracking mission payload, and command and control elements for ground and data processing missions.
9. What pricing options are available for accessing the report?
Pricing options include single-user, multi-user, and enterprise licenses priced at USD 3800, USD 4500, and USD 5800 respectively.
10. Is the market size provided in terms of value or volume?
The market size is provided in terms of value, measured in billion.
11. Are there any specific market keywords associated with the report?
Yes, the market keyword associated with the report is "Military Satellite Industry," which aids in identifying and referencing the specific market segment covered.
12. How do I determine which pricing option suits my needs best?
The pricing options vary based on user requirements and access needs. Individual users may opt for single-user licenses, while businesses requiring broader access may choose multi-user or enterprise licenses for cost-effective access to the report.
13. Are there any additional resources or data provided in the Military Satellite Industry report?
While the report offers comprehensive insights, it's advisable to review the specific contents or supplementary materials provided to ascertain if additional resources or data are available.
14. How can I stay updated on further developments or reports in the Military Satellite Industry?
To stay informed about further developments, trends, and reports in the Military Satellite Industry, consider subscribing to industry newsletters, following relevant companies and organizations, or regularly checking reputable industry news sources and publications.
Methodology
Step 1 - Identification of Relevant Samples Size from Population Database


Step 2 - Approaches for Defining Global Market Size (Value, Volume* & Price*)

Note*: In applicable scenarios
Step 3 - Data Sources
Primary Research
- Web Analytics
- Survey Reports
- Research Institute
- Latest Research Reports
- Opinion Leaders
Secondary Research
- Annual Reports
- White Paper
- Latest Press Release
- Industry Association
- Paid Database
- Investor Presentations

Step 4 - Data Triangulation
Involves using different sources of information in order to increase the validity of a study
These sources are likely to be stakeholders in a program - participants, other researchers, program staff, other community members, and so on.
Then we put all data in single framework & apply various statistical tools to find out the dynamic on the market.
During the analysis stage, feedback from the stakeholder groups would be compared to determine areas of agreement as well as areas of divergence