

Key Insights
The global Electronically Scanned Array (ESA) Radar Market is poised for significant expansion, projected to reach approximately $12.35 billion by 2025 and continuing its growth through 2033. This market anticipates a Compound Annual Growth Rate (CAGR) of 9.7%, underscoring robust and dynamic development. Key growth catalysts include escalating adoption of advanced radar systems within defense and security, driven by evolving geopolitical landscapes and the imperative for enhanced threat detection. The inherent superiority of ESA technology—offering greater agility, multi-functionality, and reliability over traditional mechanically steered radars—is accelerating its integration across diverse applications such as air traffic control, weather forecasting, and maritime surveillance. Concurrent with this expansion, research and development efforts are intensifying for more sophisticated ESA solutions, particularly Active Electronically Scanned Array (AESA) systems, which promise elevated performance and versatility.
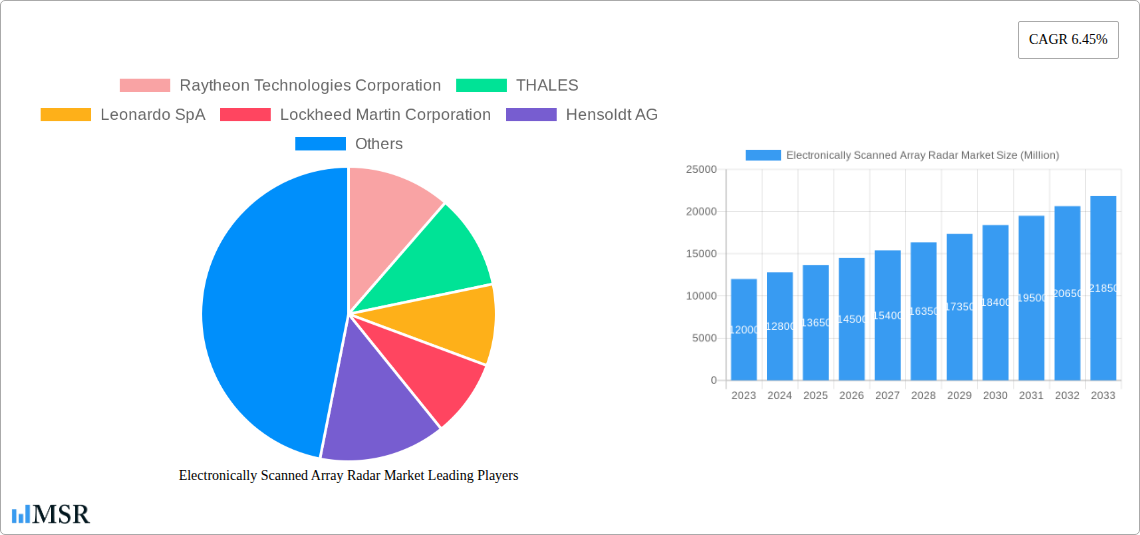
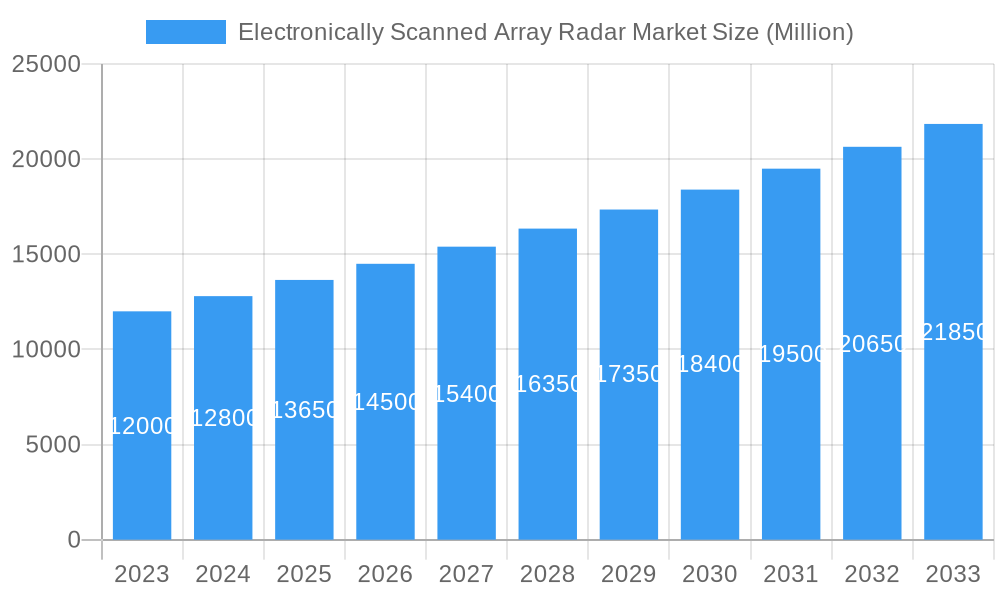
Electronically Scanned Array Radar Market Market Size (In Billion)
Several pivotal trends are shaping the ESA Radar Market landscape. A primary driver is the surging demand for airborne radar systems, notably for fighter jets, surveillance aircraft, and unmanned aerial vehicles (UAVs). Additionally, increased global investment in homeland security and border surveillance solutions is creating new opportunities for ESA radar deployment. While demand is strong, market growth faces challenges, including the substantial initial investment required for research, development, and manufacturing of these advanced systems, alongside the ongoing need for specialized operational and maintenance expertise. Nevertheless, the long-term advantages, such as enhanced operational effectiveness and reduced lifecycle costs, are expected to mitigate these constraints. Leading market participants, including Raytheon Technologies Corporation, THALES, and Lockheed Martin Corporation, are actively pursuing innovation and strategic alliances to secure their market positions and capitalize on emerging opportunities. The Asia Pacific region, characterized by rising defense expenditures and rapid technological advancement, is anticipated to become a significant growth engine for the ESA Radar Market.
Electronically Scanned Array Radar Market Company Market Share
This comprehensive report offers an in-depth analysis of the global electronically scanned array (AESA) radar market, spanning the period from 2019 to 2033, with 2025 designated as the base year. It provides critical insights into market dynamics, growth drivers, challenges, and future opportunities. The study includes a detailed breakdown of production analysis, consumption analysis, import and export market analysis (value & volume), and price trend analysis. This report serves as an indispensable resource for industry stakeholders, defense contractors, government agencies, and investors aiming to comprehend the trajectory of this crucial aerospace and defense electronics market.
Electronically Scanned Array Radar Market Market Concentration & Dynamics
The AESA radar market exhibits a moderate to high market concentration, with a handful of leading global players dominating a significant share of the market. Innovation is a key differentiator, with substantial investments in research and development driving the evolution of advanced radar technologies. The innovation ecosystem thrives on collaboration between defense prime contractors and specialized technology providers. Regulatory frameworks, particularly in defense procurement and export control, play a crucial role in shaping market access and competitiveness. Substitute products, while present in certain niche applications, are increasingly being outperformed by the superior capabilities of AESA radar systems. End-user trends are heavily influenced by increasing defense budgets, the need for enhanced situational awareness, and the adoption of networked warfare concepts. Mergers and acquisitions (M&A) activities are moderate, driven by the desire to consolidate expertise, expand product portfolios, and secure key technologies. The market share distribution is dynamic, with major players like Raytheon Technologies Corporation and Lockheed Martin Corporation consistently holding significant positions.
Electronically Scanned Array Radar Market Industry Insights & Trends
The global electronically scanned array radar market is experiencing robust growth, propelled by escalating geopolitical tensions, modernization initiatives in defense sectors worldwide, and the intrinsic technological superiority of AESA radar systems. The market size for AESA radar is projected to reach significant valuations, with a projected Compound Annual Growth Rate (CAGR) in the xx% range over the forecast period of 2025–2033. Market growth drivers include the persistent demand for advanced air surveillance, missile defense systems, electronic warfare capabilities, and precision targeting solutions. Technological disruptions are a constant feature, with ongoing advancements in phased array antenna technology, digital beamforming, miniaturization, and artificial intelligence (AI) integration leading to more capable, compact, and cost-effective radar solutions. Evolving consumer behaviors, particularly within government and defense agencies, emphasize integrated system solutions, multi-functionality, and enhanced interoperability. The increasing adoption of AESA radar in both military and increasingly in civilian applications like air traffic control and weather forecasting further fuels market expansion. The pursuit of next-generation radar capabilities, including cognitive radar and quantum radar, signals a dynamic future for the industry, promising even greater performance and adaptability. The forecast period will witness a significant increase in the adoption of solid-state technology, reducing maintenance costs and enhancing reliability.
Key Markets & Segments Leading Electronically Scanned Array Radar Market
The AESA radar market is characterized by distinct regional dominance and segment leadership, driven by a confluence of factors.
Production Analysis:
- Dominant Region: North America, particularly the United States, leads in production capacity due to a well-established defense industrial base and significant government investment in advanced radar programs.
- Key Countries: The United States, followed by European nations and increasingly, countries in the Asia-Pacific region like China and South Korea, are major production hubs.
Consumption Analysis:
- Dominant Region: North America and Europe continue to be the largest consumers, driven by extensive military modernization and existing fleets of advanced aircraft and naval vessels.
- Drivers: High defense spending, active participation in global security operations, and the imperative to maintain technological superiority are key consumption drivers.
Import Market Analysis (Value & Volume):
- Leading Importer: Countries undergoing rapid military modernization and lacking domestic advanced manufacturing capabilities, such as India and several Middle Eastern nations, are significant importers.
- Drivers: The need for state-of-the-art defense systems to counter evolving threats and enhance national security drives import volumes and values.
Export Market Analysis (Value & Volume):
- Leading Exporters: The United States, European nations (e.g., France, Germany), and Israel are major exporters of AESA radar systems and components.
- Drivers: Technological leadership, established international defense partnerships, and the ability to offer customized solutions contribute to strong export performance.
Price Trend Analysis:
- Trend: While the initial cost of AESA radar systems can be high, advancements in manufacturing and increased competition are leading to a gradual decrease in the cost per unit over the long term, particularly for high-volume production.
- Factors Influencing Price: Technological complexity, material costs, R&D investments, and government procurement strategies significantly influence pricing trends.
Electronically Scanned Array Radar Market Product Developments
Product development in the AESA radar market is intensely focused on enhancing performance, reducing size, weight, and power (SWaP) requirements, and increasing multi-functionality. Innovations include the development of solid-state Gallium Nitride (GaN) based transmit/receive (T/R) modules for higher power efficiency, digital beamforming for greater flexibility, and AI-driven signal processing for improved target detection and tracking in complex environments. New applications are emerging beyond traditional military platforms, with AESA radar being integrated into unmanned aerial vehicles (UAVs), ground-based air defense systems, and advanced maritime surveillance platforms. The competitive edge is increasingly derived from software-defined capabilities and seamless integration into broader network-centric warfare architectures.
Challenges in the Electronically Scanned Array Radar Market Market
The AESA radar market faces several significant challenges that can impact growth and market penetration.
- High Development Costs: The extensive research and development required for cutting-edge AESA technology results in substantial upfront investment for manufacturers.
- Complex Supply Chains: The intricate nature of component sourcing and manufacturing for advanced radar systems can lead to supply chain vulnerabilities and delays.
- Stringent Regulatory Hurdles: Export controls and national security regulations for sensitive defense technologies can restrict market access and international sales.
- Intense Competition: A crowded market with established players and emerging contenders necessitates continuous innovation and competitive pricing strategies.
- Talent Acquisition: The specialized skills required for designing, developing, and manufacturing AESA radar systems create challenges in attracting and retaining a skilled workforce.
Forces Driving Electronically Scanned Array Radar Market Growth
Several powerful forces are propelling the AESA radar market forward. Geopolitical instability and the need for advanced defense capabilities are paramount drivers. Modernization programs by numerous countries are fueling demand for sophisticated radar systems capable of providing superior situational awareness and threat detection. Technological advancements, particularly in areas like AI, machine learning, and advanced materials, are continuously improving radar performance and enabling new functionalities. The increasing adoption of networked warfare doctrines necessitates interoperable and high-performance radar systems. Furthermore, the growing integration of AESA radar into unmanned systems and other emerging defense platforms opens up new avenues for market expansion.
Challenges in the Electronically Scanned Array Radar Market Market
The AESA radar market is poised for substantial long-term growth, driven by several key factors. The ongoing evolution of threats demands continuous investment in advanced defense technologies, with AESA radar being at the forefront of this evolution. Partnerships and collaborations between prime contractors, component manufacturers, and research institutions are accelerating innovation and the development of next-generation systems. Market expansions into new geographical regions with growing defense expenditures and the adaptation of AESA technology for emerging applications, such as border surveillance and critical infrastructure protection, will contribute to sustained growth. The drive towards miniaturization and reduced SWaP will enable wider adoption across a broader range of platforms, from small drones to naval vessels.
Emerging Opportunities in Electronically Scanned Array Radar Market
The AESA radar market presents a landscape rich with emerging opportunities. The increasing proliferation of unmanned aerial systems (UAS) is creating a significant demand for compact and intelligent AESA radar solutions for onboard sensing and counter-UAS applications. The rise of smart cities and the need for advanced air traffic management systems are opening up civilian market avenues. Developments in AI and machine learning are enabling the creation of cognitive radar systems that can adapt their operational parameters in real-time, offering unprecedented levels of performance. Furthermore, the ongoing trend towards digital transformation in defense procurement is creating opportunities for integrated, software-defined radar solutions that offer enhanced flexibility and lifecycle support. The development of multi-function radar systems capable of performing air surveillance, electronic warfare, and communication simultaneously represents a significant growth area.
Leading Players in the Electronically Scanned Array Radar Market Sector
- Raytheon Technologies Corporation
- Lockheed Martin Corporation
- Northrop Grumman Corporation
- Hensoldt AG
- RADA Electronic Industries Ltd
- Leonardo SpA
- THALES
- Mitsubishi Electric Corporation
- Israel Aerospace Industries
- ASELSAN A
- CEA Technologies
- Saab AB
Key Milestones in Electronically Scanned Array Radar Market Industry
- March 2023: The Indian Ministry of Defence (MoD) signed two contracts worth USD448.44m with Bharat Electronics Limited (BEL) to provide radar and warning receivers for the Indian Air Force.
- September 2022: Raytheon secured a contract worth USD 19.4 Million for the procurement of 129 items to support the APG-79 AESA radar system installed on the F/A-18 aircraft, awarded by the Naval Supply Systems Command Weapon Systems Support, Philadelphia, PA.
Strategic Outlook for Electronically Scanned Array Radar Market Market
The strategic outlook for the AESA radar market is exceptionally promising, characterized by sustained demand and continuous innovation. Growth accelerators include the ongoing global focus on national security, driven by evolving geopolitical landscapes, which necessitates advanced surveillance and defense capabilities. The relentless pace of technological advancement, particularly in digital processing and AI integration, will further enhance radar system performance and functionality, driving adoption across a wider spectrum of applications. Strategic opportunities lie in expanding into emerging defense markets, developing cost-effective solutions for smaller platforms, and fostering stronger collaborations within the supply chain to ensure resilience and efficiency. The market is expected to witness increased investment in research and development, focusing on next-generation radar technologies and robust cybersecurity measures to protect these critical systems.
Electronically Scanned Array Radar Market Segmentation
- 1. Production Analysis
- 2. Consumption Analysis
- 3. Import Market Analysis (Value & Volume)
- 4. Export Market Analysis (Value & Volume)
- 5. Price Trend Analysis
Electronically Scanned Array Radar Market Segmentation By Geography
-
1. North America
- 1.1. United States
- 1.2. Canada
- 1.3. Mexico
-
2. South America
- 2.1. Brazil
- 2.2. Argentina
- 2.3. Rest of South America
-
3. Europe
- 3.1. United Kingdom
- 3.2. Germany
- 3.3. France
- 3.4. Italy
- 3.5. Spain
- 3.6. Russia
- 3.7. Benelux
- 3.8. Nordics
- 3.9. Rest of Europe
-
4. Middle East & Africa
- 4.1. Turkey
- 4.2. Israel
- 4.3. GCC
- 4.4. North Africa
- 4.5. South Africa
- 4.6. Rest of Middle East & Africa
-
5. Asia Pacific
- 5.1. China
- 5.2. India
- 5.3. Japan
- 5.4. South Korea
- 5.5. ASEAN
- 5.6. Oceania
- 5.7. Rest of Asia Pacific
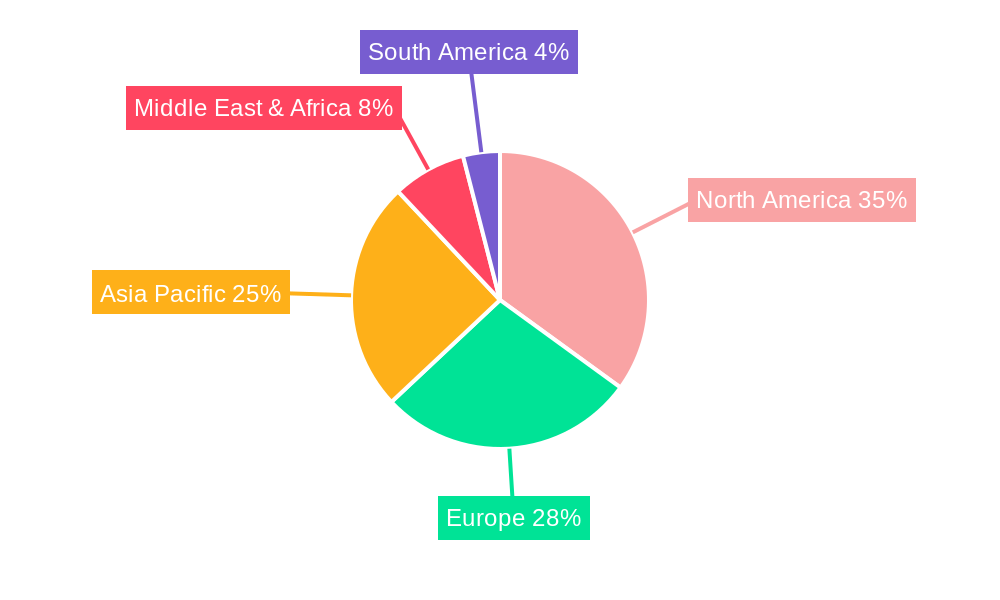
Electronically Scanned Array Radar Market Regional Market Share
Geographic Coverage of Electronically Scanned Array Radar Market
Electronically Scanned Array Radar Market REPORT HIGHLIGHTS
| Aspects | Details |
|---|---|
| Study Period | 2020-2034 |
| Base Year | 2025 |
| Estimated Year | 2026 |
| Forecast Period | 2026-2034 |
| Historical Period | 2020-2025 |
| Growth Rate | CAGR of 9.7% from 2020-2034 |
| Segmentation |
|
Table of Contents
- 1. Introduction
- 1.1. Research Scope
- 1.2. Market Segmentation
- 1.3. Research Objective
- 1.4. Definitions and Assumptions
- 2. Executive Summary
- 2.1. Market Snapshot
- 3. Market Dynamics
- 3.1. Market Drivers
- 3.2. Market Restrains
- 3.3. Market Trends
- 3.4. Market Opportunities
- 4. Market Factor Analysis
- 4.1. Porters Five Forces
- 4.1.1. Bargaining Power of Suppliers
- 4.1.2. Bargaining Power of Buyers
- 4.1.3. Threat of New Entrants
- 4.1.4. Threat of Substitutes
- 4.1.5. Competitive Rivalry
- 4.2. PESTEL analysis
- 4.3. BCG Analysis
- 4.3.1. Stars (High Growth, High Market Share)
- 4.3.2. Cash Cows (Low Growth, High Market Share)
- 4.3.3. Question Mark (High Growth, Low Market Share)
- 4.3.4. Dogs (Low Growth, Low Market Share)
- 4.4. Ansoff Matrix Analysis
- 4.5. Supply Chain Analysis
- 4.6. Regulatory Landscape
- 4.7. Current Market Potential and Opportunity Assessment (TAM–SAM–SOM Framework)
- 4.8. MSR Analyst Note
- 4.1. Porters Five Forces
- 5. Market Analysis, Insights and Forecast 2021-2033
- 5.1. Market Analysis, Insights and Forecast - by Production Analysis
- 5.2. Market Analysis, Insights and Forecast - by Consumption Analysis
- 5.3. Market Analysis, Insights and Forecast - by Import Market Analysis (Value & Volume)
- 5.4. Market Analysis, Insights and Forecast - by Export Market Analysis (Value & Volume)
- 5.5. Market Analysis, Insights and Forecast - by Price Trend Analysis
- 5.6. Market Analysis, Insights and Forecast - by Region
- 5.6.1. North America
- 5.6.2. South America
- 5.6.3. Europe
- 5.6.4. Middle East & Africa
- 5.6.5. Asia Pacific
- 6. Global Electronically Scanned Array Radar Market Analysis, Insights and Forecast, 2021-2033
- 6.1. Market Analysis, Insights and Forecast - by Production Analysis
- 6.2. Market Analysis, Insights and Forecast - by Consumption Analysis
- 6.3. Market Analysis, Insights and Forecast - by Import Market Analysis (Value & Volume)
- 6.4. Market Analysis, Insights and Forecast - by Export Market Analysis (Value & Volume)
- 6.5. Market Analysis, Insights and Forecast - by Price Trend Analysis
- 7. North America Electronically Scanned Array Radar Market Analysis, Insights and Forecast, 2020-2032
- 7.1. Market Analysis, Insights and Forecast - by Production Analysis
- 7.2. Market Analysis, Insights and Forecast - by Consumption Analysis
- 7.3. Market Analysis, Insights and Forecast - by Import Market Analysis (Value & Volume)
- 7.4. Market Analysis, Insights and Forecast - by Export Market Analysis (Value & Volume)
- 7.5. Market Analysis, Insights and Forecast - by Price Trend Analysis
- 8. South America Electronically Scanned Array Radar Market Analysis, Insights and Forecast, 2020-2032
- 8.1. Market Analysis, Insights and Forecast - by Production Analysis
- 8.2. Market Analysis, Insights and Forecast - by Consumption Analysis
- 8.3. Market Analysis, Insights and Forecast - by Import Market Analysis (Value & Volume)
- 8.4. Market Analysis, Insights and Forecast - by Export Market Analysis (Value & Volume)
- 8.5. Market Analysis, Insights and Forecast - by Price Trend Analysis
- 9. Europe Electronically Scanned Array Radar Market Analysis, Insights and Forecast, 2020-2032
- 9.1. Market Analysis, Insights and Forecast - by Production Analysis
- 9.2. Market Analysis, Insights and Forecast - by Consumption Analysis
- 9.3. Market Analysis, Insights and Forecast - by Import Market Analysis (Value & Volume)
- 9.4. Market Analysis, Insights and Forecast - by Export Market Analysis (Value & Volume)
- 9.5. Market Analysis, Insights and Forecast - by Price Trend Analysis
- 10. Middle East & Africa Electronically Scanned Array Radar Market Analysis, Insights and Forecast, 2020-2032
- 10.1. Market Analysis, Insights and Forecast - by Production Analysis
- 10.2. Market Analysis, Insights and Forecast - by Consumption Analysis
- 10.3. Market Analysis, Insights and Forecast - by Import Market Analysis (Value & Volume)
- 10.4. Market Analysis, Insights and Forecast - by Export Market Analysis (Value & Volume)
- 10.5. Market Analysis, Insights and Forecast - by Price Trend Analysis
- 11. Asia Pacific Electronically Scanned Array Radar Market Analysis, Insights and Forecast, 2020-2032
- 11.1. Market Analysis, Insights and Forecast - by Production Analysis
- 11.2. Market Analysis, Insights and Forecast - by Consumption Analysis
- 11.3. Market Analysis, Insights and Forecast - by Import Market Analysis (Value & Volume)
- 11.4. Market Analysis, Insights and Forecast - by Export Market Analysis (Value & Volume)
- 11.5. Market Analysis, Insights and Forecast - by Price Trend Analysis
- 12. Competitive Analysis
- 12.1. Company Profiles
- 12.1.1 Raytheon Technologies Corporation
- 12.1.1.1. Company Overview
- 12.1.1.2. Products
- 12.1.1.3. Company Financials
- 12.1.1.4. SWOT Analysis
- 12.1.2 THALES
- 12.1.2.1. Company Overview
- 12.1.2.2. Products
- 12.1.2.3. Company Financials
- 12.1.2.4. SWOT Analysis
- 12.1.3 Leonardo SpA
- 12.1.3.1. Company Overview
- 12.1.3.2. Products
- 12.1.3.3. Company Financials
- 12.1.3.4. SWOT Analysis
- 12.1.4 Lockheed Martin Corporation
- 12.1.4.1. Company Overview
- 12.1.4.2. Products
- 12.1.4.3. Company Financials
- 12.1.4.4. SWOT Analysis
- 12.1.5 Hensoldt AG
- 12.1.5.1. Company Overview
- 12.1.5.2. Products
- 12.1.5.3. Company Financials
- 12.1.5.4. SWOT Analysis
- 12.1.6 RADA Electronic Industries Ltd
- 12.1.6.1. Company Overview
- 12.1.6.2. Products
- 12.1.6.3. Company Financials
- 12.1.6.4. SWOT Analysis
- 12.1.7 Mitsubishi Electric Corporation
- 12.1.7.1. Company Overview
- 12.1.7.2. Products
- 12.1.7.3. Company Financials
- 12.1.7.4. SWOT Analysis
- 12.1.8 Israel Aerospace Industries
- 12.1.8.1. Company Overview
- 12.1.8.2. Products
- 12.1.8.3. Company Financials
- 12.1.8.4. SWOT Analysis
- 12.1.9 ASELSAN A
- 12.1.9.1. Company Overview
- 12.1.9.2. Products
- 12.1.9.3. Company Financials
- 12.1.9.4. SWOT Analysis
- 12.1.10 CEA Technologies
- 12.1.10.1. Company Overview
- 12.1.10.2. Products
- 12.1.10.3. Company Financials
- 12.1.10.4. SWOT Analysis
- 12.1.11 Northrop Grumman Corporation
- 12.1.11.1. Company Overview
- 12.1.11.2. Products
- 12.1.11.3. Company Financials
- 12.1.11.4. SWOT Analysis
- 12.1.12 Saab AB
- 12.1.12.1. Company Overview
- 12.1.12.2. Products
- 12.1.12.3. Company Financials
- 12.1.12.4. SWOT Analysis
- 12.1.1 Raytheon Technologies Corporation
- 12.2. Market Entropy
- 12.2.1 Company's Key Areas Served
- 12.2.2 Recent Developments
- 12.3. Company Market Share Analysis 2025
- 12.3.1 Top 5 Companies Market Share Analysis
- 12.3.2 Top 3 Companies Market Share Analysis
- 12.4. List of Potential Customers
- 13. Research Methodology
List of Figures
- Figure 1: Global Electronically Scanned Array Radar Market Revenue Breakdown (billion, %) by Region 2025 & 2033
- Figure 2: North America Electronically Scanned Array Radar Market Revenue (billion), by Production Analysis 2025 & 2033
- Figure 3: North America Electronically Scanned Array Radar Market Revenue Share (%), by Production Analysis 2025 & 2033
- Figure 4: North America Electronically Scanned Array Radar Market Revenue (billion), by Consumption Analysis 2025 & 2033
- Figure 5: North America Electronically Scanned Array Radar Market Revenue Share (%), by Consumption Analysis 2025 & 2033
- Figure 6: North America Electronically Scanned Array Radar Market Revenue (billion), by Import Market Analysis (Value & Volume) 2025 & 2033
- Figure 7: North America Electronically Scanned Array Radar Market Revenue Share (%), by Import Market Analysis (Value & Volume) 2025 & 2033
- Figure 8: North America Electronically Scanned Array Radar Market Revenue (billion), by Export Market Analysis (Value & Volume) 2025 & 2033
- Figure 9: North America Electronically Scanned Array Radar Market Revenue Share (%), by Export Market Analysis (Value & Volume) 2025 & 2033
- Figure 10: North America Electronically Scanned Array Radar Market Revenue (billion), by Price Trend Analysis 2025 & 2033
- Figure 11: North America Electronically Scanned Array Radar Market Revenue Share (%), by Price Trend Analysis 2025 & 2033
- Figure 12: North America Electronically Scanned Array Radar Market Revenue (billion), by Country 2025 & 2033
- Figure 13: North America Electronically Scanned Array Radar Market Revenue Share (%), by Country 2025 & 2033
- Figure 14: South America Electronically Scanned Array Radar Market Revenue (billion), by Production Analysis 2025 & 2033
- Figure 15: South America Electronically Scanned Array Radar Market Revenue Share (%), by Production Analysis 2025 & 2033
- Figure 16: South America Electronically Scanned Array Radar Market Revenue (billion), by Consumption Analysis 2025 & 2033
- Figure 17: South America Electronically Scanned Array Radar Market Revenue Share (%), by Consumption Analysis 2025 & 2033
- Figure 18: South America Electronically Scanned Array Radar Market Revenue (billion), by Import Market Analysis (Value & Volume) 2025 & 2033
- Figure 19: South America Electronically Scanned Array Radar Market Revenue Share (%), by Import Market Analysis (Value & Volume) 2025 & 2033
- Figure 20: South America Electronically Scanned Array Radar Market Revenue (billion), by Export Market Analysis (Value & Volume) 2025 & 2033
- Figure 21: South America Electronically Scanned Array Radar Market Revenue Share (%), by Export Market Analysis (Value & Volume) 2025 & 2033
- Figure 22: South America Electronically Scanned Array Radar Market Revenue (billion), by Price Trend Analysis 2025 & 2033
- Figure 23: South America Electronically Scanned Array Radar Market Revenue Share (%), by Price Trend Analysis 2025 & 2033
- Figure 24: South America Electronically Scanned Array Radar Market Revenue (billion), by Country 2025 & 2033
- Figure 25: South America Electronically Scanned Array Radar Market Revenue Share (%), by Country 2025 & 2033
- Figure 26: Europe Electronically Scanned Array Radar Market Revenue (billion), by Production Analysis 2025 & 2033
- Figure 27: Europe Electronically Scanned Array Radar Market Revenue Share (%), by Production Analysis 2025 & 2033
- Figure 28: Europe Electronically Scanned Array Radar Market Revenue (billion), by Consumption Analysis 2025 & 2033
- Figure 29: Europe Electronically Scanned Array Radar Market Revenue Share (%), by Consumption Analysis 2025 & 2033
- Figure 30: Europe Electronically Scanned Array Radar Market Revenue (billion), by Import Market Analysis (Value & Volume) 2025 & 2033
- Figure 31: Europe Electronically Scanned Array Radar Market Revenue Share (%), by Import Market Analysis (Value & Volume) 2025 & 2033
- Figure 32: Europe Electronically Scanned Array Radar Market Revenue (billion), by Export Market Analysis (Value & Volume) 2025 & 2033
- Figure 33: Europe Electronically Scanned Array Radar Market Revenue Share (%), by Export Market Analysis (Value & Volume) 2025 & 2033
- Figure 34: Europe Electronically Scanned Array Radar Market Revenue (billion), by Price Trend Analysis 2025 & 2033
- Figure 35: Europe Electronically Scanned Array Radar Market Revenue Share (%), by Price Trend Analysis 2025 & 2033
- Figure 36: Europe Electronically Scanned Array Radar Market Revenue (billion), by Country 2025 & 2033
- Figure 37: Europe Electronically Scanned Array Radar Market Revenue Share (%), by Country 2025 & 2033
- Figure 38: Middle East & Africa Electronically Scanned Array Radar Market Revenue (billion), by Production Analysis 2025 & 2033
- Figure 39: Middle East & Africa Electronically Scanned Array Radar Market Revenue Share (%), by Production Analysis 2025 & 2033
- Figure 40: Middle East & Africa Electronically Scanned Array Radar Market Revenue (billion), by Consumption Analysis 2025 & 2033
- Figure 41: Middle East & Africa Electronically Scanned Array Radar Market Revenue Share (%), by Consumption Analysis 2025 & 2033
- Figure 42: Middle East & Africa Electronically Scanned Array Radar Market Revenue (billion), by Import Market Analysis (Value & Volume) 2025 & 2033
- Figure 43: Middle East & Africa Electronically Scanned Array Radar Market Revenue Share (%), by Import Market Analysis (Value & Volume) 2025 & 2033
- Figure 44: Middle East & Africa Electronically Scanned Array Radar Market Revenue (billion), by Export Market Analysis (Value & Volume) 2025 & 2033
- Figure 45: Middle East & Africa Electronically Scanned Array Radar Market Revenue Share (%), by Export Market Analysis (Value & Volume) 2025 & 2033
- Figure 46: Middle East & Africa Electronically Scanned Array Radar Market Revenue (billion), by Price Trend Analysis 2025 & 2033
- Figure 47: Middle East & Africa Electronically Scanned Array Radar Market Revenue Share (%), by Price Trend Analysis 2025 & 2033
- Figure 48: Middle East & Africa Electronically Scanned Array Radar Market Revenue (billion), by Country 2025 & 2033
- Figure 49: Middle East & Africa Electronically Scanned Array Radar Market Revenue Share (%), by Country 2025 & 2033
- Figure 50: Asia Pacific Electronically Scanned Array Radar Market Revenue (billion), by Production Analysis 2025 & 2033
- Figure 51: Asia Pacific Electronically Scanned Array Radar Market Revenue Share (%), by Production Analysis 2025 & 2033
- Figure 52: Asia Pacific Electronically Scanned Array Radar Market Revenue (billion), by Consumption Analysis 2025 & 2033
- Figure 53: Asia Pacific Electronically Scanned Array Radar Market Revenue Share (%), by Consumption Analysis 2025 & 2033
- Figure 54: Asia Pacific Electronically Scanned Array Radar Market Revenue (billion), by Import Market Analysis (Value & Volume) 2025 & 2033
- Figure 55: Asia Pacific Electronically Scanned Array Radar Market Revenue Share (%), by Import Market Analysis (Value & Volume) 2025 & 2033
- Figure 56: Asia Pacific Electronically Scanned Array Radar Market Revenue (billion), by Export Market Analysis (Value & Volume) 2025 & 2033
- Figure 57: Asia Pacific Electronically Scanned Array Radar Market Revenue Share (%), by Export Market Analysis (Value & Volume) 2025 & 2033
- Figure 58: Asia Pacific Electronically Scanned Array Radar Market Revenue (billion), by Price Trend Analysis 2025 & 2033
- Figure 59: Asia Pacific Electronically Scanned Array Radar Market Revenue Share (%), by Price Trend Analysis 2025 & 2033
- Figure 60: Asia Pacific Electronically Scanned Array Radar Market Revenue (billion), by Country 2025 & 2033
- Figure 61: Asia Pacific Electronically Scanned Array Radar Market Revenue Share (%), by Country 2025 & 2033
List of Tables
- Table 1: Global Electronically Scanned Array Radar Market Revenue billion Forecast, by Production Analysis 2020 & 2033
- Table 2: Global Electronically Scanned Array Radar Market Revenue billion Forecast, by Consumption Analysis 2020 & 2033
- Table 3: Global Electronically Scanned Array Radar Market Revenue billion Forecast, by Import Market Analysis (Value & Volume) 2020 & 2033
- Table 4: Global Electronically Scanned Array Radar Market Revenue billion Forecast, by Export Market Analysis (Value & Volume) 2020 & 2033
- Table 5: Global Electronically Scanned Array Radar Market Revenue billion Forecast, by Price Trend Analysis 2020 & 2033
- Table 6: Global Electronically Scanned Array Radar Market Revenue billion Forecast, by Region 2020 & 2033
- Table 7: Global Electronically Scanned Array Radar Market Revenue billion Forecast, by Production Analysis 2020 & 2033
- Table 8: Global Electronically Scanned Array Radar Market Revenue billion Forecast, by Consumption Analysis 2020 & 2033
- Table 9: Global Electronically Scanned Array Radar Market Revenue billion Forecast, by Import Market Analysis (Value & Volume) 2020 & 2033
- Table 10: Global Electronically Scanned Array Radar Market Revenue billion Forecast, by Export Market Analysis (Value & Volume) 2020 & 2033
- Table 11: Global Electronically Scanned Array Radar Market Revenue billion Forecast, by Price Trend Analysis 2020 & 2033
- Table 12: Global Electronically Scanned Array Radar Market Revenue billion Forecast, by Country 2020 & 2033
- Table 13: United States Electronically Scanned Array Radar Market Revenue (billion) Forecast, by Application 2020 & 2033
- Table 14: Canada Electronically Scanned Array Radar Market Revenue (billion) Forecast, by Application 2020 & 2033
- Table 15: Mexico Electronically Scanned Array Radar Market Revenue (billion) Forecast, by Application 2020 & 2033
- Table 16: Global Electronically Scanned Array Radar Market Revenue billion Forecast, by Production Analysis 2020 & 2033
- Table 17: Global Electronically Scanned Array Radar Market Revenue billion Forecast, by Consumption Analysis 2020 & 2033
- Table 18: Global Electronically Scanned Array Radar Market Revenue billion Forecast, by Import Market Analysis (Value & Volume) 2020 & 2033
- Table 19: Global Electronically Scanned Array Radar Market Revenue billion Forecast, by Export Market Analysis (Value & Volume) 2020 & 2033
- Table 20: Global Electronically Scanned Array Radar Market Revenue billion Forecast, by Price Trend Analysis 2020 & 2033
- Table 21: Global Electronically Scanned Array Radar Market Revenue billion Forecast, by Country 2020 & 2033
- Table 22: Brazil Electronically Scanned Array Radar Market Revenue (billion) Forecast, by Application 2020 & 2033
- Table 23: Argentina Electronically Scanned Array Radar Market Revenue (billion) Forecast, by Application 2020 & 2033
- Table 24: Rest of South America Electronically Scanned Array Radar Market Revenue (billion) Forecast, by Application 2020 & 2033
- Table 25: Global Electronically Scanned Array Radar Market Revenue billion Forecast, by Production Analysis 2020 & 2033
- Table 26: Global Electronically Scanned Array Radar Market Revenue billion Forecast, by Consumption Analysis 2020 & 2033
- Table 27: Global Electronically Scanned Array Radar Market Revenue billion Forecast, by Import Market Analysis (Value & Volume) 2020 & 2033
- Table 28: Global Electronically Scanned Array Radar Market Revenue billion Forecast, by Export Market Analysis (Value & Volume) 2020 & 2033
- Table 29: Global Electronically Scanned Array Radar Market Revenue billion Forecast, by Price Trend Analysis 2020 & 2033
- Table 30: Global Electronically Scanned Array Radar Market Revenue billion Forecast, by Country 2020 & 2033
- Table 31: United Kingdom Electronically Scanned Array Radar Market Revenue (billion) Forecast, by Application 2020 & 2033
- Table 32: Germany Electronically Scanned Array Radar Market Revenue (billion) Forecast, by Application 2020 & 2033
- Table 33: France Electronically Scanned Array Radar Market Revenue (billion) Forecast, by Application 2020 & 2033
- Table 34: Italy Electronically Scanned Array Radar Market Revenue (billion) Forecast, by Application 2020 & 2033
- Table 35: Spain Electronically Scanned Array Radar Market Revenue (billion) Forecast, by Application 2020 & 2033
- Table 36: Russia Electronically Scanned Array Radar Market Revenue (billion) Forecast, by Application 2020 & 2033
- Table 37: Benelux Electronically Scanned Array Radar Market Revenue (billion) Forecast, by Application 2020 & 2033
- Table 38: Nordics Electronically Scanned Array Radar Market Revenue (billion) Forecast, by Application 2020 & 2033
- Table 39: Rest of Europe Electronically Scanned Array Radar Market Revenue (billion) Forecast, by Application 2020 & 2033
- Table 40: Global Electronically Scanned Array Radar Market Revenue billion Forecast, by Production Analysis 2020 & 2033
- Table 41: Global Electronically Scanned Array Radar Market Revenue billion Forecast, by Consumption Analysis 2020 & 2033
- Table 42: Global Electronically Scanned Array Radar Market Revenue billion Forecast, by Import Market Analysis (Value & Volume) 2020 & 2033
- Table 43: Global Electronically Scanned Array Radar Market Revenue billion Forecast, by Export Market Analysis (Value & Volume) 2020 & 2033
- Table 44: Global Electronically Scanned Array Radar Market Revenue billion Forecast, by Price Trend Analysis 2020 & 2033
- Table 45: Global Electronically Scanned Array Radar Market Revenue billion Forecast, by Country 2020 & 2033
- Table 46: Turkey Electronically Scanned Array Radar Market Revenue (billion) Forecast, by Application 2020 & 2033
- Table 47: Israel Electronically Scanned Array Radar Market Revenue (billion) Forecast, by Application 2020 & 2033
- Table 48: GCC Electronically Scanned Array Radar Market Revenue (billion) Forecast, by Application 2020 & 2033
- Table 49: North Africa Electronically Scanned Array Radar Market Revenue (billion) Forecast, by Application 2020 & 2033
- Table 50: South Africa Electronically Scanned Array Radar Market Revenue (billion) Forecast, by Application 2020 & 2033
- Table 51: Rest of Middle East & Africa Electronically Scanned Array Radar Market Revenue (billion) Forecast, by Application 2020 & 2033
- Table 52: Global Electronically Scanned Array Radar Market Revenue billion Forecast, by Production Analysis 2020 & 2033
- Table 53: Global Electronically Scanned Array Radar Market Revenue billion Forecast, by Consumption Analysis 2020 & 2033
- Table 54: Global Electronically Scanned Array Radar Market Revenue billion Forecast, by Import Market Analysis (Value & Volume) 2020 & 2033
- Table 55: Global Electronically Scanned Array Radar Market Revenue billion Forecast, by Export Market Analysis (Value & Volume) 2020 & 2033
- Table 56: Global Electronically Scanned Array Radar Market Revenue billion Forecast, by Price Trend Analysis 2020 & 2033
- Table 57: Global Electronically Scanned Array Radar Market Revenue billion Forecast, by Country 2020 & 2033
- Table 58: China Electronically Scanned Array Radar Market Revenue (billion) Forecast, by Application 2020 & 2033
- Table 59: India Electronically Scanned Array Radar Market Revenue (billion) Forecast, by Application 2020 & 2033
- Table 60: Japan Electronically Scanned Array Radar Market Revenue (billion) Forecast, by Application 2020 & 2033
- Table 61: South Korea Electronically Scanned Array Radar Market Revenue (billion) Forecast, by Application 2020 & 2033
- Table 62: ASEAN Electronically Scanned Array Radar Market Revenue (billion) Forecast, by Application 2020 & 2033
- Table 63: Oceania Electronically Scanned Array Radar Market Revenue (billion) Forecast, by Application 2020 & 2033
- Table 64: Rest of Asia Pacific Electronically Scanned Array Radar Market Revenue (billion) Forecast, by Application 2020 & 2033
Frequently Asked Questions
1. What is the projected Compound Annual Growth Rate (CAGR) of the Electronically Scanned Array Radar Market?
The projected CAGR is approximately 9.7%.
2. Which companies are prominent players in the Electronically Scanned Array Radar Market?
Key companies in the market include Raytheon Technologies Corporation, THALES, Leonardo SpA, Lockheed Martin Corporation, Hensoldt AG, RADA Electronic Industries Ltd, Mitsubishi Electric Corporation, Israel Aerospace Industries, ASELSAN A, CEA Technologies, Northrop Grumman Corporation, Saab AB.
3. What are the main segments of the Electronically Scanned Array Radar Market?
The market segments include Production Analysis, Consumption Analysis, Import Market Analysis (Value & Volume), Export Market Analysis (Value & Volume), Price Trend Analysis.
4. Can you provide details about the market size?
The market size is estimated to be USD 12.35 billion as of 2022.
5. What are some drivers contributing to market growth?
; Increasing Number Of Air Passengers; Use Of Portable Electronic Devices.
6. What are the notable trends driving market growth?
Active Electronically Scanned Array Segment to Dominate the Market During the Forecast Period.
7. Are there any restraints impacting market growth?
; High Cost Of Connectivity Equipments.
8. Can you provide examples of recent developments in the market?
In March 2023, The Indian Ministry of Defence (MoD) signed two contracts worth USD448.44m with the government-owned aerospace and defense electronics company Bharat Electronics Limited (BEL) to provide radar and warning receivers for Indian Air Force.
9. What pricing options are available for accessing the report?
Pricing options include single-user, multi-user, and enterprise licenses priced at USD 4750, USD 5250, and USD 8750 respectively.
10. Is the market size provided in terms of value or volume?
The market size is provided in terms of value, measured in billion.
11. Are there any specific market keywords associated with the report?
Yes, the market keyword associated with the report is "Electronically Scanned Array Radar Market," which aids in identifying and referencing the specific market segment covered.
12. How do I determine which pricing option suits my needs best?
The pricing options vary based on user requirements and access needs. Individual users may opt for single-user licenses, while businesses requiring broader access may choose multi-user or enterprise licenses for cost-effective access to the report.
13. Are there any additional resources or data provided in the Electronically Scanned Array Radar Market report?
While the report offers comprehensive insights, it's advisable to review the specific contents or supplementary materials provided to ascertain if additional resources or data are available.
14. How can I stay updated on further developments or reports in the Electronically Scanned Array Radar Market?
To stay informed about further developments, trends, and reports in the Electronically Scanned Array Radar Market, consider subscribing to industry newsletters, following relevant companies and organizations, or regularly checking reputable industry news sources and publications.
Methodology
Step 1 - Identification of Relevant Samples Size from Population Database


Step 2 - Approaches for Defining Global Market Size (Value, Volume* & Price*)

Note*: In applicable scenarios
Step 3 - Data Sources
Primary Research
- Web Analytics
- Survey Reports
- Research Institute
- Latest Research Reports
- Opinion Leaders
Secondary Research
- Annual Reports
- White Paper
- Latest Press Release
- Industry Association
- Paid Database
- Investor Presentations

Step 4 - Data Triangulation
Involves using different sources of information in order to increase the validity of a study
These sources are likely to be stakeholders in a program - participants, other researchers, program staff, other community members, and so on.
Then we put all data in single framework & apply various statistical tools to find out the dynamic on the market.
During the analysis stage, feedback from the stakeholder groups would be compared to determine areas of agreement as well as areas of divergence