

Key Insights
The Low Earth Orbit (LEO) satellite market is experiencing significant expansion, propelled by escalating demand for high-bandwidth communications, sophisticated Earth observation, precise navigation, and expanded space-based scientific research. The market is projected to reach $11.81 billion in 2025 and is anticipated to grow at a compound annual growth rate (CAGR) of 11.9% from 2025 to 2033. Key growth drivers include the burgeoning Internet of Things (IoT) sector, which requires high-throughput LEO communication constellations, and advancements in satellite miniaturization and cost-effective propulsion systems, such as electric propulsion, making LEO deployment more accessible for commercial and government entities. The market is segmented by application (communication, Earth observation, navigation, space observation), satellite mass, and end-user (commercial, military & government). Intense competition among key players like SpaceX, Lockheed Martin, and Airbus, alongside emerging innovators, is fostering a dynamic environment of accelerated innovation and cost reduction.
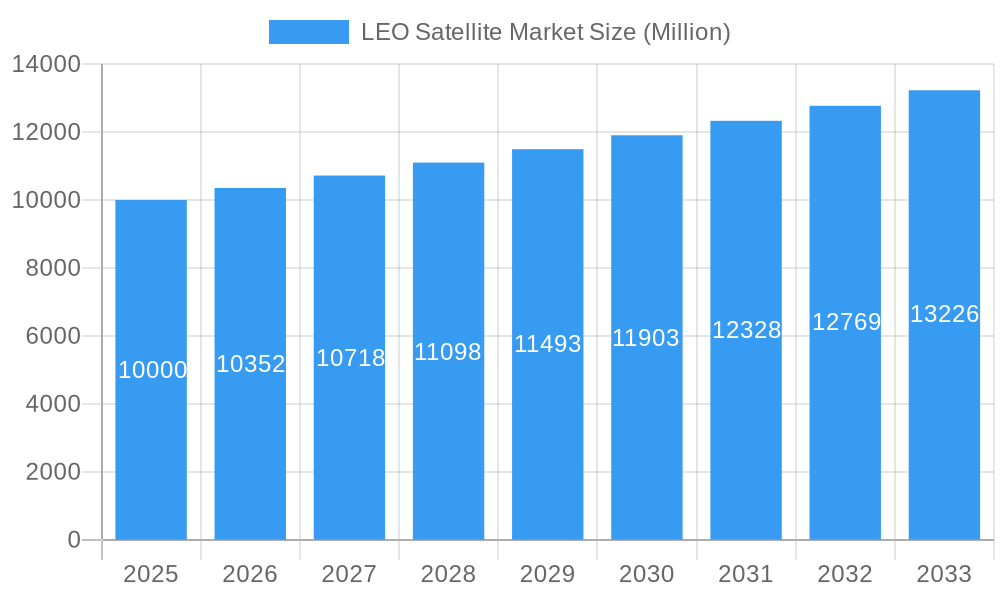
LEO Satellite Market Market Size (In Billion)
The ongoing trend of satellite miniaturization, particularly within the below 10kg and 10-100kg categories, is facilitating the deployment of large constellations that significantly enhance global connectivity and observational capabilities. Increased government investment in space-based surveillance and national security applications further stimulates market growth. Despite these positive trajectories, challenges persist. Regulatory complexities surrounding orbital debris management and spectrum allocation require strategic attention. Furthermore, ongoing research and development are focused on enhancing satellite lifespan and operational reliability in the challenging LEO environment. Nevertheless, the LEO satellite market's long-term prospects remain robust, underpinned by continuous technological evolution and the growing global reliance on space-based services across diverse sectors.
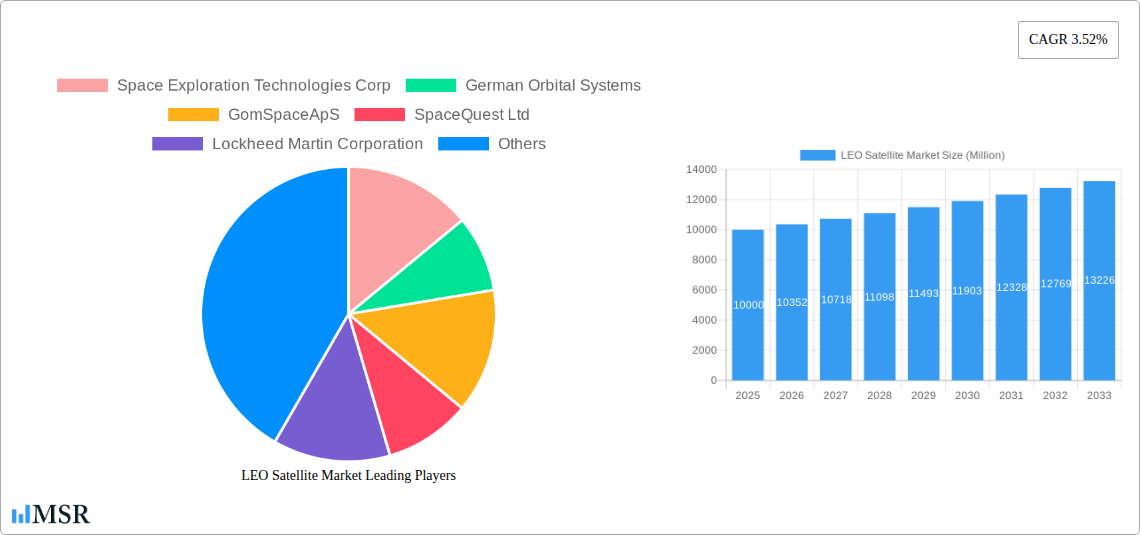
LEO Satellite Market Company Market Share
LEO Satellite Market Report: A Comprehensive Analysis (2019-2033)
This comprehensive report provides an in-depth analysis of the Low Earth Orbit (LEO) Satellite market, offering invaluable insights for industry stakeholders, investors, and strategists. Covering the period 2019-2033, with a focus on 2025, this report delves into market dynamics, key segments, leading players, and future opportunities within this rapidly expanding sector. The report projects a market valued at xx Million by 2033, showcasing significant growth potential.
LEO Satellite Market Concentration & Dynamics
The LEO satellite market exhibits a moderately concentrated landscape, with key players like SpaceX, Airbus, and Lockheed Martin holding significant market share. However, the emergence of numerous smaller, innovative companies, particularly in the nanosatellite segment, is fostering a dynamic and competitive environment. Market concentration is further influenced by ongoing mergers and acquisitions (M&A) activity, with a total of xx M&A deals recorded between 2019 and 2024, signaling significant industry consolidation. Regulatory frameworks, particularly concerning spectrum allocation and orbital debris mitigation, significantly impact market players' strategies. Substitute technologies, such as high-altitude platforms and terrestrial communication networks, exert pressure on certain LEO satellite applications, impacting market share. End-user trends, notably the increasing demand for high-bandwidth communication and precise Earth observation data from both commercial and government sectors, are driving market growth.
- Market Share: SpaceX: xx%, Airbus: xx%, Lockheed Martin: xx%, Others: xx%
- M&A Deal Count (2019-2024): xx
- Key Regulatory Factors: Spectrum allocation policies, orbital debris management regulations.
LEO Satellite Market Industry Insights & Trends
The LEO satellite market is experiencing robust growth, driven by several key factors. The increasing demand for high-speed broadband internet access, particularly in underserved regions, is a major catalyst. The growing adoption of IoT (Internet of Things) devices and the need for real-time data transmission are further propelling market expansion. Technological advancements, such as miniaturization of satellite components and the development of more efficient propulsion systems, are reducing launch costs and improving satellite performance. Furthermore, the decreasing cost of launch services, facilitated by reusable rockets, is making LEO satellite deployments more economically viable. The global market size reached xx Million in 2024, demonstrating a Compound Annual Growth Rate (CAGR) of xx% during the historical period (2019-2024). The market is projected to reach xx Million by 2025 and xx Million by 2033. Evolving consumer behaviors, such as increased reliance on cloud-based services and the demand for high-quality data-driven applications, are contributing to market growth.
Key Markets & Segments Leading LEO Satellite Market
The North American region currently dominates the LEO satellite market, followed by Europe and Asia-Pacific. Within the application segments, communication holds the largest market share, driven by the increasing demand for global broadband connectivity. Earth observation is also experiencing significant growth, fueled by the need for precise and timely data in various sectors, such as agriculture, environmental monitoring, and disaster management.
Dominant Region: North America
Leading Application Segments:
- Communication
- Earth Observation
Key Growth Drivers:
- Increasing demand for high-speed internet access
- Growing adoption of IoT devices
- Technological advancements in satellite technology and launch services.
Satellite Mass Segment Analysis: The 10-100kg segment shows the most significant growth due to cost-effectiveness and ease of deployment. The above 1000kg segment contributes significantly to revenue, but with slower growth due to higher launch costs.
End User Segment Analysis: The commercial sector is the dominant end user, followed by military & government applications. The growth of the commercial sector is driven by private companies offering diverse services in communication, earth observation, and other applications.
Propulsion Technology: Electric propulsion is gaining traction due to its cost-effectiveness and extended operational life.
LEO Satellite Market Product Developments
Recent innovations in LEO satellite technology include advancements in miniaturization, increased payload capacity, and improved communication technologies. The development of CubeSats and other small satellites has lowered the barrier to entry for many companies, increasing competition and fostering innovation. These advancements enhance the versatility and cost-effectiveness of LEO satellite solutions.
Challenges in the LEO Satellite Market
The LEO satellite market faces several challenges, including regulatory hurdles related to spectrum allocation and orbital debris management. Supply chain complexities, particularly regarding the procurement of crucial components, can lead to delays and increased costs. Intense competition among numerous players also presents a significant challenge. These factors may collectively impact market growth by xx% in the forecast period.
Forces Driving LEO Satellite Market Growth
Technological advancements such as miniaturization, improved propulsion systems, and increased payload capacity are key drivers. Government initiatives supporting space exploration and commercialization have spurred significant investments. The increasing demand for high-bandwidth communication and real-time data across various sectors is fostering market expansion.
Long-Term Growth Catalysts in the LEO Satellite Market
Long-term growth is expected to be driven by continued technological innovation, strategic partnerships between satellite manufacturers and service providers, and expansion into new and emerging markets. The potential for mega-constellations and the integration of LEO satellites with other technologies (e.g., AI) present significant opportunities for growth.
Emerging Opportunities in LEO Satellite Market
Emerging opportunities include the expansion of satellite-based IoT networks, the growth of the space tourism industry, and the increased use of LEO satellites for Earth observation and environmental monitoring. New applications in areas such as precision agriculture, disaster relief, and maritime surveillance offer substantial market potential.
Leading Players in the LEO Satellite Market Sector
- Space Exploration Technologies Corp
- German Orbital Systems
- GomSpace ApS
- SpaceQuest Ltd
- Lockheed Martin Corporation
- Airbus SE
- Astrocast
- Nano Avionics
- China Aerospace Science and Technology Corporation (CASC)
- Surrey Satellite Technology Ltd
- ROSCOSMOS
- Planet Labs Inc
Key Milestones in LEO Satellite Market Industry
- January 2022: Planet Labs launches 44 SuperDove satellites on SpaceX's Falcon 9 rocket, demonstrating the increasing capacity for large-scale satellite deployments.
- November 2021: Planet Labs' acquisition of VanderSat for $28 Million expanded its data capabilities, signifying the ongoing consolidation within the Earth observation sector.
- January 2021: Launch of 5 Astrocast satellites for IoT data collection highlights the expanding application of LEO satellites for diverse data services.
Strategic Outlook for LEO Satellite Market
The LEO satellite market presents significant growth potential, driven by technological advancements, increasing demand for data, and supportive government policies. Strategic opportunities exist for companies to leverage these trends by investing in innovative technologies, forming strategic alliances, and expanding into new and emerging markets. The future growth trajectory hinges on successfully navigating regulatory challenges and maintaining efficient and cost-effective satellite operations.
LEO Satellite Market Segmentation
-
1. Application
- 1.1. Communication
- 1.2. Earth Observation
- 1.3. Navigation
- 1.4. Space Observation
- 1.5. Others
-
2. Satellite Mass
- 2.1. 10-100kg
- 2.2. 100-500kg
- 2.3. 500-1000kg
- 2.4. Below 10 Kg
- 2.5. above 1000kg
-
3. End User
- 3.1. Commercial
- 3.2. Military & Government
- 3.3. Other
-
4. Propulsion Tech
- 4.1. Electric
- 4.2. Gas based
- 4.3. Liquid Fuel
LEO Satellite Market Segmentation By Geography
-
1. North America
- 1.1. United States
- 1.2. Canada
- 1.3. Mexico
-
2. South America
- 2.1. Brazil
- 2.2. Argentina
- 2.3. Rest of South America
-
3. Europe
- 3.1. United Kingdom
- 3.2. Germany
- 3.3. France
- 3.4. Italy
- 3.5. Spain
- 3.6. Russia
- 3.7. Benelux
- 3.8. Nordics
- 3.9. Rest of Europe
-
4. Middle East & Africa
- 4.1. Turkey
- 4.2. Israel
- 4.3. GCC
- 4.4. North Africa
- 4.5. South Africa
- 4.6. Rest of Middle East & Africa
-
5. Asia Pacific
- 5.1. China
- 5.2. India
- 5.3. Japan
- 5.4. South Korea
- 5.5. ASEAN
- 5.6. Oceania
- 5.7. Rest of Asia Pacific
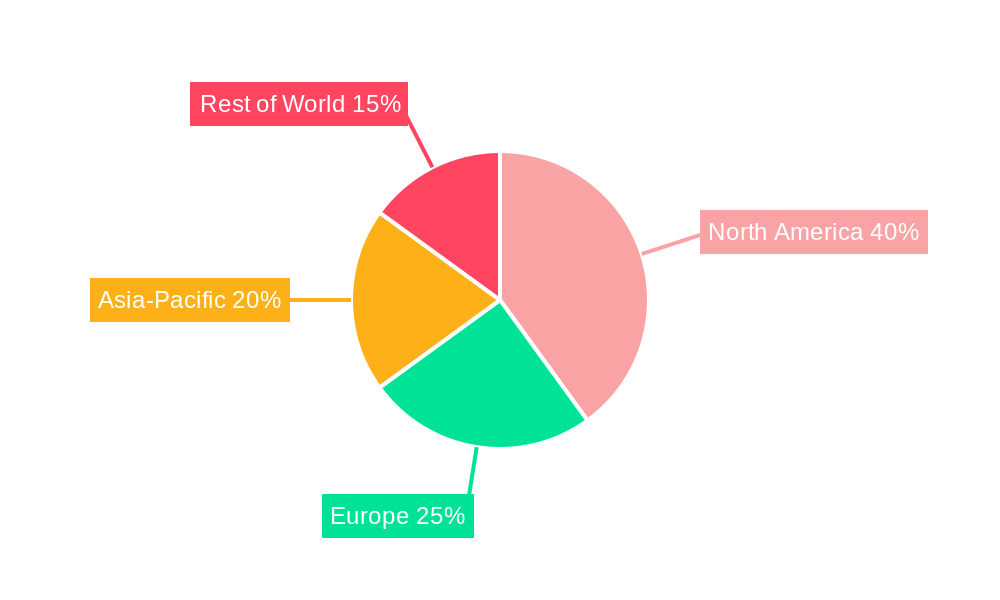
LEO Satellite Market Regional Market Share
Geographic Coverage of LEO Satellite Market
LEO Satellite Market REPORT HIGHLIGHTS
| Aspects | Details |
|---|---|
| Study Period | 2020-2034 |
| Base Year | 2025 |
| Estimated Year | 2026 |
| Forecast Period | 2026-2034 |
| Historical Period | 2020-2025 |
| Growth Rate | CAGR of 11.9% from 2020-2034 |
| Segmentation |
|
Table of Contents
- 1. Introduction
- 1.1. Research Scope
- 1.2. Market Segmentation
- 1.3. Research Objective
- 1.4. Definitions and Assumptions
- 2. Executive Summary
- 2.1. Market Snapshot
- 3. Market Dynamics
- 3.1. Market Drivers
- 3.2. Market Restrains
- 3.3. Market Trends
- 3.4. Market Opportunities
- 4. Market Factor Analysis
- 4.1. Porters Five Forces
- 4.1.1. Bargaining Power of Suppliers
- 4.1.2. Bargaining Power of Buyers
- 4.1.3. Threat of New Entrants
- 4.1.4. Threat of Substitutes
- 4.1.5. Competitive Rivalry
- 4.2. PESTEL analysis
- 4.3. BCG Analysis
- 4.3.1. Stars (High Growth, High Market Share)
- 4.3.2. Cash Cows (Low Growth, High Market Share)
- 4.3.3. Question Mark (High Growth, Low Market Share)
- 4.3.4. Dogs (Low Growth, Low Market Share)
- 4.4. Ansoff Matrix Analysis
- 4.5. Supply Chain Analysis
- 4.6. Regulatory Landscape
- 4.7. Current Market Potential and Opportunity Assessment (TAM–SAM–SOM Framework)
- 4.8. MSR Analyst Note
- 4.1. Porters Five Forces
- 5. Market Analysis, Insights and Forecast 2021-2033
- 5.1. Market Analysis, Insights and Forecast - by Application
- 5.1.1. Communication
- 5.1.2. Earth Observation
- 5.1.3. Navigation
- 5.1.4. Space Observation
- 5.1.5. Others
- 5.2. Market Analysis, Insights and Forecast - by Satellite Mass
- 5.2.1. 10-100kg
- 5.2.2. 100-500kg
- 5.2.3. 500-1000kg
- 5.2.4. Below 10 Kg
- 5.2.5. above 1000kg
- 5.3. Market Analysis, Insights and Forecast - by End User
- 5.3.1. Commercial
- 5.3.2. Military & Government
- 5.3.3. Other
- 5.4. Market Analysis, Insights and Forecast - by Propulsion Tech
- 5.4.1. Electric
- 5.4.2. Gas based
- 5.4.3. Liquid Fuel
- 5.5. Market Analysis, Insights and Forecast - by Region
- 5.5.1. North America
- 5.5.2. South America
- 5.5.3. Europe
- 5.5.4. Middle East & Africa
- 5.5.5. Asia Pacific
- 5.1. Market Analysis, Insights and Forecast - by Application
- 6. Global LEO Satellite Market Analysis, Insights and Forecast, 2021-2033
- 6.1. Market Analysis, Insights and Forecast - by Application
- 6.1.1. Communication
- 6.1.2. Earth Observation
- 6.1.3. Navigation
- 6.1.4. Space Observation
- 6.1.5. Others
- 6.2. Market Analysis, Insights and Forecast - by Satellite Mass
- 6.2.1. 10-100kg
- 6.2.2. 100-500kg
- 6.2.3. 500-1000kg
- 6.2.4. Below 10 Kg
- 6.2.5. above 1000kg
- 6.3. Market Analysis, Insights and Forecast - by End User
- 6.3.1. Commercial
- 6.3.2. Military & Government
- 6.3.3. Other
- 6.4. Market Analysis, Insights and Forecast - by Propulsion Tech
- 6.4.1. Electric
- 6.4.2. Gas based
- 6.4.3. Liquid Fuel
- 6.1. Market Analysis, Insights and Forecast - by Application
- 7. North America LEO Satellite Market Analysis, Insights and Forecast, 2020-2032
- 7.1. Market Analysis, Insights and Forecast - by Application
- 7.1.1. Communication
- 7.1.2. Earth Observation
- 7.1.3. Navigation
- 7.1.4. Space Observation
- 7.1.5. Others
- 7.2. Market Analysis, Insights and Forecast - by Satellite Mass
- 7.2.1. 10-100kg
- 7.2.2. 100-500kg
- 7.2.3. 500-1000kg
- 7.2.4. Below 10 Kg
- 7.2.5. above 1000kg
- 7.3. Market Analysis, Insights and Forecast - by End User
- 7.3.1. Commercial
- 7.3.2. Military & Government
- 7.3.3. Other
- 7.4. Market Analysis, Insights and Forecast - by Propulsion Tech
- 7.4.1. Electric
- 7.4.2. Gas based
- 7.4.3. Liquid Fuel
- 7.1. Market Analysis, Insights and Forecast - by Application
- 8. South America LEO Satellite Market Analysis, Insights and Forecast, 2020-2032
- 8.1. Market Analysis, Insights and Forecast - by Application
- 8.1.1. Communication
- 8.1.2. Earth Observation
- 8.1.3. Navigation
- 8.1.4. Space Observation
- 8.1.5. Others
- 8.2. Market Analysis, Insights and Forecast - by Satellite Mass
- 8.2.1. 10-100kg
- 8.2.2. 100-500kg
- 8.2.3. 500-1000kg
- 8.2.4. Below 10 Kg
- 8.2.5. above 1000kg
- 8.3. Market Analysis, Insights and Forecast - by End User
- 8.3.1. Commercial
- 8.3.2. Military & Government
- 8.3.3. Other
- 8.4. Market Analysis, Insights and Forecast - by Propulsion Tech
- 8.4.1. Electric
- 8.4.2. Gas based
- 8.4.3. Liquid Fuel
- 8.1. Market Analysis, Insights and Forecast - by Application
- 9. Europe LEO Satellite Market Analysis, Insights and Forecast, 2020-2032
- 9.1. Market Analysis, Insights and Forecast - by Application
- 9.1.1. Communication
- 9.1.2. Earth Observation
- 9.1.3. Navigation
- 9.1.4. Space Observation
- 9.1.5. Others
- 9.2. Market Analysis, Insights and Forecast - by Satellite Mass
- 9.2.1. 10-100kg
- 9.2.2. 100-500kg
- 9.2.3. 500-1000kg
- 9.2.4. Below 10 Kg
- 9.2.5. above 1000kg
- 9.3. Market Analysis, Insights and Forecast - by End User
- 9.3.1. Commercial
- 9.3.2. Military & Government
- 9.3.3. Other
- 9.4. Market Analysis, Insights and Forecast - by Propulsion Tech
- 9.4.1. Electric
- 9.4.2. Gas based
- 9.4.3. Liquid Fuel
- 9.1. Market Analysis, Insights and Forecast - by Application
- 10. Middle East & Africa LEO Satellite Market Analysis, Insights and Forecast, 2020-2032
- 10.1. Market Analysis, Insights and Forecast - by Application
- 10.1.1. Communication
- 10.1.2. Earth Observation
- 10.1.3. Navigation
- 10.1.4. Space Observation
- 10.1.5. Others
- 10.2. Market Analysis, Insights and Forecast - by Satellite Mass
- 10.2.1. 10-100kg
- 10.2.2. 100-500kg
- 10.2.3. 500-1000kg
- 10.2.4. Below 10 Kg
- 10.2.5. above 1000kg
- 10.3. Market Analysis, Insights and Forecast - by End User
- 10.3.1. Commercial
- 10.3.2. Military & Government
- 10.3.3. Other
- 10.4. Market Analysis, Insights and Forecast - by Propulsion Tech
- 10.4.1. Electric
- 10.4.2. Gas based
- 10.4.3. Liquid Fuel
- 10.1. Market Analysis, Insights and Forecast - by Application
- 11. Asia Pacific LEO Satellite Market Analysis, Insights and Forecast, 2020-2032
- 11.1. Market Analysis, Insights and Forecast - by Application
- 11.1.1. Communication
- 11.1.2. Earth Observation
- 11.1.3. Navigation
- 11.1.4. Space Observation
- 11.1.5. Others
- 11.2. Market Analysis, Insights and Forecast - by Satellite Mass
- 11.2.1. 10-100kg
- 11.2.2. 100-500kg
- 11.2.3. 500-1000kg
- 11.2.4. Below 10 Kg
- 11.2.5. above 1000kg
- 11.3. Market Analysis, Insights and Forecast - by End User
- 11.3.1. Commercial
- 11.3.2. Military & Government
- 11.3.3. Other
- 11.4. Market Analysis, Insights and Forecast - by Propulsion Tech
- 11.4.1. Electric
- 11.4.2. Gas based
- 11.4.3. Liquid Fuel
- 11.1. Market Analysis, Insights and Forecast - by Application
- 12. Competitive Analysis
- 12.1. Company Profiles
- 12.1.1 Space Exploration Technologies Corp
- 12.1.1.1. Company Overview
- 12.1.1.2. Products
- 12.1.1.3. Company Financials
- 12.1.1.4. SWOT Analysis
- 12.1.2 German Orbital Systems
- 12.1.2.1. Company Overview
- 12.1.2.2. Products
- 12.1.2.3. Company Financials
- 12.1.2.4. SWOT Analysis
- 12.1.3 GomSpaceApS
- 12.1.3.1. Company Overview
- 12.1.3.2. Products
- 12.1.3.3. Company Financials
- 12.1.3.4. SWOT Analysis
- 12.1.4 SpaceQuest Ltd
- 12.1.4.1. Company Overview
- 12.1.4.2. Products
- 12.1.4.3. Company Financials
- 12.1.4.4. SWOT Analysis
- 12.1.5 Lockheed Martin Corporation
- 12.1.5.1. Company Overview
- 12.1.5.2. Products
- 12.1.5.3. Company Financials
- 12.1.5.4. SWOT Analysis
- 12.1.6 Airbus SE
- 12.1.6.1. Company Overview
- 12.1.6.2. Products
- 12.1.6.3. Company Financials
- 12.1.6.4. SWOT Analysis
- 12.1.7 Astrocast
- 12.1.7.1. Company Overview
- 12.1.7.2. Products
- 12.1.7.3. Company Financials
- 12.1.7.4. SWOT Analysis
- 12.1.8 Nano Avionics
- 12.1.8.1. Company Overview
- 12.1.8.2. Products
- 12.1.8.3. Company Financials
- 12.1.8.4. SWOT Analysis
- 12.1.9 China Aerospace Science and Technology Corporation (CASC)
- 12.1.9.1. Company Overview
- 12.1.9.2. Products
- 12.1.9.3. Company Financials
- 12.1.9.4. SWOT Analysis
- 12.1.10 Surrey Satellite Technology Ltd
- 12.1.10.1. Company Overview
- 12.1.10.2. Products
- 12.1.10.3. Company Financials
- 12.1.10.4. SWOT Analysis
- 12.1.11 ROSCOSMOS
- 12.1.11.1. Company Overview
- 12.1.11.2. Products
- 12.1.11.3. Company Financials
- 12.1.11.4. SWOT Analysis
- 12.1.12 Planet Labs Inc
- 12.1.12.1. Company Overview
- 12.1.12.2. Products
- 12.1.12.3. Company Financials
- 12.1.12.4. SWOT Analysis
- 12.1.1 Space Exploration Technologies Corp
- 12.2. Market Entropy
- 12.2.1 Company's Key Areas Served
- 12.2.2 Recent Developments
- 12.3. Company Market Share Analysis 2025
- 12.3.1 Top 5 Companies Market Share Analysis
- 12.3.2 Top 3 Companies Market Share Analysis
- 12.4. List of Potential Customers
- 13. Research Methodology
List of Figures
- Figure 1: Global LEO Satellite Market Revenue Breakdown (billion, %) by Region 2025 & 2033
- Figure 2: North America LEO Satellite Market Revenue (billion), by Application 2025 & 2033
- Figure 3: North America LEO Satellite Market Revenue Share (%), by Application 2025 & 2033
- Figure 4: North America LEO Satellite Market Revenue (billion), by Satellite Mass 2025 & 2033
- Figure 5: North America LEO Satellite Market Revenue Share (%), by Satellite Mass 2025 & 2033
- Figure 6: North America LEO Satellite Market Revenue (billion), by End User 2025 & 2033
- Figure 7: North America LEO Satellite Market Revenue Share (%), by End User 2025 & 2033
- Figure 8: North America LEO Satellite Market Revenue (billion), by Propulsion Tech 2025 & 2033
- Figure 9: North America LEO Satellite Market Revenue Share (%), by Propulsion Tech 2025 & 2033
- Figure 10: North America LEO Satellite Market Revenue (billion), by Country 2025 & 2033
- Figure 11: North America LEO Satellite Market Revenue Share (%), by Country 2025 & 2033
- Figure 12: South America LEO Satellite Market Revenue (billion), by Application 2025 & 2033
- Figure 13: South America LEO Satellite Market Revenue Share (%), by Application 2025 & 2033
- Figure 14: South America LEO Satellite Market Revenue (billion), by Satellite Mass 2025 & 2033
- Figure 15: South America LEO Satellite Market Revenue Share (%), by Satellite Mass 2025 & 2033
- Figure 16: South America LEO Satellite Market Revenue (billion), by End User 2025 & 2033
- Figure 17: South America LEO Satellite Market Revenue Share (%), by End User 2025 & 2033
- Figure 18: South America LEO Satellite Market Revenue (billion), by Propulsion Tech 2025 & 2033
- Figure 19: South America LEO Satellite Market Revenue Share (%), by Propulsion Tech 2025 & 2033
- Figure 20: South America LEO Satellite Market Revenue (billion), by Country 2025 & 2033
- Figure 21: South America LEO Satellite Market Revenue Share (%), by Country 2025 & 2033
- Figure 22: Europe LEO Satellite Market Revenue (billion), by Application 2025 & 2033
- Figure 23: Europe LEO Satellite Market Revenue Share (%), by Application 2025 & 2033
- Figure 24: Europe LEO Satellite Market Revenue (billion), by Satellite Mass 2025 & 2033
- Figure 25: Europe LEO Satellite Market Revenue Share (%), by Satellite Mass 2025 & 2033
- Figure 26: Europe LEO Satellite Market Revenue (billion), by End User 2025 & 2033
- Figure 27: Europe LEO Satellite Market Revenue Share (%), by End User 2025 & 2033
- Figure 28: Europe LEO Satellite Market Revenue (billion), by Propulsion Tech 2025 & 2033
- Figure 29: Europe LEO Satellite Market Revenue Share (%), by Propulsion Tech 2025 & 2033
- Figure 30: Europe LEO Satellite Market Revenue (billion), by Country 2025 & 2033
- Figure 31: Europe LEO Satellite Market Revenue Share (%), by Country 2025 & 2033
- Figure 32: Middle East & Africa LEO Satellite Market Revenue (billion), by Application 2025 & 2033
- Figure 33: Middle East & Africa LEO Satellite Market Revenue Share (%), by Application 2025 & 2033
- Figure 34: Middle East & Africa LEO Satellite Market Revenue (billion), by Satellite Mass 2025 & 2033
- Figure 35: Middle East & Africa LEO Satellite Market Revenue Share (%), by Satellite Mass 2025 & 2033
- Figure 36: Middle East & Africa LEO Satellite Market Revenue (billion), by End User 2025 & 2033
- Figure 37: Middle East & Africa LEO Satellite Market Revenue Share (%), by End User 2025 & 2033
- Figure 38: Middle East & Africa LEO Satellite Market Revenue (billion), by Propulsion Tech 2025 & 2033
- Figure 39: Middle East & Africa LEO Satellite Market Revenue Share (%), by Propulsion Tech 2025 & 2033
- Figure 40: Middle East & Africa LEO Satellite Market Revenue (billion), by Country 2025 & 2033
- Figure 41: Middle East & Africa LEO Satellite Market Revenue Share (%), by Country 2025 & 2033
- Figure 42: Asia Pacific LEO Satellite Market Revenue (billion), by Application 2025 & 2033
- Figure 43: Asia Pacific LEO Satellite Market Revenue Share (%), by Application 2025 & 2033
- Figure 44: Asia Pacific LEO Satellite Market Revenue (billion), by Satellite Mass 2025 & 2033
- Figure 45: Asia Pacific LEO Satellite Market Revenue Share (%), by Satellite Mass 2025 & 2033
- Figure 46: Asia Pacific LEO Satellite Market Revenue (billion), by End User 2025 & 2033
- Figure 47: Asia Pacific LEO Satellite Market Revenue Share (%), by End User 2025 & 2033
- Figure 48: Asia Pacific LEO Satellite Market Revenue (billion), by Propulsion Tech 2025 & 2033
- Figure 49: Asia Pacific LEO Satellite Market Revenue Share (%), by Propulsion Tech 2025 & 2033
- Figure 50: Asia Pacific LEO Satellite Market Revenue (billion), by Country 2025 & 2033
- Figure 51: Asia Pacific LEO Satellite Market Revenue Share (%), by Country 2025 & 2033
List of Tables
- Table 1: Global LEO Satellite Market Revenue billion Forecast, by Application 2020 & 2033
- Table 2: Global LEO Satellite Market Revenue billion Forecast, by Satellite Mass 2020 & 2033
- Table 3: Global LEO Satellite Market Revenue billion Forecast, by End User 2020 & 2033
- Table 4: Global LEO Satellite Market Revenue billion Forecast, by Propulsion Tech 2020 & 2033
- Table 5: Global LEO Satellite Market Revenue billion Forecast, by Region 2020 & 2033
- Table 6: Global LEO Satellite Market Revenue billion Forecast, by Application 2020 & 2033
- Table 7: Global LEO Satellite Market Revenue billion Forecast, by Satellite Mass 2020 & 2033
- Table 8: Global LEO Satellite Market Revenue billion Forecast, by End User 2020 & 2033
- Table 9: Global LEO Satellite Market Revenue billion Forecast, by Propulsion Tech 2020 & 2033
- Table 10: Global LEO Satellite Market Revenue billion Forecast, by Country 2020 & 2033
- Table 11: United States LEO Satellite Market Revenue (billion) Forecast, by Application 2020 & 2033
- Table 12: Canada LEO Satellite Market Revenue (billion) Forecast, by Application 2020 & 2033
- Table 13: Mexico LEO Satellite Market Revenue (billion) Forecast, by Application 2020 & 2033
- Table 14: Global LEO Satellite Market Revenue billion Forecast, by Application 2020 & 2033
- Table 15: Global LEO Satellite Market Revenue billion Forecast, by Satellite Mass 2020 & 2033
- Table 16: Global LEO Satellite Market Revenue billion Forecast, by End User 2020 & 2033
- Table 17: Global LEO Satellite Market Revenue billion Forecast, by Propulsion Tech 2020 & 2033
- Table 18: Global LEO Satellite Market Revenue billion Forecast, by Country 2020 & 2033
- Table 19: Brazil LEO Satellite Market Revenue (billion) Forecast, by Application 2020 & 2033
- Table 20: Argentina LEO Satellite Market Revenue (billion) Forecast, by Application 2020 & 2033
- Table 21: Rest of South America LEO Satellite Market Revenue (billion) Forecast, by Application 2020 & 2033
- Table 22: Global LEO Satellite Market Revenue billion Forecast, by Application 2020 & 2033
- Table 23: Global LEO Satellite Market Revenue billion Forecast, by Satellite Mass 2020 & 2033
- Table 24: Global LEO Satellite Market Revenue billion Forecast, by End User 2020 & 2033
- Table 25: Global LEO Satellite Market Revenue billion Forecast, by Propulsion Tech 2020 & 2033
- Table 26: Global LEO Satellite Market Revenue billion Forecast, by Country 2020 & 2033
- Table 27: United Kingdom LEO Satellite Market Revenue (billion) Forecast, by Application 2020 & 2033
- Table 28: Germany LEO Satellite Market Revenue (billion) Forecast, by Application 2020 & 2033
- Table 29: France LEO Satellite Market Revenue (billion) Forecast, by Application 2020 & 2033
- Table 30: Italy LEO Satellite Market Revenue (billion) Forecast, by Application 2020 & 2033
- Table 31: Spain LEO Satellite Market Revenue (billion) Forecast, by Application 2020 & 2033
- Table 32: Russia LEO Satellite Market Revenue (billion) Forecast, by Application 2020 & 2033
- Table 33: Benelux LEO Satellite Market Revenue (billion) Forecast, by Application 2020 & 2033
- Table 34: Nordics LEO Satellite Market Revenue (billion) Forecast, by Application 2020 & 2033
- Table 35: Rest of Europe LEO Satellite Market Revenue (billion) Forecast, by Application 2020 & 2033
- Table 36: Global LEO Satellite Market Revenue billion Forecast, by Application 2020 & 2033
- Table 37: Global LEO Satellite Market Revenue billion Forecast, by Satellite Mass 2020 & 2033
- Table 38: Global LEO Satellite Market Revenue billion Forecast, by End User 2020 & 2033
- Table 39: Global LEO Satellite Market Revenue billion Forecast, by Propulsion Tech 2020 & 2033
- Table 40: Global LEO Satellite Market Revenue billion Forecast, by Country 2020 & 2033
- Table 41: Turkey LEO Satellite Market Revenue (billion) Forecast, by Application 2020 & 2033
- Table 42: Israel LEO Satellite Market Revenue (billion) Forecast, by Application 2020 & 2033
- Table 43: GCC LEO Satellite Market Revenue (billion) Forecast, by Application 2020 & 2033
- Table 44: North Africa LEO Satellite Market Revenue (billion) Forecast, by Application 2020 & 2033
- Table 45: South Africa LEO Satellite Market Revenue (billion) Forecast, by Application 2020 & 2033
- Table 46: Rest of Middle East & Africa LEO Satellite Market Revenue (billion) Forecast, by Application 2020 & 2033
- Table 47: Global LEO Satellite Market Revenue billion Forecast, by Application 2020 & 2033
- Table 48: Global LEO Satellite Market Revenue billion Forecast, by Satellite Mass 2020 & 2033
- Table 49: Global LEO Satellite Market Revenue billion Forecast, by End User 2020 & 2033
- Table 50: Global LEO Satellite Market Revenue billion Forecast, by Propulsion Tech 2020 & 2033
- Table 51: Global LEO Satellite Market Revenue billion Forecast, by Country 2020 & 2033
- Table 52: China LEO Satellite Market Revenue (billion) Forecast, by Application 2020 & 2033
- Table 53: India LEO Satellite Market Revenue (billion) Forecast, by Application 2020 & 2033
- Table 54: Japan LEO Satellite Market Revenue (billion) Forecast, by Application 2020 & 2033
- Table 55: South Korea LEO Satellite Market Revenue (billion) Forecast, by Application 2020 & 2033
- Table 56: ASEAN LEO Satellite Market Revenue (billion) Forecast, by Application 2020 & 2033
- Table 57: Oceania LEO Satellite Market Revenue (billion) Forecast, by Application 2020 & 2033
- Table 58: Rest of Asia Pacific LEO Satellite Market Revenue (billion) Forecast, by Application 2020 & 2033
Frequently Asked Questions
1. What is the projected Compound Annual Growth Rate (CAGR) of the LEO Satellite Market?
The projected CAGR is approximately 11.9%.
2. Which companies are prominent players in the LEO Satellite Market?
Key companies in the market include Space Exploration Technologies Corp, German Orbital Systems, GomSpaceApS, SpaceQuest Ltd, Lockheed Martin Corporation, Airbus SE, Astrocast, Nano Avionics, China Aerospace Science and Technology Corporation (CASC), Surrey Satellite Technology Ltd, ROSCOSMOS, Planet Labs Inc.
3. What are the main segments of the LEO Satellite Market?
The market segments include Application, Satellite Mass, End User, Propulsion Tech.
4. Can you provide details about the market size?
The market size is estimated to be USD 11.81 billion as of 2022.
5. What are some drivers contributing to market growth?
N/A
6. What are the notable trends driving market growth?
North America is driving the market demand with a market share of 85.4% in 2029.
7. Are there any restraints impacting market growth?
N/A
8. Can you provide examples of recent developments in the market?
January 2022: Planet Labs launches 44 SuperDove satellites on SpaceX's Falcon 9 rocketNovember 2021: Planet Labs announced an agreement to acquire VanderSat, a Dutch company that provides data on Earth surface conditions, like soil moisture and land surface temperature, by combining public satellite data with proprietary algorithms, for about $28 million.January 2021: In January 2021, 5 Astrocast satellites were launched to collect and downlink data from weather buoys, wellhead sensors, pollution monitors, and other remote stations.
9. What pricing options are available for accessing the report?
Pricing options include single-user, multi-user, and enterprise licenses priced at USD 3800, USD 4500, and USD 5800 respectively.
10. Is the market size provided in terms of value or volume?
The market size is provided in terms of value, measured in billion.
11. Are there any specific market keywords associated with the report?
Yes, the market keyword associated with the report is "LEO Satellite Market," which aids in identifying and referencing the specific market segment covered.
12. How do I determine which pricing option suits my needs best?
The pricing options vary based on user requirements and access needs. Individual users may opt for single-user licenses, while businesses requiring broader access may choose multi-user or enterprise licenses for cost-effective access to the report.
13. Are there any additional resources or data provided in the LEO Satellite Market report?
While the report offers comprehensive insights, it's advisable to review the specific contents or supplementary materials provided to ascertain if additional resources or data are available.
14. How can I stay updated on further developments or reports in the LEO Satellite Market?
To stay informed about further developments, trends, and reports in the LEO Satellite Market, consider subscribing to industry newsletters, following relevant companies and organizations, or regularly checking reputable industry news sources and publications.
Methodology
Step 1 - Identification of Relevant Samples Size from Population Database


Step 2 - Approaches for Defining Global Market Size (Value, Volume* & Price*)

Note*: In applicable scenarios
Step 3 - Data Sources
Primary Research
- Web Analytics
- Survey Reports
- Research Institute
- Latest Research Reports
- Opinion Leaders
Secondary Research
- Annual Reports
- White Paper
- Latest Press Release
- Industry Association
- Paid Database
- Investor Presentations

Step 4 - Data Triangulation
Involves using different sources of information in order to increase the validity of a study
These sources are likely to be stakeholders in a program - participants, other researchers, program staff, other community members, and so on.
Then we put all data in single framework & apply various statistical tools to find out the dynamic on the market.
During the analysis stage, feedback from the stakeholder groups would be compared to determine areas of agreement as well as areas of divergence