

Key Insights
The global pressure gauge market, estimated at 1005.69 million in the base year 2025, is projected to grow at a compound annual growth rate (CAGR) of 3.1% from 2025 to 2033. This expansion is primarily attributed to escalating demand across key industries including aerospace & defense, automotive, and healthcare. Technological advancements, particularly the integration of digital pressure gauges offering superior accuracy, reliability, and data connectivity, are significant market drivers. Stringent safety regulations and the critical need for precise pressure measurement in industrial processes further bolster adoption. Despite challenges such as initial investment costs for advanced digital gauges and potential supply chain volatilities, the long-term advantages and the shift towards automated, data-driven solutions are expected to outweigh these constraints. The market is segmented by output type (analog and digital) and application (aerospace & defense, automotive, healthcare, energy, and others). The digital segment is anticipated to experience more rapid growth owing to its advanced capabilities. Geographically, North America and Europe currently lead the market due to robust industrial infrastructure and technological innovation. However, the Asia-Pacific region is poised for substantial growth driven by rapid industrialization and infrastructure development.
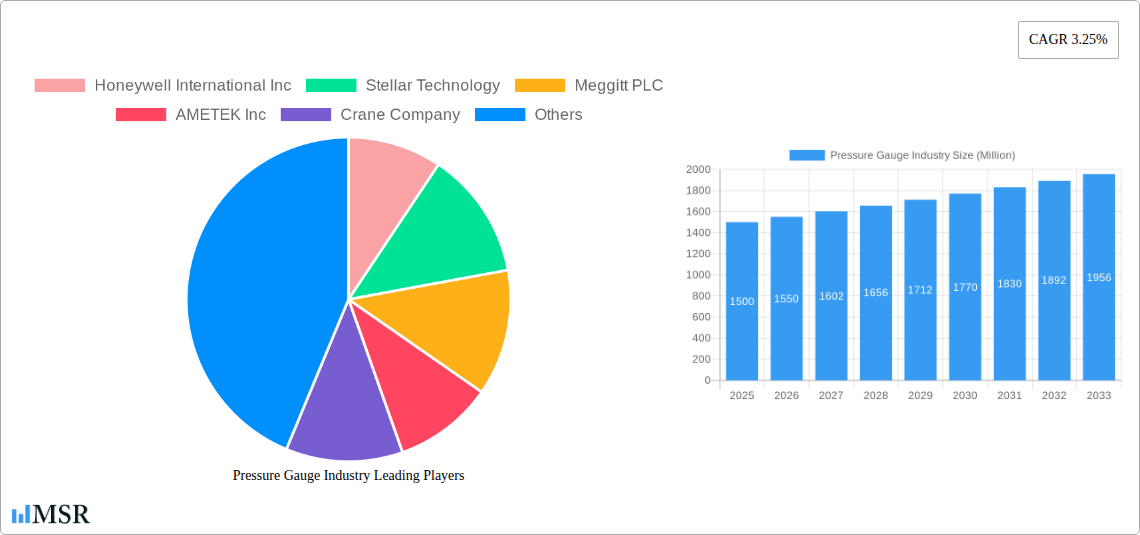
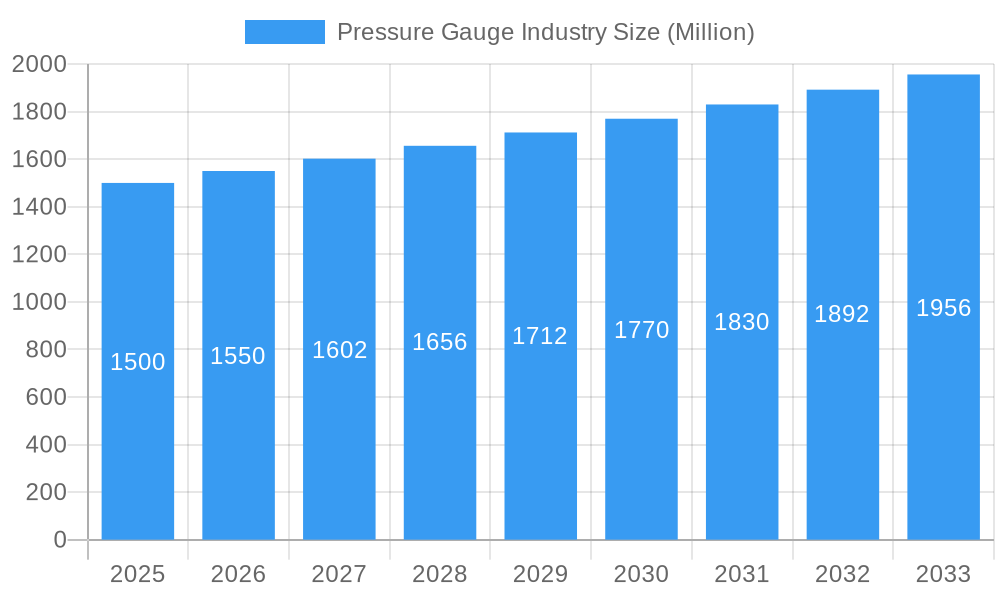
Pressure Gauge Industry Market Size (In Billion)
The competitive landscape features a mix of established industry leaders such as Honeywell International Inc., AMETEK Inc., and Emerson Electric Co., alongside specialized manufacturers. Key strategies employed by these companies include continuous product innovation, strategic collaborations, and geographical expansion. The increasing demand for bespoke solutions and the integration of pressure gauges with advanced sensing technologies are also influencing market dynamics. The forecast period indicates sustained market expansion, fueled by ongoing technological advancements and broader application adoption. While industry participants may encounter specific challenges, the overall market outlook remains optimistic, presenting significant growth prospects. Vigilant observation of technological trends and emerging applications will be paramount for stakeholders aiming to leverage the market's potential.
Pressure Gauge Industry Company Market Share
Pressure Gauge Industry Market Report: 2019-2033 Forecast
This comprehensive report provides a detailed analysis of the global pressure gauge industry, offering invaluable insights for stakeholders, investors, and industry professionals. The study period covers 2019-2033, with a focus on the forecast period 2025-2033, base year 2025, and estimated year 2025. The report delves into market dynamics, key segments (Analog, Digital output types and Aerospace & Defense, Automotive, Healthcare, Energy, and Other Applications), leading players (including Honeywell, AMETEK, and Emerson Electric), and emerging trends, ultimately projecting a xx Million market value by 2033.
Pressure Gauge Industry Market Concentration & Dynamics
The global pressure gauge market exhibits a moderately consolidated structure, with a few major players commanding significant market share. Honeywell International Inc, AMETEK Inc, and Emerson Electric Co are amongst the leading companies, collectively holding an estimated xx% market share in 2025. The industry is characterized by a dynamic innovation ecosystem, with ongoing investments in advanced technologies like wireless pressure sensors and digital displays. Regulatory frameworks, particularly those related to safety and accuracy in specific industries (like aerospace and healthcare), heavily influence market dynamics. Substitute products, such as strain gauges and optical sensors, present competitive challenges, but the established reliability and cost-effectiveness of pressure gauges maintain their dominance across various applications. End-user trends towards automation, digitalization, and remote monitoring are driving demand for sophisticated pressure gauge solutions. M&A activities have been moderately active in recent years, with xx major deals recorded between 2019 and 2024, primarily focused on expanding product portfolios and geographical reach.
- Market Share (2025): Honeywell - xx%, AMETEK - xx%, Emerson Electric - xx%, Others - xx%
- M&A Deal Count (2019-2024): xx
- Key Regulatory Factors: Safety standards (e.g., ISO, IEC), industry-specific regulations (e.g., aviation, medical)
Pressure Gauge Industry Industry Insights & Trends
The global pressure gauge market is projected to witness robust growth, driven by several factors. The market size is estimated at xx Million in 2025 and is expected to reach xx Million by 2033, exhibiting a CAGR of xx%. Key growth drivers include rising industrial automation, increasing demand from the automotive and aerospace sectors, expanding healthcare infrastructure, and the growth of renewable energy sources. Technological disruptions, particularly in sensor technology and wireless communication, are leading to the development of more precise, reliable, and intelligent pressure gauges. Consumer behavior is shifting towards preference for digital and smart pressure gauges offering remote monitoring and data logging capabilities. The demand for these advanced functionalities is bolstering the market's expansion.
Key Markets & Segments Leading Pressure Gauge Industry
The North American region currently dominates the pressure gauge market, driven by robust industrial activities, advancements in aerospace & defense, and strong demand across various sectors. However, the Asia-Pacific region is projected to experience faster growth in the coming years, fueled by rapid industrialization and infrastructure development in countries like China and India.
Dominant Segments:
- Output Type: Digital pressure gauges are gaining traction over their analog counterparts due to advantages in accuracy, data logging, and integration with automation systems.
- Application: The aerospace and defense sector represents a significant market segment due to the critical role pressure gauges play in flight control and safety systems. The automotive industry also constitutes a sizeable market, driven by advancements in vehicle safety systems and emission control technologies.
Drivers:
- North America: Strong industrial base, advanced technological adoption, high disposable income.
- Asia-Pacific: Rapid industrialization, infrastructure development, increasing investments in renewable energy.
- Europe: Stringent environmental regulations, focus on energy efficiency, growing automation across industries.
Pressure Gauge Industry Product Developments
Recent years have witnessed significant advancements in pressure gauge technology. The introduction of wireless and digital pressure gauges offering improved accuracy, remote monitoring capabilities, and enhanced user interfaces significantly impacts market dynamics. Manufacturers are focusing on integrating advanced features such as data logging, real-time monitoring, and connectivity to industrial automation systems. This is driving the adoption of smart pressure gauges across various industries.
Challenges in the Pressure Gauge Industry Market
The pressure gauge industry faces several challenges including fluctuating raw material prices impacting manufacturing costs, intense competition from both established players and new entrants, and potential supply chain disruptions. Furthermore, stringent regulatory compliance requirements in certain sectors increase the cost of production and certification. The industry also faces the challenge of managing obsolescence, given the rapid technological advancements in the field.
Forces Driving Pressure Gauge Industry Growth
Several factors contribute to the growth of the pressure gauge industry, including the ongoing expansion of industrial automation, rising demand for precise pressure measurement across diverse industries, and technological advancements leading to improved accuracy and reliability. Stringent safety regulations in specific sectors, such as aerospace and healthcare, necessitate high-quality pressure gauges, thereby stimulating market growth. Furthermore, increasing investments in infrastructure development and renewable energy projects are creating new opportunities for pressure gauge deployment.
Long-Term Growth Catalysts in the Pressure Gauge Industry
Long-term growth catalysts include ongoing technological innovations in sensor technology, the development of miniaturized and highly accurate pressure sensors, and strategic partnerships between manufacturers and end-users to develop customized solutions. Expansion into emerging markets with growing industrialization and infrastructure development also presents a significant opportunity for future growth.
Emerging Opportunities in Pressure Gauge Industry
The pressure gauge industry is poised for growth through the integration of advanced technologies such as IoT, AI, and cloud computing to create smart pressure gauge solutions. New applications in sectors like IoT-enabled smart homes and smart cities are emerging, presenting significant opportunities for market expansion. The increasing adoption of Industry 4.0 is creating demand for pressure measurement solutions that can be integrated seamlessly with industrial automation systems.
Leading Players in the Pressure Gauge Industry Sector
- Honeywell International Inc
- Stellar Technology
- Meggitt PLC
- AMETEK Inc
- Crane Company
- Tavis Corporation
- Industrial Quick Search Inc
- Emerson Electric Co
- CIRCORS Aerospace
- Newbow Aerospace Ltd
- WINTERS INSTRUMENTS
Key Milestones in Pressure Gauge Industry Industry
- December 2022: OMEGA launched the DPG509 digital pressure gauge series, featuring a user-friendly interface and high accuracy (0.08%). This launch signifies advancements in user experience and precision within the digital pressure gauge segment.
- October 2022: Parker Meggitt introduced iPRESS, a long-range wireless tire pressure gauge for aviation, improving safety and maintenance efficiency for aircraft. This highlights the increasing integration of wireless technology in specialized applications.
Strategic Outlook for Pressure Gauge Industry Market
The pressure gauge industry is projected to experience sustained growth driven by technological innovations, expanding applications across diverse sectors, and rising demand for precision measurement in industrial settings. Strategic partnerships, investments in R&D, and a focus on developing smart, connected solutions will be key factors driving future market success. The industry's future rests on adaptability, innovation, and the ability to meet the evolving needs of a technologically advanced world.
Pressure Gauge Industry Segmentation
-
1. Output Type
- 1.1. Analog
- 1.2. Digital
-
2. Application
- 2.1. Aerospace and Defense
- 2.2. Automotive
- 2.3. Healthcare
- 2.4. Energy
- 2.5. Other Applications
Pressure Gauge Industry Segmentation By Geography
-
1. North America
- 1.1. United States
- 1.2. Canada
-
2. Europe
- 2.1. United Kingdom
- 2.2. Germany
- 2.3. France
- 2.4. Rest of Europe
-
3. Asia Pacific
- 3.1. China
- 3.2. India
- 3.3. Japan
- 3.4. Rest of Asia Pacific
-
4. Latin America
- 4.1. Brazil
- 4.2. Rest of Latin America
- 5. Middle East
-
6. Saudi Arabia
- 6.1. United Arab Emirates
- 6.2. Turkey
- 6.3. Rest of Middle East
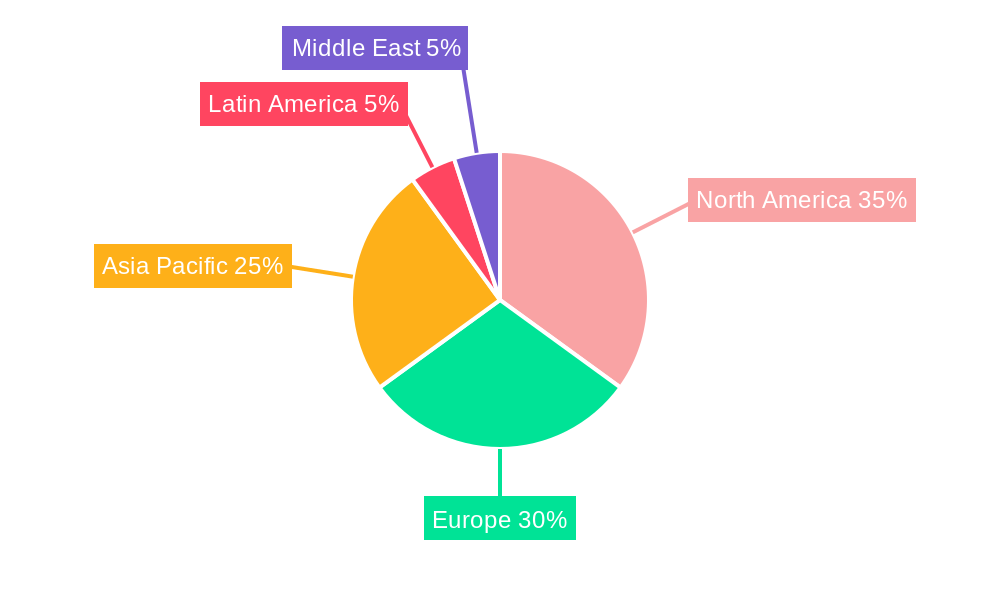
Pressure Gauge Industry Regional Market Share
Geographic Coverage of Pressure Gauge Industry
Pressure Gauge Industry REPORT HIGHLIGHTS
| Aspects | Details |
|---|---|
| Study Period | 2020-2034 |
| Base Year | 2025 |
| Estimated Year | 2026 |
| Forecast Period | 2026-2034 |
| Historical Period | 2020-2025 |
| Growth Rate | CAGR of 3.1% from 2020-2034 |
| Segmentation |
|
Table of Contents
- 1. Introduction
- 1.1. Research Scope
- 1.2. Market Segmentation
- 1.3. Research Objective
- 1.4. Definitions and Assumptions
- 2. Executive Summary
- 2.1. Market Snapshot
- 3. Market Dynamics
- 3.1. Market Drivers
- 3.2. Market Restrains
- 3.3. Market Trends
- 3.4. Market Opportunities
- 4. Market Factor Analysis
- 4.1. Porters Five Forces
- 4.1.1. Bargaining Power of Suppliers
- 4.1.2. Bargaining Power of Buyers
- 4.1.3. Threat of New Entrants
- 4.1.4. Threat of Substitutes
- 4.1.5. Competitive Rivalry
- 4.2. PESTEL analysis
- 4.3. BCG Analysis
- 4.3.1. Stars (High Growth, High Market Share)
- 4.3.2. Cash Cows (Low Growth, High Market Share)
- 4.3.3. Question Mark (High Growth, Low Market Share)
- 4.3.4. Dogs (Low Growth, Low Market Share)
- 4.4. Ansoff Matrix Analysis
- 4.5. Supply Chain Analysis
- 4.6. Regulatory Landscape
- 4.7. Current Market Potential and Opportunity Assessment (TAM–SAM–SOM Framework)
- 4.8. MSR Analyst Note
- 4.1. Porters Five Forces
- 5. Market Analysis, Insights and Forecast 2021-2033
- 5.1. Market Analysis, Insights and Forecast - by Output Type
- 5.1.1. Analog
- 5.1.2. Digital
- 5.2. Market Analysis, Insights and Forecast - by Application
- 5.2.1. Aerospace and Defense
- 5.2.2. Automotive
- 5.2.3. Healthcare
- 5.2.4. Energy
- 5.2.5. Other Applications
- 5.3. Market Analysis, Insights and Forecast - by Region
- 5.3.1. North America
- 5.3.2. Europe
- 5.3.3. Asia Pacific
- 5.3.4. Latin America
- 5.3.5. Middle East
- 5.3.6. Saudi Arabia
- 5.1. Market Analysis, Insights and Forecast - by Output Type
- 6. Global Pressure Gauge Industry Analysis, Insights and Forecast, 2021-2033
- 6.1. Market Analysis, Insights and Forecast - by Output Type
- 6.1.1. Analog
- 6.1.2. Digital
- 6.2. Market Analysis, Insights and Forecast - by Application
- 6.2.1. Aerospace and Defense
- 6.2.2. Automotive
- 6.2.3. Healthcare
- 6.2.4. Energy
- 6.2.5. Other Applications
- 6.1. Market Analysis, Insights and Forecast - by Output Type
- 7. North America Pressure Gauge Industry Analysis, Insights and Forecast, 2020-2032
- 7.1. Market Analysis, Insights and Forecast - by Output Type
- 7.1.1. Analog
- 7.1.2. Digital
- 7.2. Market Analysis, Insights and Forecast - by Application
- 7.2.1. Aerospace and Defense
- 7.2.2. Automotive
- 7.2.3. Healthcare
- 7.2.4. Energy
- 7.2.5. Other Applications
- 7.1. Market Analysis, Insights and Forecast - by Output Type
- 8. Europe Pressure Gauge Industry Analysis, Insights and Forecast, 2020-2032
- 8.1. Market Analysis, Insights and Forecast - by Output Type
- 8.1.1. Analog
- 8.1.2. Digital
- 8.2. Market Analysis, Insights and Forecast - by Application
- 8.2.1. Aerospace and Defense
- 8.2.2. Automotive
- 8.2.3. Healthcare
- 8.2.4. Energy
- 8.2.5. Other Applications
- 8.1. Market Analysis, Insights and Forecast - by Output Type
- 9. Asia Pacific Pressure Gauge Industry Analysis, Insights and Forecast, 2020-2032
- 9.1. Market Analysis, Insights and Forecast - by Output Type
- 9.1.1. Analog
- 9.1.2. Digital
- 9.2. Market Analysis, Insights and Forecast - by Application
- 9.2.1. Aerospace and Defense
- 9.2.2. Automotive
- 9.2.3. Healthcare
- 9.2.4. Energy
- 9.2.5. Other Applications
- 9.1. Market Analysis, Insights and Forecast - by Output Type
- 10. Latin America Pressure Gauge Industry Analysis, Insights and Forecast, 2020-2032
- 10.1. Market Analysis, Insights and Forecast - by Output Type
- 10.1.1. Analog
- 10.1.2. Digital
- 10.2. Market Analysis, Insights and Forecast - by Application
- 10.2.1. Aerospace and Defense
- 10.2.2. Automotive
- 10.2.3. Healthcare
- 10.2.4. Energy
- 10.2.5. Other Applications
- 10.1. Market Analysis, Insights and Forecast - by Output Type
- 11. Middle East Pressure Gauge Industry Analysis, Insights and Forecast, 2020-2032
- 11.1. Market Analysis, Insights and Forecast - by Output Type
- 11.1.1. Analog
- 11.1.2. Digital
- 11.2. Market Analysis, Insights and Forecast - by Application
- 11.2.1. Aerospace and Defense
- 11.2.2. Automotive
- 11.2.3. Healthcare
- 11.2.4. Energy
- 11.2.5. Other Applications
- 11.1. Market Analysis, Insights and Forecast - by Output Type
- 12. Saudi Arabia Pressure Gauge Industry Analysis, Insights and Forecast, 2020-2032
- 12.1. Market Analysis, Insights and Forecast - by Output Type
- 12.1.1. Analog
- 12.1.2. Digital
- 12.2. Market Analysis, Insights and Forecast - by Application
- 12.2.1. Aerospace and Defense
- 12.2.2. Automotive
- 12.2.3. Healthcare
- 12.2.4. Energy
- 12.2.5. Other Applications
- 12.1. Market Analysis, Insights and Forecast - by Output Type
- 13. Competitive Analysis
- 13.1. Company Profiles
- 13.1.1 Honeywell International Inc
- 13.1.1.1. Company Overview
- 13.1.1.2. Products
- 13.1.1.3. Company Financials
- 13.1.1.4. SWOT Analysis
- 13.1.2 Stellar Technology
- 13.1.2.1. Company Overview
- 13.1.2.2. Products
- 13.1.2.3. Company Financials
- 13.1.2.4. SWOT Analysis
- 13.1.3 Meggitt PLC
- 13.1.3.1. Company Overview
- 13.1.3.2. Products
- 13.1.3.3. Company Financials
- 13.1.3.4. SWOT Analysis
- 13.1.4 AMETEK Inc
- 13.1.4.1. Company Overview
- 13.1.4.2. Products
- 13.1.4.3. Company Financials
- 13.1.4.4. SWOT Analysis
- 13.1.5 Crane Company
- 13.1.5.1. Company Overview
- 13.1.5.2. Products
- 13.1.5.3. Company Financials
- 13.1.5.4. SWOT Analysis
- 13.1.6 Tavis Corporation
- 13.1.6.1. Company Overview
- 13.1.6.2. Products
- 13.1.6.3. Company Financials
- 13.1.6.4. SWOT Analysis
- 13.1.7 Industrial Quick Search Inc
- 13.1.7.1. Company Overview
- 13.1.7.2. Products
- 13.1.7.3. Company Financials
- 13.1.7.4. SWOT Analysis
- 13.1.8 Emerson Electric Co
- 13.1.8.1. Company Overview
- 13.1.8.2. Products
- 13.1.8.3. Company Financials
- 13.1.8.4. SWOT Analysis
- 13.1.9 CIRCOR Aerospace
- 13.1.9.1. Company Overview
- 13.1.9.2. Products
- 13.1.9.3. Company Financials
- 13.1.9.4. SWOT Analysis
- 13.1.10 Newbow Aerospace Ltd
- 13.1.10.1. Company Overview
- 13.1.10.2. Products
- 13.1.10.3. Company Financials
- 13.1.10.4. SWOT Analysis
- 13.1.11 WINTERS INSTRUMENTS
- 13.1.11.1. Company Overview
- 13.1.11.2. Products
- 13.1.11.3. Company Financials
- 13.1.11.4. SWOT Analysis
- 13.1.1 Honeywell International Inc
- 13.2. Market Entropy
- 13.2.1 Company's Key Areas Served
- 13.2.2 Recent Developments
- 13.3. Company Market Share Analysis 2025
- 13.3.1 Top 5 Companies Market Share Analysis
- 13.3.2 Top 3 Companies Market Share Analysis
- 13.4. List of Potential Customers
- 14. Research Methodology
List of Figures
- Figure 1: Global Pressure Gauge Industry Revenue Breakdown (million, %) by Region 2025 & 2033
- Figure 2: North America Pressure Gauge Industry Revenue (million), by Output Type 2025 & 2033
- Figure 3: North America Pressure Gauge Industry Revenue Share (%), by Output Type 2025 & 2033
- Figure 4: North America Pressure Gauge Industry Revenue (million), by Application 2025 & 2033
- Figure 5: North America Pressure Gauge Industry Revenue Share (%), by Application 2025 & 2033
- Figure 6: North America Pressure Gauge Industry Revenue (million), by Country 2025 & 2033
- Figure 7: North America Pressure Gauge Industry Revenue Share (%), by Country 2025 & 2033
- Figure 8: Europe Pressure Gauge Industry Revenue (million), by Output Type 2025 & 2033
- Figure 9: Europe Pressure Gauge Industry Revenue Share (%), by Output Type 2025 & 2033
- Figure 10: Europe Pressure Gauge Industry Revenue (million), by Application 2025 & 2033
- Figure 11: Europe Pressure Gauge Industry Revenue Share (%), by Application 2025 & 2033
- Figure 12: Europe Pressure Gauge Industry Revenue (million), by Country 2025 & 2033
- Figure 13: Europe Pressure Gauge Industry Revenue Share (%), by Country 2025 & 2033
- Figure 14: Asia Pacific Pressure Gauge Industry Revenue (million), by Output Type 2025 & 2033
- Figure 15: Asia Pacific Pressure Gauge Industry Revenue Share (%), by Output Type 2025 & 2033
- Figure 16: Asia Pacific Pressure Gauge Industry Revenue (million), by Application 2025 & 2033
- Figure 17: Asia Pacific Pressure Gauge Industry Revenue Share (%), by Application 2025 & 2033
- Figure 18: Asia Pacific Pressure Gauge Industry Revenue (million), by Country 2025 & 2033
- Figure 19: Asia Pacific Pressure Gauge Industry Revenue Share (%), by Country 2025 & 2033
- Figure 20: Latin America Pressure Gauge Industry Revenue (million), by Output Type 2025 & 2033
- Figure 21: Latin America Pressure Gauge Industry Revenue Share (%), by Output Type 2025 & 2033
- Figure 22: Latin America Pressure Gauge Industry Revenue (million), by Application 2025 & 2033
- Figure 23: Latin America Pressure Gauge Industry Revenue Share (%), by Application 2025 & 2033
- Figure 24: Latin America Pressure Gauge Industry Revenue (million), by Country 2025 & 2033
- Figure 25: Latin America Pressure Gauge Industry Revenue Share (%), by Country 2025 & 2033
- Figure 26: Middle East Pressure Gauge Industry Revenue (million), by Output Type 2025 & 2033
- Figure 27: Middle East Pressure Gauge Industry Revenue Share (%), by Output Type 2025 & 2033
- Figure 28: Middle East Pressure Gauge Industry Revenue (million), by Application 2025 & 2033
- Figure 29: Middle East Pressure Gauge Industry Revenue Share (%), by Application 2025 & 2033
- Figure 30: Middle East Pressure Gauge Industry Revenue (million), by Country 2025 & 2033
- Figure 31: Middle East Pressure Gauge Industry Revenue Share (%), by Country 2025 & 2033
- Figure 32: Saudi Arabia Pressure Gauge Industry Revenue (million), by Output Type 2025 & 2033
- Figure 33: Saudi Arabia Pressure Gauge Industry Revenue Share (%), by Output Type 2025 & 2033
- Figure 34: Saudi Arabia Pressure Gauge Industry Revenue (million), by Application 2025 & 2033
- Figure 35: Saudi Arabia Pressure Gauge Industry Revenue Share (%), by Application 2025 & 2033
- Figure 36: Saudi Arabia Pressure Gauge Industry Revenue (million), by Country 2025 & 2033
- Figure 37: Saudi Arabia Pressure Gauge Industry Revenue Share (%), by Country 2025 & 2033
List of Tables
- Table 1: Global Pressure Gauge Industry Revenue million Forecast, by Output Type 2020 & 2033
- Table 2: Global Pressure Gauge Industry Revenue million Forecast, by Application 2020 & 2033
- Table 3: Global Pressure Gauge Industry Revenue million Forecast, by Region 2020 & 2033
- Table 4: Global Pressure Gauge Industry Revenue million Forecast, by Output Type 2020 & 2033
- Table 5: Global Pressure Gauge Industry Revenue million Forecast, by Application 2020 & 2033
- Table 6: Global Pressure Gauge Industry Revenue million Forecast, by Country 2020 & 2033
- Table 7: United States Pressure Gauge Industry Revenue (million) Forecast, by Application 2020 & 2033
- Table 8: Canada Pressure Gauge Industry Revenue (million) Forecast, by Application 2020 & 2033
- Table 9: Global Pressure Gauge Industry Revenue million Forecast, by Output Type 2020 & 2033
- Table 10: Global Pressure Gauge Industry Revenue million Forecast, by Application 2020 & 2033
- Table 11: Global Pressure Gauge Industry Revenue million Forecast, by Country 2020 & 2033
- Table 12: United Kingdom Pressure Gauge Industry Revenue (million) Forecast, by Application 2020 & 2033
- Table 13: Germany Pressure Gauge Industry Revenue (million) Forecast, by Application 2020 & 2033
- Table 14: France Pressure Gauge Industry Revenue (million) Forecast, by Application 2020 & 2033
- Table 15: Rest of Europe Pressure Gauge Industry Revenue (million) Forecast, by Application 2020 & 2033
- Table 16: Global Pressure Gauge Industry Revenue million Forecast, by Output Type 2020 & 2033
- Table 17: Global Pressure Gauge Industry Revenue million Forecast, by Application 2020 & 2033
- Table 18: Global Pressure Gauge Industry Revenue million Forecast, by Country 2020 & 2033
- Table 19: China Pressure Gauge Industry Revenue (million) Forecast, by Application 2020 & 2033
- Table 20: India Pressure Gauge Industry Revenue (million) Forecast, by Application 2020 & 2033
- Table 21: Japan Pressure Gauge Industry Revenue (million) Forecast, by Application 2020 & 2033
- Table 22: Rest of Asia Pacific Pressure Gauge Industry Revenue (million) Forecast, by Application 2020 & 2033
- Table 23: Global Pressure Gauge Industry Revenue million Forecast, by Output Type 2020 & 2033
- Table 24: Global Pressure Gauge Industry Revenue million Forecast, by Application 2020 & 2033
- Table 25: Global Pressure Gauge Industry Revenue million Forecast, by Country 2020 & 2033
- Table 26: Brazil Pressure Gauge Industry Revenue (million) Forecast, by Application 2020 & 2033
- Table 27: Rest of Latin America Pressure Gauge Industry Revenue (million) Forecast, by Application 2020 & 2033
- Table 28: Global Pressure Gauge Industry Revenue million Forecast, by Output Type 2020 & 2033
- Table 29: Global Pressure Gauge Industry Revenue million Forecast, by Application 2020 & 2033
- Table 30: Global Pressure Gauge Industry Revenue million Forecast, by Country 2020 & 2033
- Table 31: Global Pressure Gauge Industry Revenue million Forecast, by Output Type 2020 & 2033
- Table 32: Global Pressure Gauge Industry Revenue million Forecast, by Application 2020 & 2033
- Table 33: Global Pressure Gauge Industry Revenue million Forecast, by Country 2020 & 2033
- Table 34: United Arab Emirates Pressure Gauge Industry Revenue (million) Forecast, by Application 2020 & 2033
- Table 35: Turkey Pressure Gauge Industry Revenue (million) Forecast, by Application 2020 & 2033
- Table 36: Rest of Middle East Pressure Gauge Industry Revenue (million) Forecast, by Application 2020 & 2033
Frequently Asked Questions
1. What is the projected Compound Annual Growth Rate (CAGR) of the Pressure Gauge Industry?
The projected CAGR is approximately 3.1%.
2. Which companies are prominent players in the Pressure Gauge Industry?
Key companies in the market include Honeywell International Inc, Stellar Technology, Meggitt PLC, AMETEK Inc, Crane Company, Tavis Corporation, Industrial Quick Search Inc, Emerson Electric Co, CIRCOR Aerospace, Newbow Aerospace Ltd, WINTERS INSTRUMENTS.
3. What are the main segments of the Pressure Gauge Industry?
The market segments include Output Type, Application.
4. Can you provide details about the market size?
The market size is estimated to be USD 1005.69 million as of 2022.
5. What are some drivers contributing to market growth?
N/A
6. What are the notable trends driving market growth?
Healthcare Segment is Projected to Show the Highest Growth During the Forecast Period.
7. Are there any restraints impacting market growth?
N/A
8. Can you provide examples of recent developments in the market?
In December 2022, OMEGA announced the launch of DPG509, OMEGA's newest series of digital pressure gauges, an advanced product designed with maximum functionality. The new DPG509 features a user-friendly interface with four buttons and a large 4-digit backlit display. The full-scale accuracy the product offers is as high as 0.08%.
9. What pricing options are available for accessing the report?
Pricing options include single-user, multi-user, and enterprise licenses priced at USD 4750, USD 5250, and USD 8750 respectively.
10. Is the market size provided in terms of value or volume?
The market size is provided in terms of value, measured in million.
11. Are there any specific market keywords associated with the report?
Yes, the market keyword associated with the report is "Pressure Gauge Industry," which aids in identifying and referencing the specific market segment covered.
12. How do I determine which pricing option suits my needs best?
The pricing options vary based on user requirements and access needs. Individual users may opt for single-user licenses, while businesses requiring broader access may choose multi-user or enterprise licenses for cost-effective access to the report.
13. Are there any additional resources or data provided in the Pressure Gauge Industry report?
While the report offers comprehensive insights, it's advisable to review the specific contents or supplementary materials provided to ascertain if additional resources or data are available.
14. How can I stay updated on further developments or reports in the Pressure Gauge Industry?
To stay informed about further developments, trends, and reports in the Pressure Gauge Industry, consider subscribing to industry newsletters, following relevant companies and organizations, or regularly checking reputable industry news sources and publications.
Methodology
Step 1 - Identification of Relevant Samples Size from Population Database


Step 2 - Approaches for Defining Global Market Size (Value, Volume* & Price*)

Note*: In applicable scenarios
Step 3 - Data Sources
Primary Research
- Web Analytics
- Survey Reports
- Research Institute
- Latest Research Reports
- Opinion Leaders
Secondary Research
- Annual Reports
- White Paper
- Latest Press Release
- Industry Association
- Paid Database
- Investor Presentations

Step 4 - Data Triangulation
Involves using different sources of information in order to increase the validity of a study
These sources are likely to be stakeholders in a program - participants, other researchers, program staff, other community members, and so on.
Then we put all data in single framework & apply various statistical tools to find out the dynamic on the market.
During the analysis stage, feedback from the stakeholder groups would be compared to determine areas of agreement as well as areas of divergence