

Key Insights
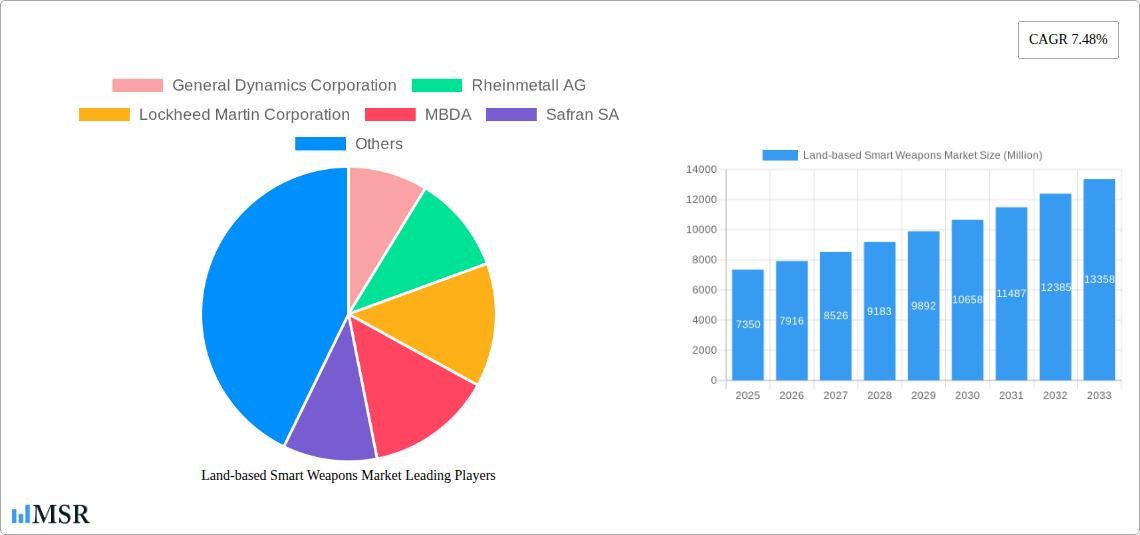
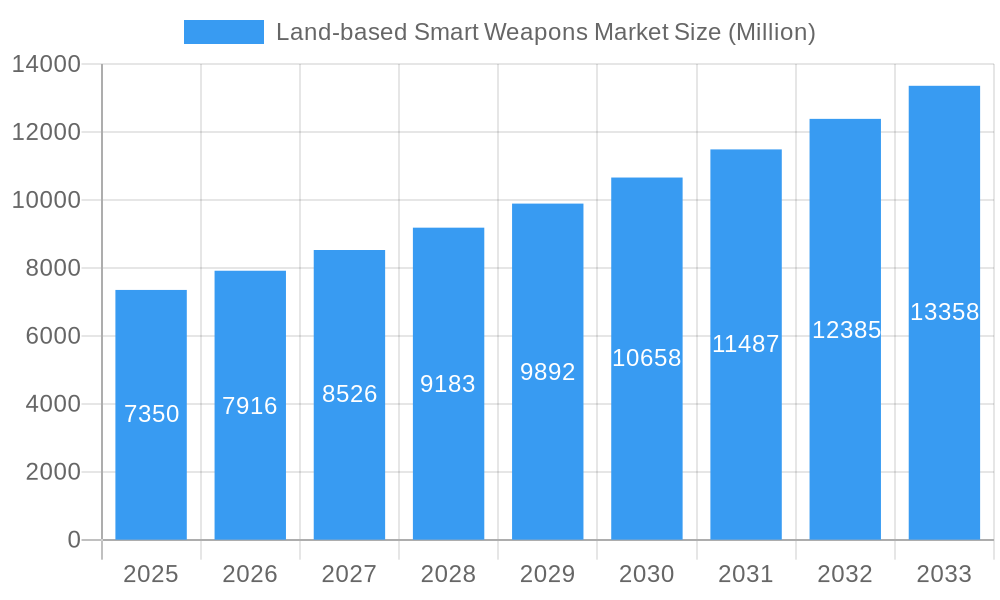
The land-based smart weapons market, valued at $7.35 billion in 2025, is projected to experience robust growth, driven by escalating geopolitical tensions, modernization of armed forces globally, and increasing demand for precision-guided munitions. A Compound Annual Growth Rate (CAGR) of 7.48% from 2025 to 2033 indicates a significant expansion of the market, reaching an estimated value exceeding $15 billion by 2033. Key drivers include the growing adoption of advanced guidance technologies like satellite, radar, infrared, and laser guidance systems, enhancing the accuracy and effectiveness of these weapons. Furthermore, continuous technological advancements leading to smaller, lighter, and more adaptable smart weapons are fueling market growth. While potential restraints such as stringent regulatory frameworks and high development costs exist, the overriding demand for enhanced battlefield capabilities and the imperative for minimizing civilian casualties will likely outweigh these challenges. Segment analysis reveals that missiles constitute a substantial portion of the market, followed by ammunition and other supporting products. Geographically, North America and Europe currently dominate the market due to high defense spending and technological advancements, but the Asia-Pacific region is anticipated to witness significant growth driven by increasing defense budgets and modernization efforts in countries like China and India.
Land-based Smart Weapons Market Market Size (In Billion)
The market segmentation highlights a strong preference for technologically advanced guidance systems. Satellite guidance systems, offering long-range precision, are likely to see considerable demand, coupled with the continued development and adoption of radar and infrared guidance technologies for diverse operational scenarios. Laser guidance, known for its pinpoint accuracy, is also contributing to market growth. Key players like General Dynamics, Lockheed Martin, Rheinmetall, and MBDA are actively shaping the market landscape through continuous innovation and strategic partnerships. Their influence is felt across the global supply chain, influencing technological advancements and market penetration in various regions. Competition among these industry leaders is expected to remain intense, driving further innovation and efficiency improvements within the land-based smart weapons sector.
Land-based Smart Weapons Market Company Market Share
Land-based Smart Weapons Market: A Comprehensive Market Report (2019-2033)
This comprehensive report provides an in-depth analysis of the Land-based Smart Weapons Market, offering invaluable insights for industry stakeholders, investors, and strategic decision-makers. Covering the period 2019-2033, with a focus on 2025, this report dissects market dynamics, technological advancements, and key players to provide a clear understanding of current trends and future growth potential. The report leverages rigorous data analysis and expert insights to offer actionable intelligence for navigating this dynamic sector.
Land-based Smart Weapons Market Market Concentration & Dynamics
The Land-based Smart Weapons market exhibits a moderately concentrated structure, with a few major players holding significant market share. Companies like General Dynamics Corporation, Rheinmetall AG, Lockheed Martin Corporation, MBDA, Safran SA, Rafael Advanced Defense Systems Ltd, RTX Corporation, BAE Systems PLC, Northrop Grumman Corporation, and IA collectively account for approximately xx% of the global market in 2025. The market is characterized by intense competition, driven by continuous innovation in guidance technologies and ongoing efforts to enhance weapon accuracy and lethality.
- Market Share: Top 5 players hold approximately xx% market share in 2025.
- M&A Activity: The historical period (2019-2024) witnessed xx M&A deals, indicating a consolidation trend within the industry. The forecast period (2025-2033) is expected to see a further xx M&A deals, driven by companies seeking to expand their product portfolios and geographical reach.
- Innovation Ecosystems: Strong R&D investments and collaborative partnerships between defense contractors, research institutions, and government agencies fuel innovation in areas such as AI-powered targeting and hypersonic technologies.
- Regulatory Frameworks: Stringent export controls and international arms trade treaties significantly influence market dynamics, shaping investment decisions and technological advancements.
- Substitute Products: While direct substitutes are limited, the market faces indirect competition from alternative defense strategies and non-lethal weapon systems.
- End-User Trends: Growing demand for precision-guided munitions from militaries worldwide, particularly for asymmetric warfare scenarios, is a significant market driver.
Land-based Smart Weapons Market Industry Insights & Trends
The Land-based Smart Weapons market is experiencing robust growth, driven by escalating geopolitical tensions, modernization of military arsenals, and the increasing demand for precision-guided munitions. The market size was valued at xx Million in 2025 and is projected to reach xx Million by 2033, exhibiting a CAGR of xx% during the forecast period (2025-2033). Technological advancements, such as the integration of AI and improved guidance systems, are revolutionizing the sector, leading to more accurate, efficient, and adaptable weapons systems. Furthermore, evolving consumer behaviors, including the adoption of advanced targeting techniques and increased focus on minimizing collateral damage, are shaping product development and market demand. Government spending on defense modernization programs, particularly in regions experiencing geopolitical instability, is a crucial factor contributing to this market's expansion.
Key Markets & Segments Leading Land-based Smart Weapons Market
The North American region currently dominates the Land-based Smart Weapons market, holding the largest market share in 2025. This dominance is attributed to high defense budgets, advanced technological capabilities, and a strong presence of major industry players. However, the Asia-Pacific region is projected to witness significant growth during the forecast period, driven by increasing defense spending and modernization efforts by several countries in the region.
Dominant Segments:
- Product: Missiles currently hold the largest market share within the product segment, followed by Ammunitions and Other Products. The demand for missiles is particularly high due to their longer range and greater destructive power.
- Technology: Infrared Guidance and Laser Guidance systems are currently the most widely used guidance technologies, driven by their effectiveness and relatively lower cost compared to Satellite Guidance and Radar Guidance. However, there's a growing demand for advanced guidance technologies, including AI-powered systems.
Drivers:
- Economic Growth: Strong economic growth in key regions fuels increased defense spending and investments in military modernization.
- Infrastructure: Robust infrastructure development supports the manufacturing, testing, and deployment of advanced weapon systems.
- Geopolitical Instability: Rising geopolitical tensions and conflicts drive demand for sophisticated land-based smart weapons.
Land-based Smart Weapons Market Product Developments
Recent years have witnessed significant advancements in Land-based Smart Weapons technology. Miniaturization of guidance systems, improved accuracy through AI-powered targeting, and the development of hypersonic weapons are key examples. These innovations offer enhanced precision, reduced collateral damage, and increased effectiveness against a broader range of targets. The integration of advanced materials, such as composite materials and carbon fiber, has further improved weapon performance, durability, and weight reduction. These advancements provide manufacturers with a crucial competitive edge and shape the future of the land-based smart weapons market.
Challenges in the Land-based Smart Weapons Market Market
The Land-based Smart Weapons market faces several challenges. Stringent export controls and international regulations pose significant barriers to market entry and expansion, while supply chain disruptions caused by geopolitical events can severely impact production and delivery schedules. Furthermore, intense competition among major players leads to price pressures and necessitates continuous innovation to maintain a competitive advantage. These factors can collectively restrict market growth and affect profitability.
Forces Driving Land-based Smart Weapons Market Growth
Several factors are driving the growth of the Land-based Smart Weapons market. Technological advancements, including the integration of AI, improved sensor technology, and the development of hypersonic weapons, are enhancing weapon capabilities. Increased defense spending by governments worldwide, driven by geopolitical instability and the need for military modernization, significantly fuels market demand. Furthermore, favorable regulatory environments in some regions support industry growth and investment.
Long-Term Growth Catalysts in the Land-based Smart Weapons Market
Long-term growth in the Land-based Smart Weapons market will be fueled by continuous innovation in guidance systems, the development of autonomous weapons, and the expansion into new markets. Strategic partnerships and collaborations between defense contractors and research institutions will play a crucial role in accelerating technological advancements. Investment in advanced materials and manufacturing processes will further enhance weapon performance and reduce production costs, strengthening long-term market prospects.
Emerging Opportunities in Land-based Smart Weapons Market
Emerging opportunities lie in the development and deployment of AI-powered weapons, hypersonic weapons, and swarm technologies. The expansion into new markets, particularly in developing countries with growing defense budgets, presents significant growth potential. The increasing demand for cost-effective and easily deployable weapons systems offers opportunities for manufacturers to develop and offer new solutions.
Leading Players in the Land-based Smart Weapons Market Sector
Key Milestones in Land-based Smart Weapons Market Industry
- 2020: Successful testing of a new AI-powered targeting system by Lockheed Martin Corporation.
- 2021: Launch of a hypersonic missile by Russia.
- 2022: Acquisition of a smaller smart weapons manufacturer by General Dynamics Corporation.
- 2023: Successful deployment of a new generation of precision-guided munitions in a regional conflict.
- 2024: Joint development agreement between two major players for a new guided artillery shell.
- 2025: First deployment of swarm technology by a major military.
Strategic Outlook for Land-based Smart Weapons Market Market
The Land-based Smart Weapons market is poised for sustained growth, driven by continuous technological advancements, increasing defense budgets, and evolving geopolitical dynamics. Strategic opportunities lie in developing and deploying innovative technologies, forging strategic partnerships, and expanding into new markets. Companies that successfully adapt to the changing landscape and invest in R&D will be best positioned to capture market share and drive future growth in this dynamic sector.
Land-based Smart Weapons Market Segmentation
-
1. Product
- 1.1. Missiles
- 1.2. Ammunitions and Other Products
-
2. Technology
- 2.1. Satellite Guidance
- 2.2. Radar Guidance
- 2.3. Infrared Guidance
- 2.4. Laser Guidance
- 2.5. Other Technologies
Land-based Smart Weapons Market Segmentation By Geography
-
1. North America
- 1.1. United States
- 1.2. Canada
-
2. Europe
- 2.1. United Kingdom
- 2.2. France
- 2.3. Germany
- 2.4. Russia
- 2.5. Rest of Europe
-
3. Asia Pacific
- 3.1. China
- 3.2. India
- 3.3. Japan
- 3.4. Rest of Asia Pacific
-
4. Latin America
- 4.1. Brazil
- 4.2. Rest of Latin America
-
5. Middle East and Africa
- 5.1. Saudi Arabia
- 5.2. United Arab Emirates
- 5.3. Israel
- 5.4. Rest of Middle East and Africa
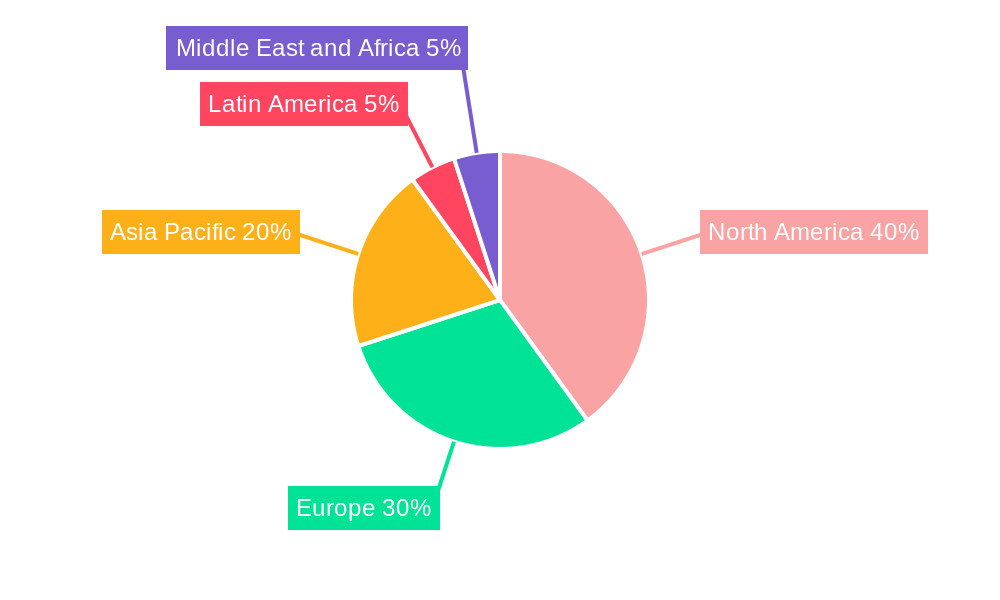
Land-based Smart Weapons Market Regional Market Share
Geographic Coverage of Land-based Smart Weapons Market
Land-based Smart Weapons Market REPORT HIGHLIGHTS
| Aspects | Details |
|---|---|
| Study Period | 2020-2034 |
| Base Year | 2025 |
| Estimated Year | 2026 |
| Forecast Period | 2026-2034 |
| Historical Period | 2020-2025 |
| Growth Rate | CAGR of 7.48% from 2020-2034 |
| Segmentation |
|
Table of Contents
- 1. Introduction
- 1.1. Research Scope
- 1.2. Market Segmentation
- 1.3. Research Objective
- 1.4. Definitions and Assumptions
- 2. Executive Summary
- 2.1. Market Snapshot
- 3. Market Dynamics
- 3.1. Market Drivers
- 3.2. Market Restrains
- 3.3. Market Trends
- 3.4. Market Opportunities
- 4. Market Factor Analysis
- 4.1. Porters Five Forces
- 4.1.1. Bargaining Power of Suppliers
- 4.1.2. Bargaining Power of Buyers
- 4.1.3. Threat of New Entrants
- 4.1.4. Threat of Substitutes
- 4.1.5. Competitive Rivalry
- 4.2. PESTEL analysis
- 4.3. BCG Analysis
- 4.3.1. Stars (High Growth, High Market Share)
- 4.3.2. Cash Cows (Low Growth, High Market Share)
- 4.3.3. Question Mark (High Growth, Low Market Share)
- 4.3.4. Dogs (Low Growth, Low Market Share)
- 4.4. Ansoff Matrix Analysis
- 4.5. Supply Chain Analysis
- 4.6. Regulatory Landscape
- 4.7. Current Market Potential and Opportunity Assessment (TAM–SAM–SOM Framework)
- 4.8. MSR Analyst Note
- 4.1. Porters Five Forces
- 5. Market Analysis, Insights and Forecast 2021-2033
- 5.1. Market Analysis, Insights and Forecast - by Product
- 5.1.1. Missiles
- 5.1.2. Ammunitions and Other Products
- 5.2. Market Analysis, Insights and Forecast - by Technology
- 5.2.1. Satellite Guidance
- 5.2.2. Radar Guidance
- 5.2.3. Infrared Guidance
- 5.2.4. Laser Guidance
- 5.2.5. Other Technologies
- 5.3. Market Analysis, Insights and Forecast - by Region
- 5.3.1. North America
- 5.3.2. Europe
- 5.3.3. Asia Pacific
- 5.3.4. Latin America
- 5.3.5. Middle East and Africa
- 5.1. Market Analysis, Insights and Forecast - by Product
- 6. Global Land-based Smart Weapons Market Analysis, Insights and Forecast, 2021-2033
- 6.1. Market Analysis, Insights and Forecast - by Product
- 6.1.1. Missiles
- 6.1.2. Ammunitions and Other Products
- 6.2. Market Analysis, Insights and Forecast - by Technology
- 6.2.1. Satellite Guidance
- 6.2.2. Radar Guidance
- 6.2.3. Infrared Guidance
- 6.2.4. Laser Guidance
- 6.2.5. Other Technologies
- 6.1. Market Analysis, Insights and Forecast - by Product
- 7. North America Land-based Smart Weapons Market Analysis, Insights and Forecast, 2020-2032
- 7.1. Market Analysis, Insights and Forecast - by Product
- 7.1.1. Missiles
- 7.1.2. Ammunitions and Other Products
- 7.2. Market Analysis, Insights and Forecast - by Technology
- 7.2.1. Satellite Guidance
- 7.2.2. Radar Guidance
- 7.2.3. Infrared Guidance
- 7.2.4. Laser Guidance
- 7.2.5. Other Technologies
- 7.1. Market Analysis, Insights and Forecast - by Product
- 8. Europe Land-based Smart Weapons Market Analysis, Insights and Forecast, 2020-2032
- 8.1. Market Analysis, Insights and Forecast - by Product
- 8.1.1. Missiles
- 8.1.2. Ammunitions and Other Products
- 8.2. Market Analysis, Insights and Forecast - by Technology
- 8.2.1. Satellite Guidance
- 8.2.2. Radar Guidance
- 8.2.3. Infrared Guidance
- 8.2.4. Laser Guidance
- 8.2.5. Other Technologies
- 8.1. Market Analysis, Insights and Forecast - by Product
- 9. Asia Pacific Land-based Smart Weapons Market Analysis, Insights and Forecast, 2020-2032
- 9.1. Market Analysis, Insights and Forecast - by Product
- 9.1.1. Missiles
- 9.1.2. Ammunitions and Other Products
- 9.2. Market Analysis, Insights and Forecast - by Technology
- 9.2.1. Satellite Guidance
- 9.2.2. Radar Guidance
- 9.2.3. Infrared Guidance
- 9.2.4. Laser Guidance
- 9.2.5. Other Technologies
- 9.1. Market Analysis, Insights and Forecast - by Product
- 10. Latin America Land-based Smart Weapons Market Analysis, Insights and Forecast, 2020-2032
- 10.1. Market Analysis, Insights and Forecast - by Product
- 10.1.1. Missiles
- 10.1.2. Ammunitions and Other Products
- 10.2. Market Analysis, Insights and Forecast - by Technology
- 10.2.1. Satellite Guidance
- 10.2.2. Radar Guidance
- 10.2.3. Infrared Guidance
- 10.2.4. Laser Guidance
- 10.2.5. Other Technologies
- 10.1. Market Analysis, Insights and Forecast - by Product
- 11. Middle East and Africa Land-based Smart Weapons Market Analysis, Insights and Forecast, 2020-2032
- 11.1. Market Analysis, Insights and Forecast - by Product
- 11.1.1. Missiles
- 11.1.2. Ammunitions and Other Products
- 11.2. Market Analysis, Insights and Forecast - by Technology
- 11.2.1. Satellite Guidance
- 11.2.2. Radar Guidance
- 11.2.3. Infrared Guidance
- 11.2.4. Laser Guidance
- 11.2.5. Other Technologies
- 11.1. Market Analysis, Insights and Forecast - by Product
- 12. Competitive Analysis
- 12.1. Company Profiles
- 12.1.1 General Dynamics Corporation
- 12.1.1.1. Company Overview
- 12.1.1.2. Products
- 12.1.1.3. Company Financials
- 12.1.1.4. SWOT Analysis
- 12.1.2 Rheinmetall AG
- 12.1.2.1. Company Overview
- 12.1.2.2. Products
- 12.1.2.3. Company Financials
- 12.1.2.4. SWOT Analysis
- 12.1.3 Lockheed Martin Corporation
- 12.1.3.1. Company Overview
- 12.1.3.2. Products
- 12.1.3.3. Company Financials
- 12.1.3.4. SWOT Analysis
- 12.1.4 MBDA
- 12.1.4.1. Company Overview
- 12.1.4.2. Products
- 12.1.4.3. Company Financials
- 12.1.4.4. SWOT Analysis
- 12.1.5 Safran SA
- 12.1.5.1. Company Overview
- 12.1.5.2. Products
- 12.1.5.3. Company Financials
- 12.1.5.4. SWOT Analysis
- 12.1.6 Rafael Advanced Defense Systems Ltd
- 12.1.6.1. Company Overview
- 12.1.6.2. Products
- 12.1.6.3. Company Financials
- 12.1.6.4. SWOT Analysis
- 12.1.7 RTX Corporation
- 12.1.7.1. Company Overview
- 12.1.7.2. Products
- 12.1.7.3. Company Financials
- 12.1.7.4. SWOT Analysis
- 12.1.8 BAE Systems PLC
- 12.1.8.1. Company Overview
- 12.1.8.2. Products
- 12.1.8.3. Company Financials
- 12.1.8.4. SWOT Analysis
- 12.1.9 Northrop Grumman Corporation
- 12.1.9.1. Company Overview
- 12.1.9.2. Products
- 12.1.9.3. Company Financials
- 12.1.9.4. SWOT Analysis
- 12.1.10 IA
- 12.1.10.1. Company Overview
- 12.1.10.2. Products
- 12.1.10.3. Company Financials
- 12.1.10.4. SWOT Analysis
- 12.1.1 General Dynamics Corporation
- 12.2. Market Entropy
- 12.2.1 Company's Key Areas Served
- 12.2.2 Recent Developments
- 12.3. Company Market Share Analysis 2025
- 12.3.1 Top 5 Companies Market Share Analysis
- 12.3.2 Top 3 Companies Market Share Analysis
- 12.4. List of Potential Customers
- 13. Research Methodology
List of Figures
- Figure 1: Global Land-based Smart Weapons Market Revenue Breakdown (Million, %) by Region 2025 & 2033
- Figure 2: North America Land-based Smart Weapons Market Revenue (Million), by Product 2025 & 2033
- Figure 3: North America Land-based Smart Weapons Market Revenue Share (%), by Product 2025 & 2033
- Figure 4: North America Land-based Smart Weapons Market Revenue (Million), by Technology 2025 & 2033
- Figure 5: North America Land-based Smart Weapons Market Revenue Share (%), by Technology 2025 & 2033
- Figure 6: North America Land-based Smart Weapons Market Revenue (Million), by Country 2025 & 2033
- Figure 7: North America Land-based Smart Weapons Market Revenue Share (%), by Country 2025 & 2033
- Figure 8: Europe Land-based Smart Weapons Market Revenue (Million), by Product 2025 & 2033
- Figure 9: Europe Land-based Smart Weapons Market Revenue Share (%), by Product 2025 & 2033
- Figure 10: Europe Land-based Smart Weapons Market Revenue (Million), by Technology 2025 & 2033
- Figure 11: Europe Land-based Smart Weapons Market Revenue Share (%), by Technology 2025 & 2033
- Figure 12: Europe Land-based Smart Weapons Market Revenue (Million), by Country 2025 & 2033
- Figure 13: Europe Land-based Smart Weapons Market Revenue Share (%), by Country 2025 & 2033
- Figure 14: Asia Pacific Land-based Smart Weapons Market Revenue (Million), by Product 2025 & 2033
- Figure 15: Asia Pacific Land-based Smart Weapons Market Revenue Share (%), by Product 2025 & 2033
- Figure 16: Asia Pacific Land-based Smart Weapons Market Revenue (Million), by Technology 2025 & 2033
- Figure 17: Asia Pacific Land-based Smart Weapons Market Revenue Share (%), by Technology 2025 & 2033
- Figure 18: Asia Pacific Land-based Smart Weapons Market Revenue (Million), by Country 2025 & 2033
- Figure 19: Asia Pacific Land-based Smart Weapons Market Revenue Share (%), by Country 2025 & 2033
- Figure 20: Latin America Land-based Smart Weapons Market Revenue (Million), by Product 2025 & 2033
- Figure 21: Latin America Land-based Smart Weapons Market Revenue Share (%), by Product 2025 & 2033
- Figure 22: Latin America Land-based Smart Weapons Market Revenue (Million), by Technology 2025 & 2033
- Figure 23: Latin America Land-based Smart Weapons Market Revenue Share (%), by Technology 2025 & 2033
- Figure 24: Latin America Land-based Smart Weapons Market Revenue (Million), by Country 2025 & 2033
- Figure 25: Latin America Land-based Smart Weapons Market Revenue Share (%), by Country 2025 & 2033
- Figure 26: Middle East and Africa Land-based Smart Weapons Market Revenue (Million), by Product 2025 & 2033
- Figure 27: Middle East and Africa Land-based Smart Weapons Market Revenue Share (%), by Product 2025 & 2033
- Figure 28: Middle East and Africa Land-based Smart Weapons Market Revenue (Million), by Technology 2025 & 2033
- Figure 29: Middle East and Africa Land-based Smart Weapons Market Revenue Share (%), by Technology 2025 & 2033
- Figure 30: Middle East and Africa Land-based Smart Weapons Market Revenue (Million), by Country 2025 & 2033
- Figure 31: Middle East and Africa Land-based Smart Weapons Market Revenue Share (%), by Country 2025 & 2033
List of Tables
- Table 1: Global Land-based Smart Weapons Market Revenue Million Forecast, by Product 2020 & 2033
- Table 2: Global Land-based Smart Weapons Market Revenue Million Forecast, by Technology 2020 & 2033
- Table 3: Global Land-based Smart Weapons Market Revenue Million Forecast, by Region 2020 & 2033
- Table 4: Global Land-based Smart Weapons Market Revenue Million Forecast, by Product 2020 & 2033
- Table 5: Global Land-based Smart Weapons Market Revenue Million Forecast, by Technology 2020 & 2033
- Table 6: Global Land-based Smart Weapons Market Revenue Million Forecast, by Country 2020 & 2033
- Table 7: United States Land-based Smart Weapons Market Revenue (Million) Forecast, by Application 2020 & 2033
- Table 8: Canada Land-based Smart Weapons Market Revenue (Million) Forecast, by Application 2020 & 2033
- Table 9: Global Land-based Smart Weapons Market Revenue Million Forecast, by Product 2020 & 2033
- Table 10: Global Land-based Smart Weapons Market Revenue Million Forecast, by Technology 2020 & 2033
- Table 11: Global Land-based Smart Weapons Market Revenue Million Forecast, by Country 2020 & 2033
- Table 12: United Kingdom Land-based Smart Weapons Market Revenue (Million) Forecast, by Application 2020 & 2033
- Table 13: France Land-based Smart Weapons Market Revenue (Million) Forecast, by Application 2020 & 2033
- Table 14: Germany Land-based Smart Weapons Market Revenue (Million) Forecast, by Application 2020 & 2033
- Table 15: Russia Land-based Smart Weapons Market Revenue (Million) Forecast, by Application 2020 & 2033
- Table 16: Rest of Europe Land-based Smart Weapons Market Revenue (Million) Forecast, by Application 2020 & 2033
- Table 17: Global Land-based Smart Weapons Market Revenue Million Forecast, by Product 2020 & 2033
- Table 18: Global Land-based Smart Weapons Market Revenue Million Forecast, by Technology 2020 & 2033
- Table 19: Global Land-based Smart Weapons Market Revenue Million Forecast, by Country 2020 & 2033
- Table 20: China Land-based Smart Weapons Market Revenue (Million) Forecast, by Application 2020 & 2033
- Table 21: India Land-based Smart Weapons Market Revenue (Million) Forecast, by Application 2020 & 2033
- Table 22: Japan Land-based Smart Weapons Market Revenue (Million) Forecast, by Application 2020 & 2033
- Table 23: Rest of Asia Pacific Land-based Smart Weapons Market Revenue (Million) Forecast, by Application 2020 & 2033
- Table 24: Global Land-based Smart Weapons Market Revenue Million Forecast, by Product 2020 & 2033
- Table 25: Global Land-based Smart Weapons Market Revenue Million Forecast, by Technology 2020 & 2033
- Table 26: Global Land-based Smart Weapons Market Revenue Million Forecast, by Country 2020 & 2033
- Table 27: Brazil Land-based Smart Weapons Market Revenue (Million) Forecast, by Application 2020 & 2033
- Table 28: Rest of Latin America Land-based Smart Weapons Market Revenue (Million) Forecast, by Application 2020 & 2033
- Table 29: Global Land-based Smart Weapons Market Revenue Million Forecast, by Product 2020 & 2033
- Table 30: Global Land-based Smart Weapons Market Revenue Million Forecast, by Technology 2020 & 2033
- Table 31: Global Land-based Smart Weapons Market Revenue Million Forecast, by Country 2020 & 2033
- Table 32: Saudi Arabia Land-based Smart Weapons Market Revenue (Million) Forecast, by Application 2020 & 2033
- Table 33: United Arab Emirates Land-based Smart Weapons Market Revenue (Million) Forecast, by Application 2020 & 2033
- Table 34: Israel Land-based Smart Weapons Market Revenue (Million) Forecast, by Application 2020 & 2033
- Table 35: Rest of Middle East and Africa Land-based Smart Weapons Market Revenue (Million) Forecast, by Application 2020 & 2033
Frequently Asked Questions
1. What is the projected Compound Annual Growth Rate (CAGR) of the Land-based Smart Weapons Market?
The projected CAGR is approximately 7.48%.
2. Which companies are prominent players in the Land-based Smart Weapons Market?
Key companies in the market include General Dynamics Corporation, Rheinmetall AG, Lockheed Martin Corporation, MBDA, Safran SA, Rafael Advanced Defense Systems Ltd, RTX Corporation, BAE Systems PLC, Northrop Grumman Corporation, IA.
3. What are the main segments of the Land-based Smart Weapons Market?
The market segments include Product, Technology.
4. Can you provide details about the market size?
The market size is estimated to be USD 7.35 Million as of 2022.
5. What are some drivers contributing to market growth?
N/A
6. What are the notable trends driving market growth?
Ammunitions and Other Products Segment is Expected to Witness Highest Growth.
7. Are there any restraints impacting market growth?
N/A
8. Can you provide examples of recent developments in the market?
N/A
9. What pricing options are available for accessing the report?
Pricing options include single-user, multi-user, and enterprise licenses priced at USD 4750, USD 5250, and USD 8750 respectively.
10. Is the market size provided in terms of value or volume?
The market size is provided in terms of value, measured in Million.
11. Are there any specific market keywords associated with the report?
Yes, the market keyword associated with the report is "Land-based Smart Weapons Market," which aids in identifying and referencing the specific market segment covered.
12. How do I determine which pricing option suits my needs best?
The pricing options vary based on user requirements and access needs. Individual users may opt for single-user licenses, while businesses requiring broader access may choose multi-user or enterprise licenses for cost-effective access to the report.
13. Are there any additional resources or data provided in the Land-based Smart Weapons Market report?
While the report offers comprehensive insights, it's advisable to review the specific contents or supplementary materials provided to ascertain if additional resources or data are available.
14. How can I stay updated on further developments or reports in the Land-based Smart Weapons Market?
To stay informed about further developments, trends, and reports in the Land-based Smart Weapons Market, consider subscribing to industry newsletters, following relevant companies and organizations, or regularly checking reputable industry news sources and publications.
Methodology
Step 1 - Identification of Relevant Samples Size from Population Database


Step 2 - Approaches for Defining Global Market Size (Value, Volume* & Price*)

Note*: In applicable scenarios
Step 3 - Data Sources
Primary Research
- Web Analytics
- Survey Reports
- Research Institute
- Latest Research Reports
- Opinion Leaders
Secondary Research
- Annual Reports
- White Paper
- Latest Press Release
- Industry Association
- Paid Database
- Investor Presentations

Step 4 - Data Triangulation
Involves using different sources of information in order to increase the validity of a study
These sources are likely to be stakeholders in a program - participants, other researchers, program staff, other community members, and so on.
Then we put all data in single framework & apply various statistical tools to find out the dynamic on the market.
During the analysis stage, feedback from the stakeholder groups would be compared to determine areas of agreement as well as areas of divergence