

Key Insights
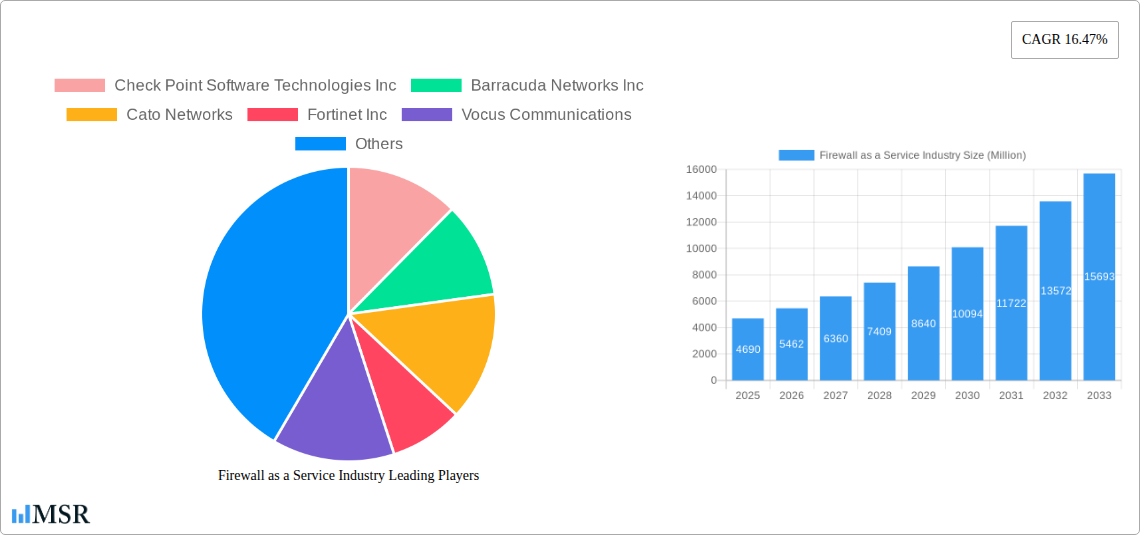
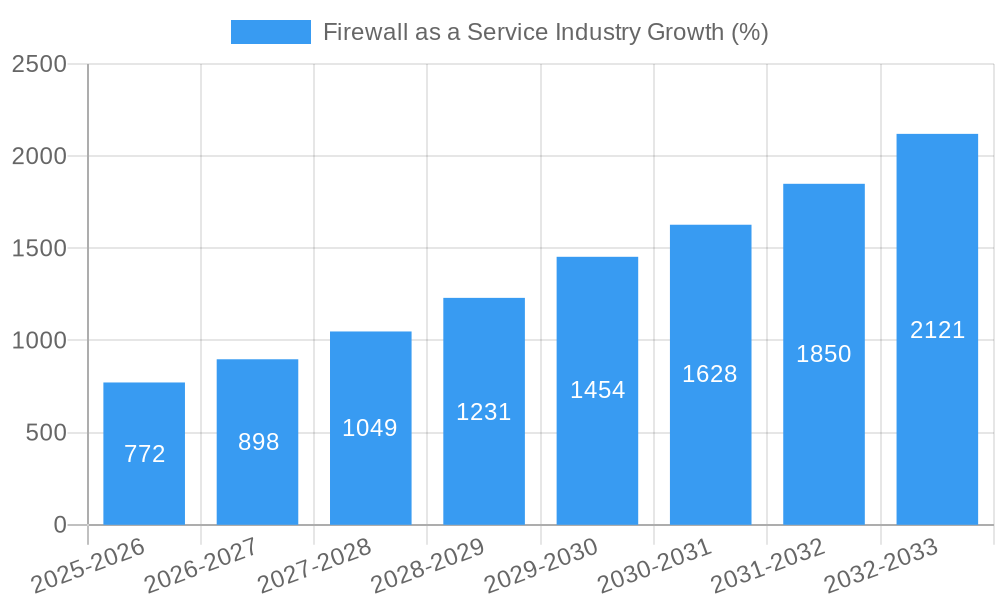
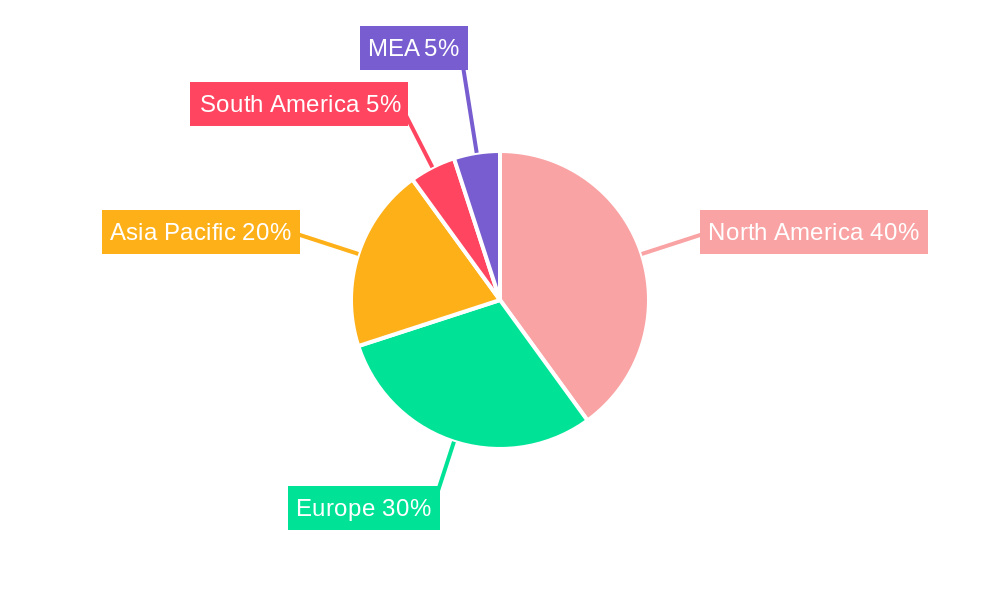
The Firewall as a Service (FWaaS) market is experiencing robust growth, projected to reach a market size of $4.69 billion in 2025, expanding at a Compound Annual Growth Rate (CAGR) of 16.47%. This significant expansion is driven by several key factors. The increasing adoption of cloud-based applications and infrastructure necessitates robust security solutions, making FWaaS a critical component of modern cybersecurity strategies. Businesses are increasingly shifting towards flexible, cost-effective, and easily scalable security models, which FWaaS perfectly addresses. Furthermore, the growing prevalence of sophisticated cyber threats, including ransomware and distributed denial-of-service (DDoS) attacks, is fueling demand for advanced security solutions like FWaaS, which provide continuous protection and automated threat mitigation. The market segmentation reveals strong growth across various user types (large enterprises and SMEs), industry verticals (BFSI, IT & Telecom, Healthcare, Retail, Aerospace & Defence), service models (SaaS, IaaS, PaaS), and deployment models (private, public, hybrid). North America currently holds a significant market share, driven by high technological adoption and a strong presence of key players. However, the Asia-Pacific region is poised for substantial growth, driven by increasing digitalization and rising cybersecurity awareness.
The competitive landscape is characterized by a mix of established players like Check Point Software Technologies, Fortinet, and Cisco Systems, alongside emerging innovative companies. The market's growth trajectory is expected to continue throughout the forecast period (2025-2033), fueled by ongoing digital transformation, increasing reliance on cloud technologies, and the escalating complexity of cyber threats. While the initial investment in FWaaS can be a restraint for some smaller organizations, the long-term cost savings and enhanced security offered by the service ultimately outweigh the initial costs. The ongoing evolution of threat landscapes and the development of more sophisticated FWaaS solutions will further drive market expansion in the coming years. Continued innovation in areas like AI-powered threat detection and automated response capabilities will be crucial for sustaining this growth trajectory and meeting evolving security needs.
Firewall as a Service (FWaaS) Industry Report: 2019-2033
This comprehensive report provides a detailed analysis of the Firewall as a Service (FWaaS) industry, offering invaluable insights for stakeholders, investors, and industry professionals. The report covers market size, segmentation, key players, technological advancements, and future growth projections, all underpinned by rigorous data analysis and expert insights. The study period spans 2019-2033, with a base year of 2025 and a forecast period of 2025-2033. The market is expected to reach xx Million by 2033, growing at a CAGR of xx%.
Firewall as a Service Industry Market Concentration & Dynamics
The Firewall as a Service market is characterized by a moderately concentrated landscape, with several major players holding significant market share. Check Point Software Technologies Inc, Fortinet Inc, and Zscaler Inc, among others, are key players contributing to the market's competitive intensity. The industry is witnessing continuous innovation, driven by the need for enhanced security solutions in the cloud and distributed environments. Regulatory frameworks, such as GDPR and CCPA, are impacting the market by demanding stringent data protection measures. Substitute products, such as virtual private networks (VPNs) and other security solutions, offer competition. End-user trends towards cloud adoption and remote work are fueling the demand for FWaaS. The market has seen several significant mergers and acquisitions (M&A) in recent years, indicating a consolidating landscape.
- Market Share (Estimated 2025): Top 5 players hold approximately xx% of the market.
- M&A Deal Count (2019-2024): Approximately xx deals, reflecting industry consolidation.
Firewall as a Service Industry Industry Insights & Trends
The FWaaS market is experiencing robust growth, driven by the increasing adoption of cloud computing, the proliferation of remote work, and the escalating need for advanced network security. The market size reached xx Million in 2024 and is projected to reach xx Million by 2033, indicating substantial market expansion. This growth is fueled by several factors, including the rising sophistication of cyber threats, the growing demand for scalable and cost-effective security solutions, and increasing awareness of data security and compliance regulations among businesses. Technological disruptions, such as the adoption of Artificial Intelligence (AI) and machine learning (ML) in FWaaS solutions, are enhancing the efficiency and effectiveness of security measures. Consumer behavior is shifting toward cloud-based solutions, further driving the demand for FWaaS. The market is also witnessing a growing adoption of Software-as-a-Service (SaaS) based solutions due to their ease of deployment and scalability.
Key Markets & Segments Leading Firewall as a Service Industry
The North American region currently dominates the FWaaS market due to high cloud adoption rates, strong technological infrastructure, and a mature cybersecurity market. Within the segments, Large Enterprises are the biggest consumers, followed by SMEs. The BFSI, IT & Telecom, and Healthcare sectors are key vertical markets driving the demand for FWaaS due to their stringent security requirements and sensitivity to data breaches. The SaaS service model holds a prominent position, driven by ease of deployment and cost efficiency. Hybrid deployment models are gaining traction as businesses seek to combine the benefits of public and private cloud environments.
- Dominant Region: North America
- Dominant User Type: Large Enterprises
- Dominant Industry Vertical: BFSI
- Dominant Service Model: SaaS
- Dominant Deployment Model: Hybrid
Drivers for Growth by Segment:
- Large Enterprises: High security budgets, complex IT infrastructure, and increasing reliance on cloud services.
- BFSI: Stringent regulatory compliance requirements and sensitive customer data.
- SaaS: Ease of deployment, scalability, cost-effectiveness, and pay-as-you-go pricing model.
- Hybrid Deployment: Flexibility to leverage both public and private cloud benefits.
Firewall as a Service Industry Product Developments
Recent product innovations in the FWaaS market emphasize advanced threat detection capabilities, AI-powered security, and seamless integration with other security solutions. Companies are focusing on developing solutions that offer enhanced visibility into network traffic, improved threat prevention, and streamlined management. These developments are enhancing the competitive landscape, compelling vendors to innovate and offer solutions tailored to meet evolving customer needs. For instance, WatchGuard's new Firebox appliances and Palo Alto Network's Cloud NGFW for AWS highlight the ongoing focus on improved security and cloud-native solutions.
Challenges in the Firewall as a Service Industry Market
The FWaaS market faces challenges such as ensuring data privacy and compliance with evolving regulations, managing the complexities of integrating with various cloud platforms and maintaining seamless interoperability, and competition from other security solutions which limits profitability margins. Supply chain issues could also impact the availability and affordability of FWaaS solutions. Intense competition among established players and new entrants further complicates the landscape.
Forces Driving Firewall as a Service Industry Growth
Several factors are propelling the growth of the FWaaS market. The increasing adoption of cloud-based services and remote work models is creating significant demand for secure remote access solutions. Moreover, the growing frequency and sophistication of cyberattacks are pushing organizations to invest in advanced security solutions. Furthermore, stringent data privacy regulations are pushing organizations towards robust security solutions.
Long-Term Growth Catalysts in the Firewall as a Service Industry
Long-term growth in the FWaaS market will be driven by continued innovation in security technologies, such as AI and machine learning, enabling more effective threat detection and response. Strategic partnerships between FWaaS providers and cloud service providers will further accelerate market growth. Expansion into new geographical markets and industry verticals will unlock significant growth opportunities.
Emerging Opportunities in Firewall as a Service Industry
Emerging opportunities include the integration of FWaaS with other security services like Secure Access Service Edge (SASE), and the growth of specialized FWaaS offerings for specific industry verticals. The rising adoption of IoT devices presents significant opportunities for FWaaS providers to expand their reach and develop new solutions. The development of more sophisticated threat intelligence capabilities will further differentiate FWaaS offerings and expand market potential.
Leading Players in the Firewall as a Service Industry Sector
- Check Point Software Technologies Inc
- Barracuda Networks Inc
- Cato Networks
- Fortinet Inc
- Vocus Communications
- IntraSystems
- Cisco Systems Inc
- Microsoft Corporation
- Juniper Networks Inc
- Zscaler Inc
- Sprout Technologies Ltd
- Forcepoint
Key Milestones in Firewall as a Service Industry Industry
- February 2023: WatchGuard Technologies launched new Firebox tabletop firewall appliances, enhancing security for remote and distributed environments.
- March 2022: Palo Alto Networks partnered with AWS to launch a managed NGFW service, simplifying AWS security deployments.
- February 2022: Juniper Networks unveiled Juniper Secure Edge, a FWaaS solution within its SASE offering, securing geographically dispersed workforces.
Strategic Outlook for Firewall as a Service Industry Market
The FWaaS market holds significant future potential, driven by the ongoing shift towards cloud computing, the growing need for robust cybersecurity solutions, and the emergence of new technologies such as AI and ML. Strategic partnerships, technological innovations, and expansions into new markets will be key to realizing this potential. The market is poised for sustained growth, presenting significant opportunities for both established players and new entrants.
Firewall as a Service Industry Segmentation
-
1. Service Model
- 1.1. SaaS
- 1.2. IaaS
- 1.3. PaaS
-
2. Deployment Model
- 2.1. Private
- 2.2. Public
- 2.3. Hybrid
-
3. User Type
- 3.1. Large Enterprises
- 3.2. SMEs
-
4. Industry Vertical
- 4.1. BFSI
- 4.2. IT & Telecom
- 4.3. Healthcare
- 4.4. Retail
- 4.5. Aerospace & Defence
- 4.6. Other Industry Verticals
Firewall as a Service Industry Segmentation By Geography
-
1. North America
- 1.1. United States
- 1.2. Canada
-
2. Europe
- 2.1. United Kingdom
- 2.2. Germany
- 2.3. France
- 2.4. Rest of Europe
-
3. Asia Pacific
- 3.1. China
- 3.2. Japan
- 3.3. Australia
- 3.4. Rest of Asia Pacific
-
4. Latin America
- 4.1. Mexico
- 4.2. Brazil
- 4.3. Rest of Latin America
- 5. Middle East
Firewall as a Service Industry REPORT HIGHLIGHTS
| Aspects | Details |
|---|---|
| Study Period | 2019-2033 |
| Base Year | 2024 |
| Estimated Year | 2025 |
| Forecast Period | 2025-2033 |
| Historical Period | 2019-2024 |
| Growth Rate | CAGR of 16.47% from 2019-2033 |
| Segmentation |
|
Table of Contents
- 1. Introduction
- 1.1. Research Scope
- 1.2. Market Segmentation
- 1.3. Research Methodology
- 1.4. Definitions and Assumptions
- 2. Executive Summary
- 2.1. Introduction
- 3. Market Dynamics
- 3.1. Introduction
- 3.2. Market Drivers
- 3.2.1. Enormous Growth in Cloud Based Applications; Surge in Data Breaches on Public Cloud Environment; Everchanging Firewall Protocols for Business Organisations
- 3.3. Market Restrains
- 3.3.1. Complexity in Integrating Hosted Firewalls with On-premise Firewalls
- 3.4. Market Trends
- 3.4.1. Public Cloud Deployment Model is Expected to Hold Significant Market Share
- 4. Market Factor Analysis
- 4.1. Porters Five Forces
- 4.2. Supply/Value Chain
- 4.3. PESTEL analysis
- 4.4. Market Entropy
- 4.5. Patent/Trademark Analysis
- 5. Global Firewall as a Service Industry Analysis, Insights and Forecast, 2019-2031
- 5.1. Market Analysis, Insights and Forecast - by Service Model
- 5.1.1. SaaS
- 5.1.2. IaaS
- 5.1.3. PaaS
- 5.2. Market Analysis, Insights and Forecast - by Deployment Model
- 5.2.1. Private
- 5.2.2. Public
- 5.2.3. Hybrid
- 5.3. Market Analysis, Insights and Forecast - by User Type
- 5.3.1. Large Enterprises
- 5.3.2. SMEs
- 5.4. Market Analysis, Insights and Forecast - by Industry Vertical
- 5.4.1. BFSI
- 5.4.2. IT & Telecom
- 5.4.3. Healthcare
- 5.4.4. Retail
- 5.4.5. Aerospace & Defence
- 5.4.6. Other Industry Verticals
- 5.5. Market Analysis, Insights and Forecast - by Region
- 5.5.1. North America
- 5.5.2. Europe
- 5.5.3. Asia Pacific
- 5.5.4. Latin America
- 5.5.5. Middle East
- 5.1. Market Analysis, Insights and Forecast - by Service Model
- 6. North America Firewall as a Service Industry Analysis, Insights and Forecast, 2019-2031
- 6.1. Market Analysis, Insights and Forecast - by Service Model
- 6.1.1. SaaS
- 6.1.2. IaaS
- 6.1.3. PaaS
- 6.2. Market Analysis, Insights and Forecast - by Deployment Model
- 6.2.1. Private
- 6.2.2. Public
- 6.2.3. Hybrid
- 6.3. Market Analysis, Insights and Forecast - by User Type
- 6.3.1. Large Enterprises
- 6.3.2. SMEs
- 6.4. Market Analysis, Insights and Forecast - by Industry Vertical
- 6.4.1. BFSI
- 6.4.2. IT & Telecom
- 6.4.3. Healthcare
- 6.4.4. Retail
- 6.4.5. Aerospace & Defence
- 6.4.6. Other Industry Verticals
- 6.1. Market Analysis, Insights and Forecast - by Service Model
- 7. Europe Firewall as a Service Industry Analysis, Insights and Forecast, 2019-2031
- 7.1. Market Analysis, Insights and Forecast - by Service Model
- 7.1.1. SaaS
- 7.1.2. IaaS
- 7.1.3. PaaS
- 7.2. Market Analysis, Insights and Forecast - by Deployment Model
- 7.2.1. Private
- 7.2.2. Public
- 7.2.3. Hybrid
- 7.3. Market Analysis, Insights and Forecast - by User Type
- 7.3.1. Large Enterprises
- 7.3.2. SMEs
- 7.4. Market Analysis, Insights and Forecast - by Industry Vertical
- 7.4.1. BFSI
- 7.4.2. IT & Telecom
- 7.4.3. Healthcare
- 7.4.4. Retail
- 7.4.5. Aerospace & Defence
- 7.4.6. Other Industry Verticals
- 7.1. Market Analysis, Insights and Forecast - by Service Model
- 8. Asia Pacific Firewall as a Service Industry Analysis, Insights and Forecast, 2019-2031
- 8.1. Market Analysis, Insights and Forecast - by Service Model
- 8.1.1. SaaS
- 8.1.2. IaaS
- 8.1.3. PaaS
- 8.2. Market Analysis, Insights and Forecast - by Deployment Model
- 8.2.1. Private
- 8.2.2. Public
- 8.2.3. Hybrid
- 8.3. Market Analysis, Insights and Forecast - by User Type
- 8.3.1. Large Enterprises
- 8.3.2. SMEs
- 8.4. Market Analysis, Insights and Forecast - by Industry Vertical
- 8.4.1. BFSI
- 8.4.2. IT & Telecom
- 8.4.3. Healthcare
- 8.4.4. Retail
- 8.4.5. Aerospace & Defence
- 8.4.6. Other Industry Verticals
- 8.1. Market Analysis, Insights and Forecast - by Service Model
- 9. Latin America Firewall as a Service Industry Analysis, Insights and Forecast, 2019-2031
- 9.1. Market Analysis, Insights and Forecast - by Service Model
- 9.1.1. SaaS
- 9.1.2. IaaS
- 9.1.3. PaaS
- 9.2. Market Analysis, Insights and Forecast - by Deployment Model
- 9.2.1. Private
- 9.2.2. Public
- 9.2.3. Hybrid
- 9.3. Market Analysis, Insights and Forecast - by User Type
- 9.3.1. Large Enterprises
- 9.3.2. SMEs
- 9.4. Market Analysis, Insights and Forecast - by Industry Vertical
- 9.4.1. BFSI
- 9.4.2. IT & Telecom
- 9.4.3. Healthcare
- 9.4.4. Retail
- 9.4.5. Aerospace & Defence
- 9.4.6. Other Industry Verticals
- 9.1. Market Analysis, Insights and Forecast - by Service Model
- 10. Middle East Firewall as a Service Industry Analysis, Insights and Forecast, 2019-2031
- 10.1. Market Analysis, Insights and Forecast - by Service Model
- 10.1.1. SaaS
- 10.1.2. IaaS
- 10.1.3. PaaS
- 10.2. Market Analysis, Insights and Forecast - by Deployment Model
- 10.2.1. Private
- 10.2.2. Public
- 10.2.3. Hybrid
- 10.3. Market Analysis, Insights and Forecast - by User Type
- 10.3.1. Large Enterprises
- 10.3.2. SMEs
- 10.4. Market Analysis, Insights and Forecast - by Industry Vertical
- 10.4.1. BFSI
- 10.4.2. IT & Telecom
- 10.4.3. Healthcare
- 10.4.4. Retail
- 10.4.5. Aerospace & Defence
- 10.4.6. Other Industry Verticals
- 10.1. Market Analysis, Insights and Forecast - by Service Model
- 11. North America Firewall as a Service Industry Analysis, Insights and Forecast, 2019-2031
- 11.1. Market Analysis, Insights and Forecast - By Country/Sub-region
- 11.1.1 United States
- 11.1.2 Canada
- 11.1.3 Mexico
- 12. Europe Firewall as a Service Industry Analysis, Insights and Forecast, 2019-2031
- 12.1. Market Analysis, Insights and Forecast - By Country/Sub-region
- 12.1.1 Germany
- 12.1.2 United Kingdom
- 12.1.3 France
- 12.1.4 Spain
- 12.1.5 Italy
- 12.1.6 Spain
- 12.1.7 Belgium
- 12.1.8 Netherland
- 12.1.9 Nordics
- 12.1.10 Rest of Europe
- 13. Asia Pacific Firewall as a Service Industry Analysis, Insights and Forecast, 2019-2031
- 13.1. Market Analysis, Insights and Forecast - By Country/Sub-region
- 13.1.1 China
- 13.1.2 Japan
- 13.1.3 India
- 13.1.4 South Korea
- 13.1.5 Southeast Asia
- 13.1.6 Australia
- 13.1.7 Indonesia
- 13.1.8 Phillipes
- 13.1.9 Singapore
- 13.1.10 Thailandc
- 13.1.11 Rest of Asia Pacific
- 14. South America Firewall as a Service Industry Analysis, Insights and Forecast, 2019-2031
- 14.1. Market Analysis, Insights and Forecast - By Country/Sub-region
- 14.1.1 Brazil
- 14.1.2 Argentina
- 14.1.3 Peru
- 14.1.4 Chile
- 14.1.5 Colombia
- 14.1.6 Ecuador
- 14.1.7 Venezuela
- 14.1.8 Rest of South America
- 15. North America Firewall as a Service Industry Analysis, Insights and Forecast, 2019-2031
- 15.1. Market Analysis, Insights and Forecast - By Country/Sub-region
- 15.1.1 United States
- 15.1.2 Canada
- 15.1.3 Mexico
- 16. MEA Firewall as a Service Industry Analysis, Insights and Forecast, 2019-2031
- 16.1. Market Analysis, Insights and Forecast - By Country/Sub-region
- 16.1.1 United Arab Emirates
- 16.1.2 Saudi Arabia
- 16.1.3 South Africa
- 16.1.4 Rest of Middle East and Africa
- 17. Competitive Analysis
- 17.1. Global Market Share Analysis 2024
- 17.2. Company Profiles
- 17.2.1 Check Point Software Technologies Inc
- 17.2.1.1. Overview
- 17.2.1.2. Products
- 17.2.1.3. SWOT Analysis
- 17.2.1.4. Recent Developments
- 17.2.1.5. Financials (Based on Availability)
- 17.2.2 Barracuda Networks Inc
- 17.2.2.1. Overview
- 17.2.2.2. Products
- 17.2.2.3. SWOT Analysis
- 17.2.2.4. Recent Developments
- 17.2.2.5. Financials (Based on Availability)
- 17.2.3 Cato Networks
- 17.2.3.1. Overview
- 17.2.3.2. Products
- 17.2.3.3. SWOT Analysis
- 17.2.3.4. Recent Developments
- 17.2.3.5. Financials (Based on Availability)
- 17.2.4 Fortinet Inc
- 17.2.4.1. Overview
- 17.2.4.2. Products
- 17.2.4.3. SWOT Analysis
- 17.2.4.4. Recent Developments
- 17.2.4.5. Financials (Based on Availability)
- 17.2.5 Vocus Communications
- 17.2.5.1. Overview
- 17.2.5.2. Products
- 17.2.5.3. SWOT Analysis
- 17.2.5.4. Recent Developments
- 17.2.5.5. Financials (Based on Availability)
- 17.2.6 IntraSystems
- 17.2.6.1. Overview
- 17.2.6.2. Products
- 17.2.6.3. SWOT Analysis
- 17.2.6.4. Recent Developments
- 17.2.6.5. Financials (Based on Availability)
- 17.2.7 Cisco Systems Inc
- 17.2.7.1. Overview
- 17.2.7.2. Products
- 17.2.7.3. SWOT Analysis
- 17.2.7.4. Recent Developments
- 17.2.7.5. Financials (Based on Availability)
- 17.2.8 Microsoft Corporation
- 17.2.8.1. Overview
- 17.2.8.2. Products
- 17.2.8.3. SWOT Analysis
- 17.2.8.4. Recent Developments
- 17.2.8.5. Financials (Based on Availability)
- 17.2.9 Juniper Networks Inc
- 17.2.9.1. Overview
- 17.2.9.2. Products
- 17.2.9.3. SWOT Analysis
- 17.2.9.4. Recent Developments
- 17.2.9.5. Financials (Based on Availability)
- 17.2.10 Zscaler Inc
- 17.2.10.1. Overview
- 17.2.10.2. Products
- 17.2.10.3. SWOT Analysis
- 17.2.10.4. Recent Developments
- 17.2.10.5. Financials (Based on Availability)
- 17.2.11 Sprout Technologies Ltd
- 17.2.11.1. Overview
- 17.2.11.2. Products
- 17.2.11.3. SWOT Analysis
- 17.2.11.4. Recent Developments
- 17.2.11.5. Financials (Based on Availability)
- 17.2.12 Forcepoint
- 17.2.12.1. Overview
- 17.2.12.2. Products
- 17.2.12.3. SWOT Analysis
- 17.2.12.4. Recent Developments
- 17.2.12.5. Financials (Based on Availability)
- 17.2.1 Check Point Software Technologies Inc
List of Figures
- Figure 1: Global Firewall as a Service Industry Revenue Breakdown (Million, %) by Region 2024 & 2032
- Figure 2: North America Firewall as a Service Industry Revenue (Million), by Country 2024 & 2032
- Figure 3: North America Firewall as a Service Industry Revenue Share (%), by Country 2024 & 2032
- Figure 4: Europe Firewall as a Service Industry Revenue (Million), by Country 2024 & 2032
- Figure 5: Europe Firewall as a Service Industry Revenue Share (%), by Country 2024 & 2032
- Figure 6: Asia Pacific Firewall as a Service Industry Revenue (Million), by Country 2024 & 2032
- Figure 7: Asia Pacific Firewall as a Service Industry Revenue Share (%), by Country 2024 & 2032
- Figure 8: South America Firewall as a Service Industry Revenue (Million), by Country 2024 & 2032
- Figure 9: South America Firewall as a Service Industry Revenue Share (%), by Country 2024 & 2032
- Figure 10: North America Firewall as a Service Industry Revenue (Million), by Country 2024 & 2032
- Figure 11: North America Firewall as a Service Industry Revenue Share (%), by Country 2024 & 2032
- Figure 12: MEA Firewall as a Service Industry Revenue (Million), by Country 2024 & 2032
- Figure 13: MEA Firewall as a Service Industry Revenue Share (%), by Country 2024 & 2032
- Figure 14: North America Firewall as a Service Industry Revenue (Million), by Service Model 2024 & 2032
- Figure 15: North America Firewall as a Service Industry Revenue Share (%), by Service Model 2024 & 2032
- Figure 16: North America Firewall as a Service Industry Revenue (Million), by Deployment Model 2024 & 2032
- Figure 17: North America Firewall as a Service Industry Revenue Share (%), by Deployment Model 2024 & 2032
- Figure 18: North America Firewall as a Service Industry Revenue (Million), by User Type 2024 & 2032
- Figure 19: North America Firewall as a Service Industry Revenue Share (%), by User Type 2024 & 2032
- Figure 20: North America Firewall as a Service Industry Revenue (Million), by Industry Vertical 2024 & 2032
- Figure 21: North America Firewall as a Service Industry Revenue Share (%), by Industry Vertical 2024 & 2032
- Figure 22: North America Firewall as a Service Industry Revenue (Million), by Country 2024 & 2032
- Figure 23: North America Firewall as a Service Industry Revenue Share (%), by Country 2024 & 2032
- Figure 24: Europe Firewall as a Service Industry Revenue (Million), by Service Model 2024 & 2032
- Figure 25: Europe Firewall as a Service Industry Revenue Share (%), by Service Model 2024 & 2032
- Figure 26: Europe Firewall as a Service Industry Revenue (Million), by Deployment Model 2024 & 2032
- Figure 27: Europe Firewall as a Service Industry Revenue Share (%), by Deployment Model 2024 & 2032
- Figure 28: Europe Firewall as a Service Industry Revenue (Million), by User Type 2024 & 2032
- Figure 29: Europe Firewall as a Service Industry Revenue Share (%), by User Type 2024 & 2032
- Figure 30: Europe Firewall as a Service Industry Revenue (Million), by Industry Vertical 2024 & 2032
- Figure 31: Europe Firewall as a Service Industry Revenue Share (%), by Industry Vertical 2024 & 2032
- Figure 32: Europe Firewall as a Service Industry Revenue (Million), by Country 2024 & 2032
- Figure 33: Europe Firewall as a Service Industry Revenue Share (%), by Country 2024 & 2032
- Figure 34: Asia Pacific Firewall as a Service Industry Revenue (Million), by Service Model 2024 & 2032
- Figure 35: Asia Pacific Firewall as a Service Industry Revenue Share (%), by Service Model 2024 & 2032
- Figure 36: Asia Pacific Firewall as a Service Industry Revenue (Million), by Deployment Model 2024 & 2032
- Figure 37: Asia Pacific Firewall as a Service Industry Revenue Share (%), by Deployment Model 2024 & 2032
- Figure 38: Asia Pacific Firewall as a Service Industry Revenue (Million), by User Type 2024 & 2032
- Figure 39: Asia Pacific Firewall as a Service Industry Revenue Share (%), by User Type 2024 & 2032
- Figure 40: Asia Pacific Firewall as a Service Industry Revenue (Million), by Industry Vertical 2024 & 2032
- Figure 41: Asia Pacific Firewall as a Service Industry Revenue Share (%), by Industry Vertical 2024 & 2032
- Figure 42: Asia Pacific Firewall as a Service Industry Revenue (Million), by Country 2024 & 2032
- Figure 43: Asia Pacific Firewall as a Service Industry Revenue Share (%), by Country 2024 & 2032
- Figure 44: Latin America Firewall as a Service Industry Revenue (Million), by Service Model 2024 & 2032
- Figure 45: Latin America Firewall as a Service Industry Revenue Share (%), by Service Model 2024 & 2032
- Figure 46: Latin America Firewall as a Service Industry Revenue (Million), by Deployment Model 2024 & 2032
- Figure 47: Latin America Firewall as a Service Industry Revenue Share (%), by Deployment Model 2024 & 2032
- Figure 48: Latin America Firewall as a Service Industry Revenue (Million), by User Type 2024 & 2032
- Figure 49: Latin America Firewall as a Service Industry Revenue Share (%), by User Type 2024 & 2032
- Figure 50: Latin America Firewall as a Service Industry Revenue (Million), by Industry Vertical 2024 & 2032
- Figure 51: Latin America Firewall as a Service Industry Revenue Share (%), by Industry Vertical 2024 & 2032
- Figure 52: Latin America Firewall as a Service Industry Revenue (Million), by Country 2024 & 2032
- Figure 53: Latin America Firewall as a Service Industry Revenue Share (%), by Country 2024 & 2032
- Figure 54: Middle East Firewall as a Service Industry Revenue (Million), by Service Model 2024 & 2032
- Figure 55: Middle East Firewall as a Service Industry Revenue Share (%), by Service Model 2024 & 2032
- Figure 56: Middle East Firewall as a Service Industry Revenue (Million), by Deployment Model 2024 & 2032
- Figure 57: Middle East Firewall as a Service Industry Revenue Share (%), by Deployment Model 2024 & 2032
- Figure 58: Middle East Firewall as a Service Industry Revenue (Million), by User Type 2024 & 2032
- Figure 59: Middle East Firewall as a Service Industry Revenue Share (%), by User Type 2024 & 2032
- Figure 60: Middle East Firewall as a Service Industry Revenue (Million), by Industry Vertical 2024 & 2032
- Figure 61: Middle East Firewall as a Service Industry Revenue Share (%), by Industry Vertical 2024 & 2032
- Figure 62: Middle East Firewall as a Service Industry Revenue (Million), by Country 2024 & 2032
- Figure 63: Middle East Firewall as a Service Industry Revenue Share (%), by Country 2024 & 2032
List of Tables
- Table 1: Global Firewall as a Service Industry Revenue Million Forecast, by Region 2019 & 2032
- Table 2: Global Firewall as a Service Industry Revenue Million Forecast, by Service Model 2019 & 2032
- Table 3: Global Firewall as a Service Industry Revenue Million Forecast, by Deployment Model 2019 & 2032
- Table 4: Global Firewall as a Service Industry Revenue Million Forecast, by User Type 2019 & 2032
- Table 5: Global Firewall as a Service Industry Revenue Million Forecast, by Industry Vertical 2019 & 2032
- Table 6: Global Firewall as a Service Industry Revenue Million Forecast, by Region 2019 & 2032
- Table 7: Global Firewall as a Service Industry Revenue Million Forecast, by Country 2019 & 2032
- Table 8: United States Firewall as a Service Industry Revenue (Million) Forecast, by Application 2019 & 2032
- Table 9: Canada Firewall as a Service Industry Revenue (Million) Forecast, by Application 2019 & 2032
- Table 10: Mexico Firewall as a Service Industry Revenue (Million) Forecast, by Application 2019 & 2032
- Table 11: Global Firewall as a Service Industry Revenue Million Forecast, by Country 2019 & 2032
- Table 12: Germany Firewall as a Service Industry Revenue (Million) Forecast, by Application 2019 & 2032
- Table 13: United Kingdom Firewall as a Service Industry Revenue (Million) Forecast, by Application 2019 & 2032
- Table 14: France Firewall as a Service Industry Revenue (Million) Forecast, by Application 2019 & 2032
- Table 15: Spain Firewall as a Service Industry Revenue (Million) Forecast, by Application 2019 & 2032
- Table 16: Italy Firewall as a Service Industry Revenue (Million) Forecast, by Application 2019 & 2032
- Table 17: Spain Firewall as a Service Industry Revenue (Million) Forecast, by Application 2019 & 2032
- Table 18: Belgium Firewall as a Service Industry Revenue (Million) Forecast, by Application 2019 & 2032
- Table 19: Netherland Firewall as a Service Industry Revenue (Million) Forecast, by Application 2019 & 2032
- Table 20: Nordics Firewall as a Service Industry Revenue (Million) Forecast, by Application 2019 & 2032
- Table 21: Rest of Europe Firewall as a Service Industry Revenue (Million) Forecast, by Application 2019 & 2032
- Table 22: Global Firewall as a Service Industry Revenue Million Forecast, by Country 2019 & 2032
- Table 23: China Firewall as a Service Industry Revenue (Million) Forecast, by Application 2019 & 2032
- Table 24: Japan Firewall as a Service Industry Revenue (Million) Forecast, by Application 2019 & 2032
- Table 25: India Firewall as a Service Industry Revenue (Million) Forecast, by Application 2019 & 2032
- Table 26: South Korea Firewall as a Service Industry Revenue (Million) Forecast, by Application 2019 & 2032
- Table 27: Southeast Asia Firewall as a Service Industry Revenue (Million) Forecast, by Application 2019 & 2032
- Table 28: Australia Firewall as a Service Industry Revenue (Million) Forecast, by Application 2019 & 2032
- Table 29: Indonesia Firewall as a Service Industry Revenue (Million) Forecast, by Application 2019 & 2032
- Table 30: Phillipes Firewall as a Service Industry Revenue (Million) Forecast, by Application 2019 & 2032
- Table 31: Singapore Firewall as a Service Industry Revenue (Million) Forecast, by Application 2019 & 2032
- Table 32: Thailandc Firewall as a Service Industry Revenue (Million) Forecast, by Application 2019 & 2032
- Table 33: Rest of Asia Pacific Firewall as a Service Industry Revenue (Million) Forecast, by Application 2019 & 2032
- Table 34: Global Firewall as a Service Industry Revenue Million Forecast, by Country 2019 & 2032
- Table 35: Brazil Firewall as a Service Industry Revenue (Million) Forecast, by Application 2019 & 2032
- Table 36: Argentina Firewall as a Service Industry Revenue (Million) Forecast, by Application 2019 & 2032
- Table 37: Peru Firewall as a Service Industry Revenue (Million) Forecast, by Application 2019 & 2032
- Table 38: Chile Firewall as a Service Industry Revenue (Million) Forecast, by Application 2019 & 2032
- Table 39: Colombia Firewall as a Service Industry Revenue (Million) Forecast, by Application 2019 & 2032
- Table 40: Ecuador Firewall as a Service Industry Revenue (Million) Forecast, by Application 2019 & 2032
- Table 41: Venezuela Firewall as a Service Industry Revenue (Million) Forecast, by Application 2019 & 2032
- Table 42: Rest of South America Firewall as a Service Industry Revenue (Million) Forecast, by Application 2019 & 2032
- Table 43: Global Firewall as a Service Industry Revenue Million Forecast, by Country 2019 & 2032
- Table 44: United States Firewall as a Service Industry Revenue (Million) Forecast, by Application 2019 & 2032
- Table 45: Canada Firewall as a Service Industry Revenue (Million) Forecast, by Application 2019 & 2032
- Table 46: Mexico Firewall as a Service Industry Revenue (Million) Forecast, by Application 2019 & 2032
- Table 47: Global Firewall as a Service Industry Revenue Million Forecast, by Country 2019 & 2032
- Table 48: United Arab Emirates Firewall as a Service Industry Revenue (Million) Forecast, by Application 2019 & 2032
- Table 49: Saudi Arabia Firewall as a Service Industry Revenue (Million) Forecast, by Application 2019 & 2032
- Table 50: South Africa Firewall as a Service Industry Revenue (Million) Forecast, by Application 2019 & 2032
- Table 51: Rest of Middle East and Africa Firewall as a Service Industry Revenue (Million) Forecast, by Application 2019 & 2032
- Table 52: Global Firewall as a Service Industry Revenue Million Forecast, by Service Model 2019 & 2032
- Table 53: Global Firewall as a Service Industry Revenue Million Forecast, by Deployment Model 2019 & 2032
- Table 54: Global Firewall as a Service Industry Revenue Million Forecast, by User Type 2019 & 2032
- Table 55: Global Firewall as a Service Industry Revenue Million Forecast, by Industry Vertical 2019 & 2032
- Table 56: Global Firewall as a Service Industry Revenue Million Forecast, by Country 2019 & 2032
- Table 57: United States Firewall as a Service Industry Revenue (Million) Forecast, by Application 2019 & 2032
- Table 58: Canada Firewall as a Service Industry Revenue (Million) Forecast, by Application 2019 & 2032
- Table 59: Global Firewall as a Service Industry Revenue Million Forecast, by Service Model 2019 & 2032
- Table 60: Global Firewall as a Service Industry Revenue Million Forecast, by Deployment Model 2019 & 2032
- Table 61: Global Firewall as a Service Industry Revenue Million Forecast, by User Type 2019 & 2032
- Table 62: Global Firewall as a Service Industry Revenue Million Forecast, by Industry Vertical 2019 & 2032
- Table 63: Global Firewall as a Service Industry Revenue Million Forecast, by Country 2019 & 2032
- Table 64: United Kingdom Firewall as a Service Industry Revenue (Million) Forecast, by Application 2019 & 2032
- Table 65: Germany Firewall as a Service Industry Revenue (Million) Forecast, by Application 2019 & 2032
- Table 66: France Firewall as a Service Industry Revenue (Million) Forecast, by Application 2019 & 2032
- Table 67: Rest of Europe Firewall as a Service Industry Revenue (Million) Forecast, by Application 2019 & 2032
- Table 68: Global Firewall as a Service Industry Revenue Million Forecast, by Service Model 2019 & 2032
- Table 69: Global Firewall as a Service Industry Revenue Million Forecast, by Deployment Model 2019 & 2032
- Table 70: Global Firewall as a Service Industry Revenue Million Forecast, by User Type 2019 & 2032
- Table 71: Global Firewall as a Service Industry Revenue Million Forecast, by Industry Vertical 2019 & 2032
- Table 72: Global Firewall as a Service Industry Revenue Million Forecast, by Country 2019 & 2032
- Table 73: China Firewall as a Service Industry Revenue (Million) Forecast, by Application 2019 & 2032
- Table 74: Japan Firewall as a Service Industry Revenue (Million) Forecast, by Application 2019 & 2032
- Table 75: Australia Firewall as a Service Industry Revenue (Million) Forecast, by Application 2019 & 2032
- Table 76: Rest of Asia Pacific Firewall as a Service Industry Revenue (Million) Forecast, by Application 2019 & 2032
- Table 77: Global Firewall as a Service Industry Revenue Million Forecast, by Service Model 2019 & 2032
- Table 78: Global Firewall as a Service Industry Revenue Million Forecast, by Deployment Model 2019 & 2032
- Table 79: Global Firewall as a Service Industry Revenue Million Forecast, by User Type 2019 & 2032
- Table 80: Global Firewall as a Service Industry Revenue Million Forecast, by Industry Vertical 2019 & 2032
- Table 81: Global Firewall as a Service Industry Revenue Million Forecast, by Country 2019 & 2032
- Table 82: Mexico Firewall as a Service Industry Revenue (Million) Forecast, by Application 2019 & 2032
- Table 83: Brazil Firewall as a Service Industry Revenue (Million) Forecast, by Application 2019 & 2032
- Table 84: Rest of Latin America Firewall as a Service Industry Revenue (Million) Forecast, by Application 2019 & 2032
- Table 85: Global Firewall as a Service Industry Revenue Million Forecast, by Service Model 2019 & 2032
- Table 86: Global Firewall as a Service Industry Revenue Million Forecast, by Deployment Model 2019 & 2032
- Table 87: Global Firewall as a Service Industry Revenue Million Forecast, by User Type 2019 & 2032
- Table 88: Global Firewall as a Service Industry Revenue Million Forecast, by Industry Vertical 2019 & 2032
- Table 89: Global Firewall as a Service Industry Revenue Million Forecast, by Country 2019 & 2032
Frequently Asked Questions
1. What is the projected Compound Annual Growth Rate (CAGR) of the Firewall as a Service Industry?
The projected CAGR is approximately 16.47%.
2. Which companies are prominent players in the Firewall as a Service Industry?
Key companies in the market include Check Point Software Technologies Inc, Barracuda Networks Inc, Cato Networks, Fortinet Inc, Vocus Communications, IntraSystems, Cisco Systems Inc, Microsoft Corporation, Juniper Networks Inc, Zscaler Inc , Sprout Technologies Ltd, Forcepoint.
3. What are the main segments of the Firewall as a Service Industry?
The market segments include Service Model, Deployment Model, User Type, Industry Vertical.
4. Can you provide details about the market size?
The market size is estimated to be USD 4.69 Million as of 2022.
5. What are some drivers contributing to market growth?
Enormous Growth in Cloud Based Applications; Surge in Data Breaches on Public Cloud Environment; Everchanging Firewall Protocols for Business Organisations.
6. What are the notable trends driving market growth?
Public Cloud Deployment Model is Expected to Hold Significant Market Share.
7. Are there any restraints impacting market growth?
Complexity in Integrating Hosted Firewalls with On-premise Firewalls.
8. Can you provide examples of recent developments in the market?
February 2023, WatchGuard Technologies introduced the Firebox T25/T25-W, T45/T45-POE/T45-W-POE, and T85-POE tabletop firewall appliances. These new firewalls, powered by WatchGuard's Unified Security Platform architecture that offers advanced security and easy management via WatchGuard Cloud, are designed to offer the remote and distributed business environments required for better protection against network security threats.
9. What pricing options are available for accessing the report?
Pricing options include single-user, multi-user, and enterprise licenses priced at USD 4750, USD 5250, and USD 8750 respectively.
10. Is the market size provided in terms of value or volume?
The market size is provided in terms of value, measured in Million.
11. Are there any specific market keywords associated with the report?
Yes, the market keyword associated with the report is "Firewall as a Service Industry," which aids in identifying and referencing the specific market segment covered.
12. How do I determine which pricing option suits my needs best?
The pricing options vary based on user requirements and access needs. Individual users may opt for single-user licenses, while businesses requiring broader access may choose multi-user or enterprise licenses for cost-effective access to the report.
13. Are there any additional resources or data provided in the Firewall as a Service Industry report?
While the report offers comprehensive insights, it's advisable to review the specific contents or supplementary materials provided to ascertain if additional resources or data are available.
14. How can I stay updated on further developments or reports in the Firewall as a Service Industry?
To stay informed about further developments, trends, and reports in the Firewall as a Service Industry, consider subscribing to industry newsletters, following relevant companies and organizations, or regularly checking reputable industry news sources and publications.
Methodology
Step 1 - Identification of Relevant Samples Size from Population Database


Step 2 - Approaches for Defining Global Market Size (Value, Volume* & Price*)

Note*: In applicable scenarios
Step 3 - Data Sources
Primary Research
- Web Analytics
- Survey Reports
- Research Institute
- Latest Research Reports
- Opinion Leaders
Secondary Research
- Annual Reports
- White Paper
- Latest Press Release
- Industry Association
- Paid Database
- Investor Presentations

Step 4 - Data Triangulation
Involves using different sources of information in order to increase the validity of a study
These sources are likely to be stakeholders in a program - participants, other researchers, program staff, other community members, and so on.
Then we put all data in single framework & apply various statistical tools to find out the dynamic on the market.
During the analysis stage, feedback from the stakeholder groups would be compared to determine areas of agreement as well as areas of divergence
