

Key Insights
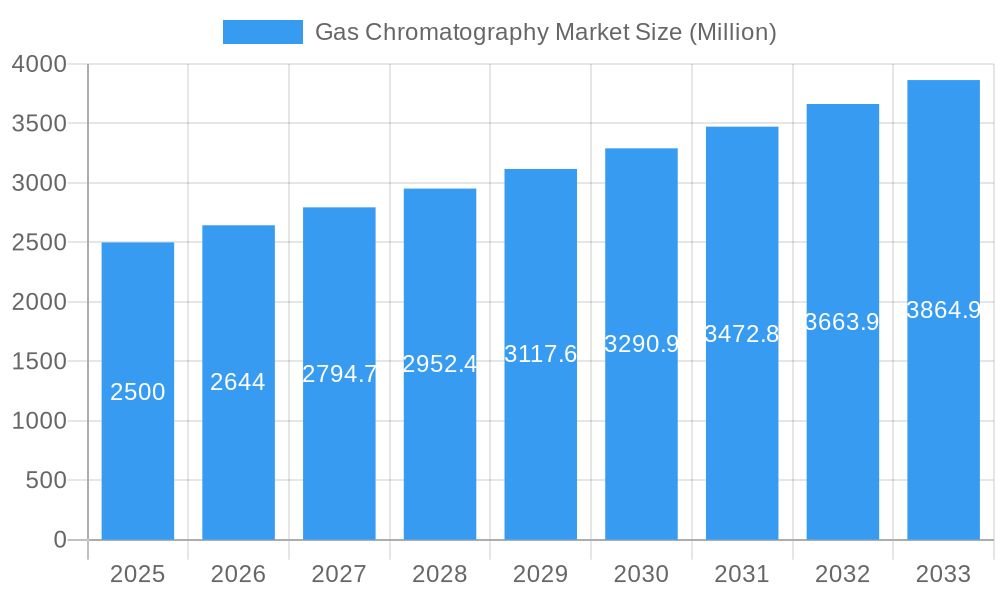
The global Gas Chromatography (GC) market, projected to reach $4.43 billion by 2025, is forecast for substantial expansion. This growth trajectory is underpinned by a Compound Annual Growth Rate (CAGR) of 6.6% from 2025 to 2033. Key drivers include escalating demand for advanced analytical solutions in pharmaceutical and biopharmaceutical sectors, driven by stringent regulatory mandates for drug quality. The expanding academic research landscape, particularly in environmental science and food safety, further fuels demand for GC systems. Technological advancements, such as miniaturization, enhanced sensitivity, and accelerated analysis, are increasing market appeal. The synergy of GC with techniques like Mass Spectrometry (GC-MS) broadens application scope. Moreover, the rising incidence of chronic diseases stimulates investment in sophisticated diagnostic equipment for clinical applications.
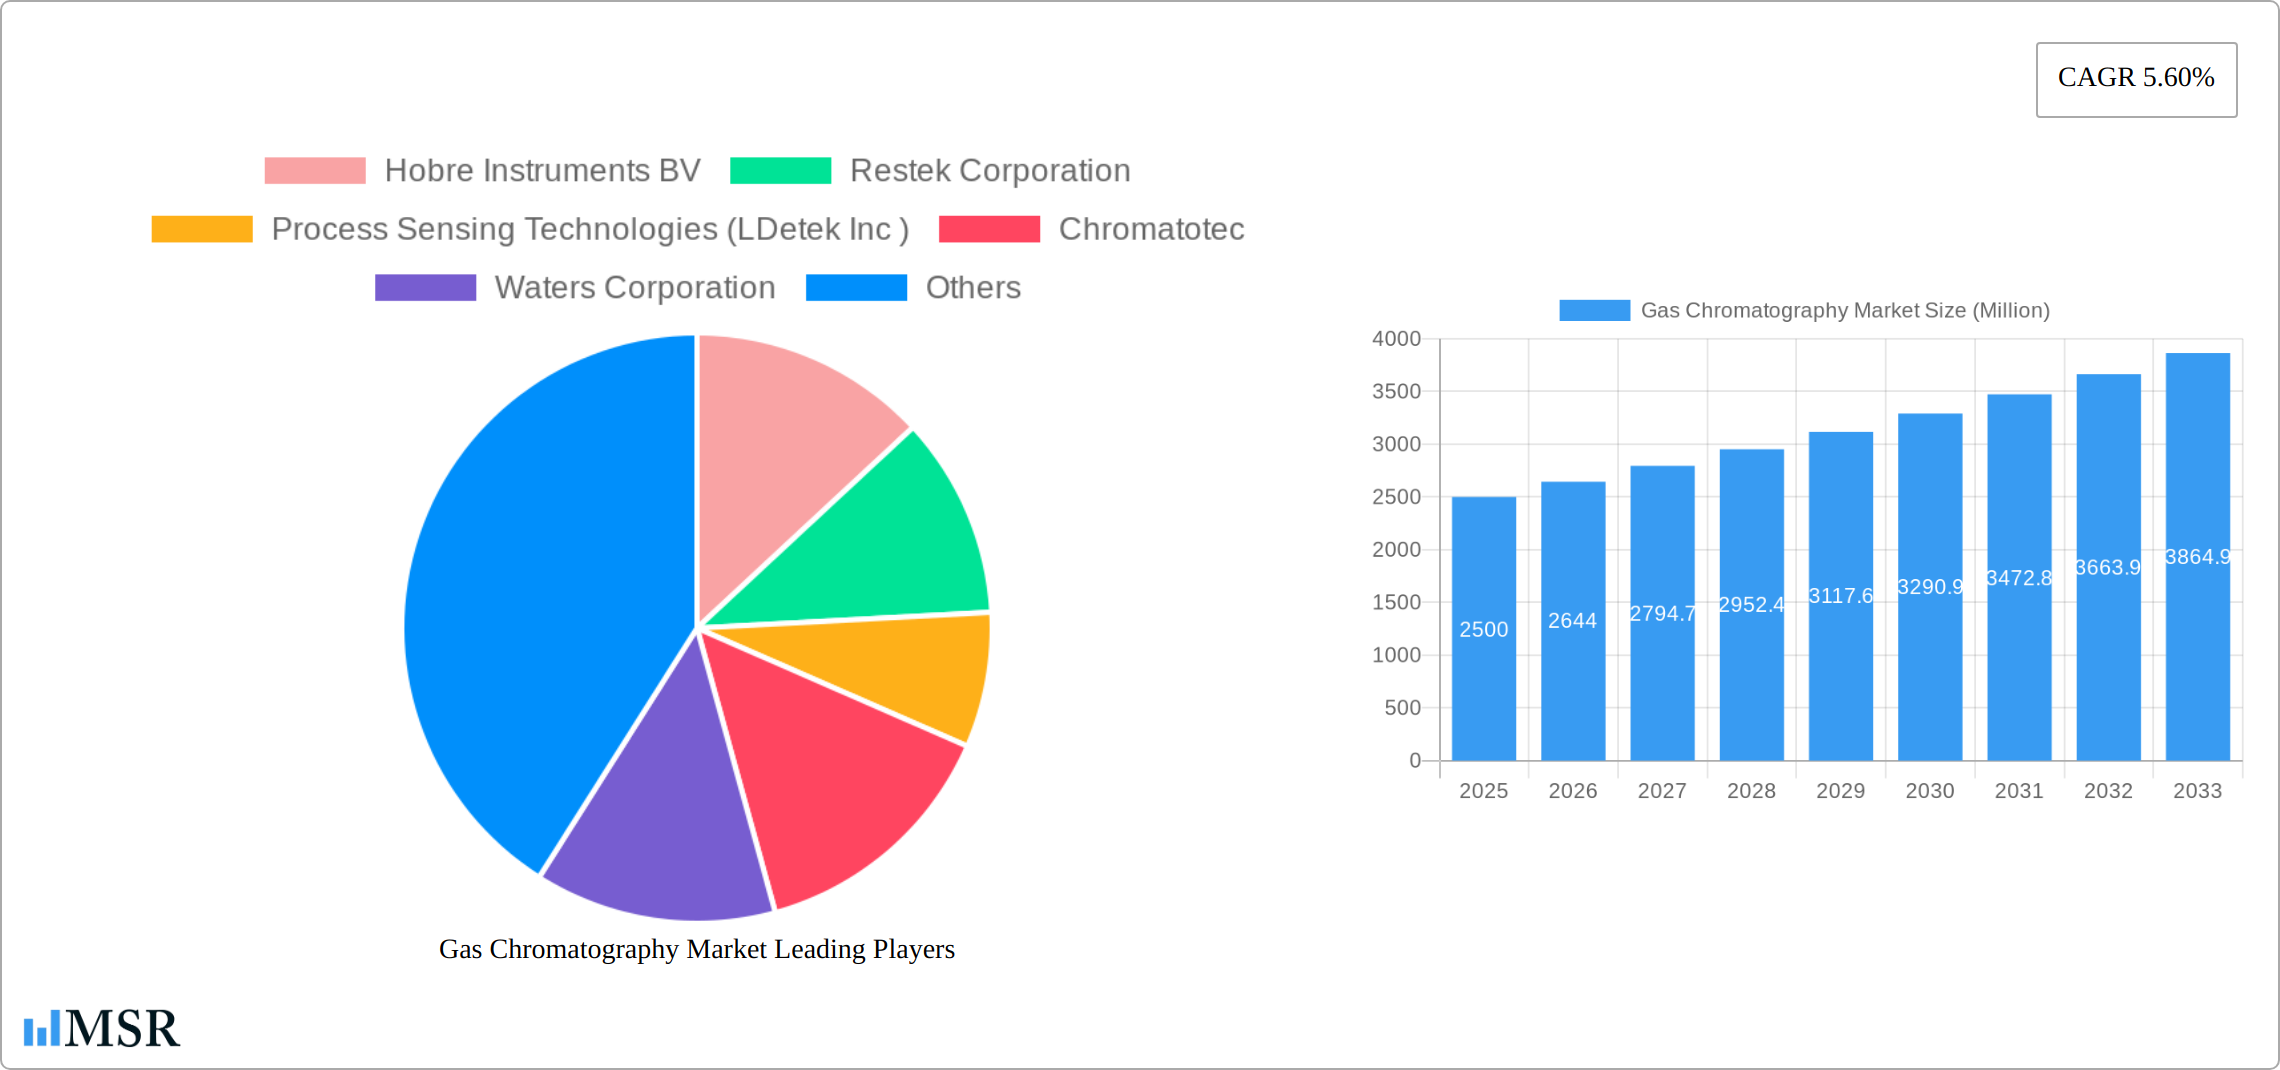
Gas Chromatography Market Market Size (In Billion)
Market growth may be moderated by factors such as significant upfront investment and maintenance costs for advanced GC systems, potentially impacting adoption by smaller entities. Competition from alternative analytical methodologies also presents a challenge. The market is segmented by product type (Systems, Detectors, Auto-samplers, Fraction Collectors, Other Products) and end-user (Pharmaceutical and Biopharmaceutical Industries, Academic Research Institutes, Other End-Users). While North America and Europe currently dominate market share, the Asia Pacific region is poised for significant growth, propelled by increased R&D activities and expanding healthcare infrastructure in key economies like China and India. Prominent market participants include Hobre Instruments BV, Restek Corporation, Process Sensing Technologies (LDetek Inc), Chromatotec, Waters Corporation, Thermo Fisher Scientific Inc, Danaher Corporation, Agilent Technologies Inc, Sartorius, Merck KgaA, PerkinElmer Inc, Scion Instruments, Air Liquide, Teledyne Technologies, and Shimadzu Corporation, all competing through innovation and strategic alliances.
Gas Chromatography Market Company Market Share
Gas Chromatography Market: A Comprehensive Report (2019-2033)
This in-depth report provides a comprehensive analysis of the Gas Chromatography market, covering market dynamics, industry trends, key segments, leading players, and future growth prospects. The study period spans from 2019 to 2033, with 2025 serving as the base and estimated year. The report offers actionable insights for stakeholders across the gas chromatography value chain, including manufacturers, researchers, and investors. The market is expected to reach xx Million by 2033, exhibiting a CAGR of xx% during the forecast period (2025-2033).
Gas Chromatography Market Concentration & Dynamics
The Gas Chromatography market is characterized by a moderately concentrated landscape, with a few major players holding significant market share. The top 10 companies account for approximately xx% of the global market. This concentration is primarily driven by the high capital investment required for R&D and manufacturing, alongside stringent regulatory requirements. Innovation ecosystems are robust, with ongoing advancements in detector technologies and software capabilities, contributing to increased sensitivity and automation.
Market Concentration Metrics:
- Top 5 Companies Market Share: xx%
- Top 10 Companies Market Share: xx%
- M&A Deal Count (2019-2024): xx
The regulatory environment varies across geographies, influencing market access and product approvals. Substitute products, such as High-Performance Liquid Chromatography (HPLC), exist, but Gas Chromatography maintains its dominance in specific applications due to its superior speed and efficiency for volatile compounds. End-user trends indicate a growing preference for automated and integrated systems, especially in the pharmaceutical and biopharmaceutical sectors.
Gas Chromatography Market Industry Insights & Trends
The global Gas Chromatography (GC) market is experiencing robust growth, driven by the burgeoning demand for precise analytical testing across diverse sectors. Pharmaceuticals, environmental monitoring, food safety, and petrochemicals are key drivers, relying on GC's ability to identify and quantify volatile compounds. The market, valued at xx Million in 2024, is projected to reach xx Million by 2033, exhibiting a Compound Annual Growth Rate (CAGR) of X%. This expansion is fueled by several factors: the development of more sensitive and faster GC systems, increasing automation to improve throughput and reduce human error, and the adoption of user-friendly software interfaces that simplify data analysis. Furthermore, evolving consumer preferences are pushing for higher-throughput analysis capabilities, contributing to market growth. Disruptive technologies, such as the integration of artificial intelligence (AI) and machine learning (ML) for advanced data analytics and predictive maintenance, are fundamentally reshaping the market landscape, enabling more efficient operations and improved decision-making. This includes AI-powered automated method development and intelligent diagnostics to minimize downtime.
Key Markets & Segments Leading Gas Chromatography Market
The pharmaceutical and biopharmaceutical industries represent the largest end-user segment in the Gas Chromatography market, driven by stringent quality control requirements and the need for precise analytical measurements in drug development and manufacturing. North America is currently the dominant region, owing to its strong pharmaceutical and biotech sectors, coupled with well-established research infrastructure.
Key Growth Drivers by Segment:
- Product: Systems segment dominates due to its high demand, followed by detectors.
- End-User: Pharmaceutical and Biopharmaceutical Industries exhibit the highest growth rate driven by regulatory compliance and increasing R&D investments.
Dominance Analysis:
North America’s market leadership is solidified by robust R&D investment, stringent regulatory environments pushing for advanced analytical capabilities, and a high density of pharmaceutical and academic institutions. However, Asia-Pacific is demonstrating rapid growth, fueled by economic expansion and increasing industrialization, especially within China and India.
Gas Chromatography Market Product Developments
Recent product innovations are focused on enhancing the core capabilities of GC systems. Miniaturization is leading to more compact and portable instruments, suitable for on-site analysis and point-of-care testing. Significant improvements in sensitivity allow for the detection of trace-level analytes, crucial for environmental monitoring and forensic science. Advanced automation features, including automated sample preparation and injection, increase throughput and minimize human intervention, improving the overall efficiency and repeatability of analyses. Intuitive software interfaces with enhanced data visualization and reporting capabilities are streamlining workflows and making GC accessible to a broader range of users. The integration of GC with mass spectrometry (GC-MS) and other complementary analytical techniques, such as headspace analysis and thermal desorption, is creating comprehensive analytical platforms capable of handling complex samples and providing more complete chemical characterizations. These integrated solutions are particularly attractive to laboratories requiring high throughput and detailed analysis of complex matrices. This trend is driving significant competition among manufacturers and fostering innovation in the field.
Challenges in the Gas Chromatography Market Market
The Gas Chromatography market faces challenges such as the high cost of instrumentation, stringent regulatory compliance requirements, and intensifying competition from other analytical techniques like HPLC. The complexity of GC systems and the need for skilled personnel represent additional barriers to entry and widespread adoption. Supply chain disruptions can impact the availability of components, influencing production and pricing.
Forces Driving Gas Chromatography Market Growth
Technological advancements, such as the development of new detectors and columns, are key growth drivers. Increased demand for environmental monitoring and food safety testing, coupled with stringent regulatory requirements, fuels market expansion. Economic growth in emerging economies drives investments in analytical infrastructure, creating new opportunities.
Long-Term Growth Catalysts in Gas Chromatography Market
Long-term growth will be propelled by ongoing innovations in miniaturization, automation, and software integration, enhancing ease of use and efficiency. Strategic partnerships between instrument manufacturers and software developers will further expand the application scope of Gas Chromatography. Expansion into new markets, including those in emerging economies, will continue driving growth.
Emerging Opportunities in Gas Chromatography Market
Emerging opportunities include the development of portable and handheld GC systems for field analysis, the integration of AI and ML for improved data interpretation, and the expansion into new application areas, such as environmental remediation and forensic science. The development of more environmentally friendly solvents and the increased demand for high-throughput analysis contribute to further opportunities.
Leading Players in the Gas Chromatography Market Sector
- Hobre Instruments BV
- Restek Corporation
- Process Sensing Technologies (LDetek Inc)
- Chromatotec
- Waters Corporation
- Thermo Fisher Scientific Inc
- Danaher Corporation
- Agilent Technologies Inc
- Sartorius
- Merck KgaA
- PerkinElmer Inc
- Scion Instruments
- Air Liquide
- Teledyne Technologies
- Shimadzu Corporation
Key Milestones in Gas Chromatography Market Industry
- June 2022: PerkinElmer, Inc. launched the GC 2400 Platform, an advanced automated GC, headspace sampler, and GC-MS solution. This launch signifies a step towards streamlined lab workflows and enhanced analytical capabilities, boosting market competition and impacting user preference.
- March 2022: Thermo Fisher Scientific launched a collection of new GC and GC-MS instruments with innovative hardware and software updates. This reflects a continuous drive towards enhanced performance and user experience within the competitive landscape.
Strategic Outlook for Gas Chromatography Market Market
The Gas Chromatography market presents significant growth potential driven by continuous technological advancements, expanding application areas, and increasing demand in various sectors. Strategic partnerships, focused R&D, and expansion into emerging economies will be critical for companies to capitalize on future market opportunities and establish a strong competitive presence.
Gas Chromatography Market Segmentation
-
1. Product
- 1.1. Systems
- 1.2. Detectors
- 1.3. Auto-samplers
- 1.4. Fraction Collectors
- 1.5. Other Products
-
2. End-User
- 2.1. Pharmaceutical and Biopharmaceutical Industries
- 2.2. Academic Research Institutes
- 2.3. Other End-Users
Gas Chromatography Market Segmentation By Geography
-
1. North America
- 1.1. United States
- 1.2. Canada
- 1.3. Mexico
-
2. Europe
- 2.1. Germany
- 2.2. United Kingdom
- 2.3. France
- 2.4. Italy
- 2.5. Spain
- 2.6. Rest of Europe
-
3. Asia Pacific
- 3.1. China
- 3.2. Japan
- 3.3. India
- 3.4. Australia
- 3.5. South korea
- 3.6. Rest of Asia Pacific
-
4. Middle East and Africa
- 4.1. GCC
- 4.2. South Africa
- 4.3. Rest of Middle East and Africa
-
5. South America
- 5.1. Brazil
- 5.2. Argentina
- 5.3. Rest of South America
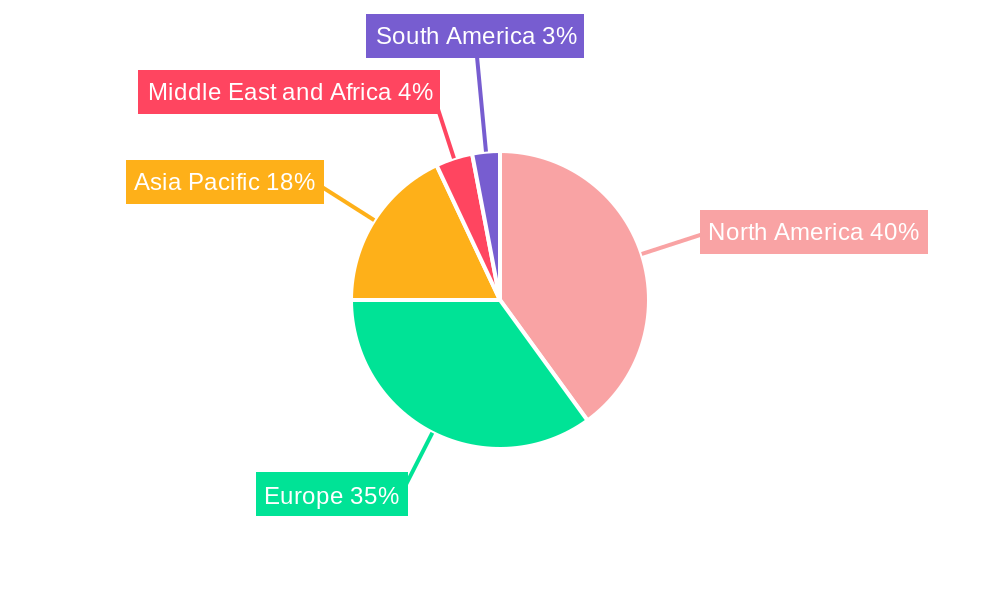
Gas Chromatography Market Regional Market Share
Geographic Coverage of Gas Chromatography Market
Gas Chromatography Market REPORT HIGHLIGHTS
| Aspects | Details |
|---|---|
| Study Period | 2020-2034 |
| Base Year | 2025 |
| Estimated Year | 2026 |
| Forecast Period | 2026-2034 |
| Historical Period | 2020-2025 |
| Growth Rate | CAGR of 6.6% from 2020-2034 |
| Segmentation |
|
Table of Contents
- 1. Introduction
- 1.1. Research Scope
- 1.2. Market Segmentation
- 1.3. Research Objective
- 1.4. Definitions and Assumptions
- 2. Executive Summary
- 2.1. Market Snapshot
- 3. Market Dynamics
- 3.1. Market Drivers
- 3.2. Market Restrains
- 3.3. Market Trends
- 3.4. Market Opportunities
- 4. Market Factor Analysis
- 4.1. Porters Five Forces
- 4.1.1. Bargaining Power of Suppliers
- 4.1.2. Bargaining Power of Buyers
- 4.1.3. Threat of New Entrants
- 4.1.4. Threat of Substitutes
- 4.1.5. Competitive Rivalry
- 4.2. PESTEL analysis
- 4.3. BCG Analysis
- 4.3.1. Stars (High Growth, High Market Share)
- 4.3.2. Cash Cows (Low Growth, High Market Share)
- 4.3.3. Question Mark (High Growth, Low Market Share)
- 4.3.4. Dogs (Low Growth, Low Market Share)
- 4.4. Ansoff Matrix Analysis
- 4.5. Supply Chain Analysis
- 4.6. Regulatory Landscape
- 4.7. Current Market Potential and Opportunity Assessment (TAM–SAM–SOM Framework)
- 4.8. MSR Analyst Note
- 4.1. Porters Five Forces
- 5. Market Analysis, Insights and Forecast 2021-2033
- 5.1. Market Analysis, Insights and Forecast - by Product
- 5.1.1. Systems
- 5.1.2. Detectors
- 5.1.3. Auto-samplers
- 5.1.4. Fraction Collectors
- 5.1.5. Other Products
- 5.2. Market Analysis, Insights and Forecast - by End-User
- 5.2.1. Pharmaceutical and Biopharmaceutical Industries
- 5.2.2. Academic Research Institutes
- 5.2.3. Other End-Users
- 5.3. Market Analysis, Insights and Forecast - by Region
- 5.3.1. North America
- 5.3.2. Europe
- 5.3.3. Asia Pacific
- 5.3.4. Middle East and Africa
- 5.3.5. South America
- 5.1. Market Analysis, Insights and Forecast - by Product
- 6. Global Gas Chromatography Market Analysis, Insights and Forecast, 2021-2033
- 6.1. Market Analysis, Insights and Forecast - by Product
- 6.1.1. Systems
- 6.1.2. Detectors
- 6.1.3. Auto-samplers
- 6.1.4. Fraction Collectors
- 6.1.5. Other Products
- 6.2. Market Analysis, Insights and Forecast - by End-User
- 6.2.1. Pharmaceutical and Biopharmaceutical Industries
- 6.2.2. Academic Research Institutes
- 6.2.3. Other End-Users
- 6.1. Market Analysis, Insights and Forecast - by Product
- 7. North America Gas Chromatography Market Analysis, Insights and Forecast, 2020-2032
- 7.1. Market Analysis, Insights and Forecast - by Product
- 7.1.1. Systems
- 7.1.2. Detectors
- 7.1.3. Auto-samplers
- 7.1.4. Fraction Collectors
- 7.1.5. Other Products
- 7.2. Market Analysis, Insights and Forecast - by End-User
- 7.2.1. Pharmaceutical and Biopharmaceutical Industries
- 7.2.2. Academic Research Institutes
- 7.2.3. Other End-Users
- 7.1. Market Analysis, Insights and Forecast - by Product
- 8. Europe Gas Chromatography Market Analysis, Insights and Forecast, 2020-2032
- 8.1. Market Analysis, Insights and Forecast - by Product
- 8.1.1. Systems
- 8.1.2. Detectors
- 8.1.3. Auto-samplers
- 8.1.4. Fraction Collectors
- 8.1.5. Other Products
- 8.2. Market Analysis, Insights and Forecast - by End-User
- 8.2.1. Pharmaceutical and Biopharmaceutical Industries
- 8.2.2. Academic Research Institutes
- 8.2.3. Other End-Users
- 8.1. Market Analysis, Insights and Forecast - by Product
- 9. Asia Pacific Gas Chromatography Market Analysis, Insights and Forecast, 2020-2032
- 9.1. Market Analysis, Insights and Forecast - by Product
- 9.1.1. Systems
- 9.1.2. Detectors
- 9.1.3. Auto-samplers
- 9.1.4. Fraction Collectors
- 9.1.5. Other Products
- 9.2. Market Analysis, Insights and Forecast - by End-User
- 9.2.1. Pharmaceutical and Biopharmaceutical Industries
- 9.2.2. Academic Research Institutes
- 9.2.3. Other End-Users
- 9.1. Market Analysis, Insights and Forecast - by Product
- 10. Middle East and Africa Gas Chromatography Market Analysis, Insights and Forecast, 2020-2032
- 10.1. Market Analysis, Insights and Forecast - by Product
- 10.1.1. Systems
- 10.1.2. Detectors
- 10.1.3. Auto-samplers
- 10.1.4. Fraction Collectors
- 10.1.5. Other Products
- 10.2. Market Analysis, Insights and Forecast - by End-User
- 10.2.1. Pharmaceutical and Biopharmaceutical Industries
- 10.2.2. Academic Research Institutes
- 10.2.3. Other End-Users
- 10.1. Market Analysis, Insights and Forecast - by Product
- 11. South America Gas Chromatography Market Analysis, Insights and Forecast, 2020-2032
- 11.1. Market Analysis, Insights and Forecast - by Product
- 11.1.1. Systems
- 11.1.2. Detectors
- 11.1.3. Auto-samplers
- 11.1.4. Fraction Collectors
- 11.1.5. Other Products
- 11.2. Market Analysis, Insights and Forecast - by End-User
- 11.2.1. Pharmaceutical and Biopharmaceutical Industries
- 11.2.2. Academic Research Institutes
- 11.2.3. Other End-Users
- 11.1. Market Analysis, Insights and Forecast - by Product
- 12. Competitive Analysis
- 12.1. Company Profiles
- 12.1.1 Hobre Instruments BV
- 12.1.1.1. Company Overview
- 12.1.1.2. Products
- 12.1.1.3. Company Financials
- 12.1.1.4. SWOT Analysis
- 12.1.2 Restek Corporation
- 12.1.2.1. Company Overview
- 12.1.2.2. Products
- 12.1.2.3. Company Financials
- 12.1.2.4. SWOT Analysis
- 12.1.3 Process Sensing Technologies (LDetek Inc )
- 12.1.3.1. Company Overview
- 12.1.3.2. Products
- 12.1.3.3. Company Financials
- 12.1.3.4. SWOT Analysis
- 12.1.4 Chromatotec
- 12.1.4.1. Company Overview
- 12.1.4.2. Products
- 12.1.4.3. Company Financials
- 12.1.4.4. SWOT Analysis
- 12.1.5 Waters Corporation
- 12.1.5.1. Company Overview
- 12.1.5.2. Products
- 12.1.5.3. Company Financials
- 12.1.5.4. SWOT Analysis
- 12.1.6 Thermo Fisher Scientific Inc
- 12.1.6.1. Company Overview
- 12.1.6.2. Products
- 12.1.6.3. Company Financials
- 12.1.6.4. SWOT Analysis
- 12.1.7 Danaher Corporation
- 12.1.7.1. Company Overview
- 12.1.7.2. Products
- 12.1.7.3. Company Financials
- 12.1.7.4. SWOT Analysis
- 12.1.8 Agilent Technologies Inc
- 12.1.8.1. Company Overview
- 12.1.8.2. Products
- 12.1.8.3. Company Financials
- 12.1.8.4. SWOT Analysis
- 12.1.9 Sartorius
- 12.1.9.1. Company Overview
- 12.1.9.2. Products
- 12.1.9.3. Company Financials
- 12.1.9.4. SWOT Analysis
- 12.1.10 Merck KgaA
- 12.1.10.1. Company Overview
- 12.1.10.2. Products
- 12.1.10.3. Company Financials
- 12.1.10.4. SWOT Analysis
- 12.1.11 PerkinElmer Inc
- 12.1.11.1. Company Overview
- 12.1.11.2. Products
- 12.1.11.3. Company Financials
- 12.1.11.4. SWOT Analysis
- 12.1.12 Scion Instruments
- 12.1.12.1. Company Overview
- 12.1.12.2. Products
- 12.1.12.3. Company Financials
- 12.1.12.4. SWOT Analysis
- 12.1.13 Air Liquide
- 12.1.13.1. Company Overview
- 12.1.13.2. Products
- 12.1.13.3. Company Financials
- 12.1.13.4. SWOT Analysis
- 12.1.14 Teledyne Technologies
- 12.1.14.1. Company Overview
- 12.1.14.2. Products
- 12.1.14.3. Company Financials
- 12.1.14.4. SWOT Analysis
- 12.1.15 Shimadzu Corporation
- 12.1.15.1. Company Overview
- 12.1.15.2. Products
- 12.1.15.3. Company Financials
- 12.1.15.4. SWOT Analysis
- 12.1.1 Hobre Instruments BV
- 12.2. Market Entropy
- 12.2.1 Company's Key Areas Served
- 12.2.2 Recent Developments
- 12.3. Company Market Share Analysis 2025
- 12.3.1 Top 5 Companies Market Share Analysis
- 12.3.2 Top 3 Companies Market Share Analysis
- 12.4. List of Potential Customers
- 13. Research Methodology
List of Figures
- Figure 1: Global Gas Chromatography Market Revenue Breakdown (billion, %) by Region 2025 & 2033
- Figure 2: Global Gas Chromatography Market Volume Breakdown (K Unit, %) by Region 2025 & 2033
- Figure 3: North America Gas Chromatography Market Revenue (billion), by Product 2025 & 2033
- Figure 4: North America Gas Chromatography Market Volume (K Unit), by Product 2025 & 2033
- Figure 5: North America Gas Chromatography Market Revenue Share (%), by Product 2025 & 2033
- Figure 6: North America Gas Chromatography Market Volume Share (%), by Product 2025 & 2033
- Figure 7: North America Gas Chromatography Market Revenue (billion), by End-User 2025 & 2033
- Figure 8: North America Gas Chromatography Market Volume (K Unit), by End-User 2025 & 2033
- Figure 9: North America Gas Chromatography Market Revenue Share (%), by End-User 2025 & 2033
- Figure 10: North America Gas Chromatography Market Volume Share (%), by End-User 2025 & 2033
- Figure 11: North America Gas Chromatography Market Revenue (billion), by Country 2025 & 2033
- Figure 12: North America Gas Chromatography Market Volume (K Unit), by Country 2025 & 2033
- Figure 13: North America Gas Chromatography Market Revenue Share (%), by Country 2025 & 2033
- Figure 14: North America Gas Chromatography Market Volume Share (%), by Country 2025 & 2033
- Figure 15: Europe Gas Chromatography Market Revenue (billion), by Product 2025 & 2033
- Figure 16: Europe Gas Chromatography Market Volume (K Unit), by Product 2025 & 2033
- Figure 17: Europe Gas Chromatography Market Revenue Share (%), by Product 2025 & 2033
- Figure 18: Europe Gas Chromatography Market Volume Share (%), by Product 2025 & 2033
- Figure 19: Europe Gas Chromatography Market Revenue (billion), by End-User 2025 & 2033
- Figure 20: Europe Gas Chromatography Market Volume (K Unit), by End-User 2025 & 2033
- Figure 21: Europe Gas Chromatography Market Revenue Share (%), by End-User 2025 & 2033
- Figure 22: Europe Gas Chromatography Market Volume Share (%), by End-User 2025 & 2033
- Figure 23: Europe Gas Chromatography Market Revenue (billion), by Country 2025 & 2033
- Figure 24: Europe Gas Chromatography Market Volume (K Unit), by Country 2025 & 2033
- Figure 25: Europe Gas Chromatography Market Revenue Share (%), by Country 2025 & 2033
- Figure 26: Europe Gas Chromatography Market Volume Share (%), by Country 2025 & 2033
- Figure 27: Asia Pacific Gas Chromatography Market Revenue (billion), by Product 2025 & 2033
- Figure 28: Asia Pacific Gas Chromatography Market Volume (K Unit), by Product 2025 & 2033
- Figure 29: Asia Pacific Gas Chromatography Market Revenue Share (%), by Product 2025 & 2033
- Figure 30: Asia Pacific Gas Chromatography Market Volume Share (%), by Product 2025 & 2033
- Figure 31: Asia Pacific Gas Chromatography Market Revenue (billion), by End-User 2025 & 2033
- Figure 32: Asia Pacific Gas Chromatography Market Volume (K Unit), by End-User 2025 & 2033
- Figure 33: Asia Pacific Gas Chromatography Market Revenue Share (%), by End-User 2025 & 2033
- Figure 34: Asia Pacific Gas Chromatography Market Volume Share (%), by End-User 2025 & 2033
- Figure 35: Asia Pacific Gas Chromatography Market Revenue (billion), by Country 2025 & 2033
- Figure 36: Asia Pacific Gas Chromatography Market Volume (K Unit), by Country 2025 & 2033
- Figure 37: Asia Pacific Gas Chromatography Market Revenue Share (%), by Country 2025 & 2033
- Figure 38: Asia Pacific Gas Chromatography Market Volume Share (%), by Country 2025 & 2033
- Figure 39: Middle East and Africa Gas Chromatography Market Revenue (billion), by Product 2025 & 2033
- Figure 40: Middle East and Africa Gas Chromatography Market Volume (K Unit), by Product 2025 & 2033
- Figure 41: Middle East and Africa Gas Chromatography Market Revenue Share (%), by Product 2025 & 2033
- Figure 42: Middle East and Africa Gas Chromatography Market Volume Share (%), by Product 2025 & 2033
- Figure 43: Middle East and Africa Gas Chromatography Market Revenue (billion), by End-User 2025 & 2033
- Figure 44: Middle East and Africa Gas Chromatography Market Volume (K Unit), by End-User 2025 & 2033
- Figure 45: Middle East and Africa Gas Chromatography Market Revenue Share (%), by End-User 2025 & 2033
- Figure 46: Middle East and Africa Gas Chromatography Market Volume Share (%), by End-User 2025 & 2033
- Figure 47: Middle East and Africa Gas Chromatography Market Revenue (billion), by Country 2025 & 2033
- Figure 48: Middle East and Africa Gas Chromatography Market Volume (K Unit), by Country 2025 & 2033
- Figure 49: Middle East and Africa Gas Chromatography Market Revenue Share (%), by Country 2025 & 2033
- Figure 50: Middle East and Africa Gas Chromatography Market Volume Share (%), by Country 2025 & 2033
- Figure 51: South America Gas Chromatography Market Revenue (billion), by Product 2025 & 2033
- Figure 52: South America Gas Chromatography Market Volume (K Unit), by Product 2025 & 2033
- Figure 53: South America Gas Chromatography Market Revenue Share (%), by Product 2025 & 2033
- Figure 54: South America Gas Chromatography Market Volume Share (%), by Product 2025 & 2033
- Figure 55: South America Gas Chromatography Market Revenue (billion), by End-User 2025 & 2033
- Figure 56: South America Gas Chromatography Market Volume (K Unit), by End-User 2025 & 2033
- Figure 57: South America Gas Chromatography Market Revenue Share (%), by End-User 2025 & 2033
- Figure 58: South America Gas Chromatography Market Volume Share (%), by End-User 2025 & 2033
- Figure 59: South America Gas Chromatography Market Revenue (billion), by Country 2025 & 2033
- Figure 60: South America Gas Chromatography Market Volume (K Unit), by Country 2025 & 2033
- Figure 61: South America Gas Chromatography Market Revenue Share (%), by Country 2025 & 2033
- Figure 62: South America Gas Chromatography Market Volume Share (%), by Country 2025 & 2033
List of Tables
- Table 1: Global Gas Chromatography Market Revenue billion Forecast, by Product 2020 & 2033
- Table 2: Global Gas Chromatography Market Volume K Unit Forecast, by Product 2020 & 2033
- Table 3: Global Gas Chromatography Market Revenue billion Forecast, by End-User 2020 & 2033
- Table 4: Global Gas Chromatography Market Volume K Unit Forecast, by End-User 2020 & 2033
- Table 5: Global Gas Chromatography Market Revenue billion Forecast, by Region 2020 & 2033
- Table 6: Global Gas Chromatography Market Volume K Unit Forecast, by Region 2020 & 2033
- Table 7: Global Gas Chromatography Market Revenue billion Forecast, by Product 2020 & 2033
- Table 8: Global Gas Chromatography Market Volume K Unit Forecast, by Product 2020 & 2033
- Table 9: Global Gas Chromatography Market Revenue billion Forecast, by End-User 2020 & 2033
- Table 10: Global Gas Chromatography Market Volume K Unit Forecast, by End-User 2020 & 2033
- Table 11: Global Gas Chromatography Market Revenue billion Forecast, by Country 2020 & 2033
- Table 12: Global Gas Chromatography Market Volume K Unit Forecast, by Country 2020 & 2033
- Table 13: United States Gas Chromatography Market Revenue (billion) Forecast, by Application 2020 & 2033
- Table 14: United States Gas Chromatography Market Volume (K Unit) Forecast, by Application 2020 & 2033
- Table 15: Canada Gas Chromatography Market Revenue (billion) Forecast, by Application 2020 & 2033
- Table 16: Canada Gas Chromatography Market Volume (K Unit) Forecast, by Application 2020 & 2033
- Table 17: Mexico Gas Chromatography Market Revenue (billion) Forecast, by Application 2020 & 2033
- Table 18: Mexico Gas Chromatography Market Volume (K Unit) Forecast, by Application 2020 & 2033
- Table 19: Global Gas Chromatography Market Revenue billion Forecast, by Product 2020 & 2033
- Table 20: Global Gas Chromatography Market Volume K Unit Forecast, by Product 2020 & 2033
- Table 21: Global Gas Chromatography Market Revenue billion Forecast, by End-User 2020 & 2033
- Table 22: Global Gas Chromatography Market Volume K Unit Forecast, by End-User 2020 & 2033
- Table 23: Global Gas Chromatography Market Revenue billion Forecast, by Country 2020 & 2033
- Table 24: Global Gas Chromatography Market Volume K Unit Forecast, by Country 2020 & 2033
- Table 25: Germany Gas Chromatography Market Revenue (billion) Forecast, by Application 2020 & 2033
- Table 26: Germany Gas Chromatography Market Volume (K Unit) Forecast, by Application 2020 & 2033
- Table 27: United Kingdom Gas Chromatography Market Revenue (billion) Forecast, by Application 2020 & 2033
- Table 28: United Kingdom Gas Chromatography Market Volume (K Unit) Forecast, by Application 2020 & 2033
- Table 29: France Gas Chromatography Market Revenue (billion) Forecast, by Application 2020 & 2033
- Table 30: France Gas Chromatography Market Volume (K Unit) Forecast, by Application 2020 & 2033
- Table 31: Italy Gas Chromatography Market Revenue (billion) Forecast, by Application 2020 & 2033
- Table 32: Italy Gas Chromatography Market Volume (K Unit) Forecast, by Application 2020 & 2033
- Table 33: Spain Gas Chromatography Market Revenue (billion) Forecast, by Application 2020 & 2033
- Table 34: Spain Gas Chromatography Market Volume (K Unit) Forecast, by Application 2020 & 2033
- Table 35: Rest of Europe Gas Chromatography Market Revenue (billion) Forecast, by Application 2020 & 2033
- Table 36: Rest of Europe Gas Chromatography Market Volume (K Unit) Forecast, by Application 2020 & 2033
- Table 37: Global Gas Chromatography Market Revenue billion Forecast, by Product 2020 & 2033
- Table 38: Global Gas Chromatography Market Volume K Unit Forecast, by Product 2020 & 2033
- Table 39: Global Gas Chromatography Market Revenue billion Forecast, by End-User 2020 & 2033
- Table 40: Global Gas Chromatography Market Volume K Unit Forecast, by End-User 2020 & 2033
- Table 41: Global Gas Chromatography Market Revenue billion Forecast, by Country 2020 & 2033
- Table 42: Global Gas Chromatography Market Volume K Unit Forecast, by Country 2020 & 2033
- Table 43: China Gas Chromatography Market Revenue (billion) Forecast, by Application 2020 & 2033
- Table 44: China Gas Chromatography Market Volume (K Unit) Forecast, by Application 2020 & 2033
- Table 45: Japan Gas Chromatography Market Revenue (billion) Forecast, by Application 2020 & 2033
- Table 46: Japan Gas Chromatography Market Volume (K Unit) Forecast, by Application 2020 & 2033
- Table 47: India Gas Chromatography Market Revenue (billion) Forecast, by Application 2020 & 2033
- Table 48: India Gas Chromatography Market Volume (K Unit) Forecast, by Application 2020 & 2033
- Table 49: Australia Gas Chromatography Market Revenue (billion) Forecast, by Application 2020 & 2033
- Table 50: Australia Gas Chromatography Market Volume (K Unit) Forecast, by Application 2020 & 2033
- Table 51: South korea Gas Chromatography Market Revenue (billion) Forecast, by Application 2020 & 2033
- Table 52: South korea Gas Chromatography Market Volume (K Unit) Forecast, by Application 2020 & 2033
- Table 53: Rest of Asia Pacific Gas Chromatography Market Revenue (billion) Forecast, by Application 2020 & 2033
- Table 54: Rest of Asia Pacific Gas Chromatography Market Volume (K Unit) Forecast, by Application 2020 & 2033
- Table 55: Global Gas Chromatography Market Revenue billion Forecast, by Product 2020 & 2033
- Table 56: Global Gas Chromatography Market Volume K Unit Forecast, by Product 2020 & 2033
- Table 57: Global Gas Chromatography Market Revenue billion Forecast, by End-User 2020 & 2033
- Table 58: Global Gas Chromatography Market Volume K Unit Forecast, by End-User 2020 & 2033
- Table 59: Global Gas Chromatography Market Revenue billion Forecast, by Country 2020 & 2033
- Table 60: Global Gas Chromatography Market Volume K Unit Forecast, by Country 2020 & 2033
- Table 61: GCC Gas Chromatography Market Revenue (billion) Forecast, by Application 2020 & 2033
- Table 62: GCC Gas Chromatography Market Volume (K Unit) Forecast, by Application 2020 & 2033
- Table 63: South Africa Gas Chromatography Market Revenue (billion) Forecast, by Application 2020 & 2033
- Table 64: South Africa Gas Chromatography Market Volume (K Unit) Forecast, by Application 2020 & 2033
- Table 65: Rest of Middle East and Africa Gas Chromatography Market Revenue (billion) Forecast, by Application 2020 & 2033
- Table 66: Rest of Middle East and Africa Gas Chromatography Market Volume (K Unit) Forecast, by Application 2020 & 2033
- Table 67: Global Gas Chromatography Market Revenue billion Forecast, by Product 2020 & 2033
- Table 68: Global Gas Chromatography Market Volume K Unit Forecast, by Product 2020 & 2033
- Table 69: Global Gas Chromatography Market Revenue billion Forecast, by End-User 2020 & 2033
- Table 70: Global Gas Chromatography Market Volume K Unit Forecast, by End-User 2020 & 2033
- Table 71: Global Gas Chromatography Market Revenue billion Forecast, by Country 2020 & 2033
- Table 72: Global Gas Chromatography Market Volume K Unit Forecast, by Country 2020 & 2033
- Table 73: Brazil Gas Chromatography Market Revenue (billion) Forecast, by Application 2020 & 2033
- Table 74: Brazil Gas Chromatography Market Volume (K Unit) Forecast, by Application 2020 & 2033
- Table 75: Argentina Gas Chromatography Market Revenue (billion) Forecast, by Application 2020 & 2033
- Table 76: Argentina Gas Chromatography Market Volume (K Unit) Forecast, by Application 2020 & 2033
- Table 77: Rest of South America Gas Chromatography Market Revenue (billion) Forecast, by Application 2020 & 2033
- Table 78: Rest of South America Gas Chromatography Market Volume (K Unit) Forecast, by Application 2020 & 2033
Frequently Asked Questions
1. What is the projected Compound Annual Growth Rate (CAGR) of the Gas Chromatography Market?
The projected CAGR is approximately 6.6%.
2. Which companies are prominent players in the Gas Chromatography Market?
Key companies in the market include Hobre Instruments BV, Restek Corporation, Process Sensing Technologies (LDetek Inc ), Chromatotec, Waters Corporation, Thermo Fisher Scientific Inc, Danaher Corporation, Agilent Technologies Inc, Sartorius, Merck KgaA, PerkinElmer Inc, Scion Instruments, Air Liquide, Teledyne Technologies, Shimadzu Corporation.
3. What are the main segments of the Gas Chromatography Market?
The market segments include Product, End-User.
4. Can you provide details about the market size?
The market size is estimated to be USD 4.43 billion as of 2022.
5. What are some drivers contributing to market growth?
Growing Importance of Chromatography Tests in the Drug Approval Process; Rising Adoption of Gas Chromatography-Mass Spectroscopy (GC-MS).
6. What are the notable trends driving market growth?
Pharmaceutical and Bioindustries is Expected to Hold a Significant Market Share Over the Forecast Period.
7. Are there any restraints impacting market growth?
High Cost of Gas Chromatography Equipment; Lack of Skilled Professionals.
8. Can you provide examples of recent developments in the market?
June 2022: PerkinElmer, Inc. launched the GC 2400 Platform, an advanced, automated gas chromatography (GC), headspace sampler, and GC-MS solution designed to help lab teams simplify lab operations, drive precise results, and perform more flexible monitoring.
9. What pricing options are available for accessing the report?
Pricing options include single-user, multi-user, and enterprise licenses priced at USD 4750, USD 5250, and USD 8750 respectively.
10. Is the market size provided in terms of value or volume?
The market size is provided in terms of value, measured in billion and volume, measured in K Unit.
11. Are there any specific market keywords associated with the report?
Yes, the market keyword associated with the report is "Gas Chromatography Market," which aids in identifying and referencing the specific market segment covered.
12. How do I determine which pricing option suits my needs best?
The pricing options vary based on user requirements and access needs. Individual users may opt for single-user licenses, while businesses requiring broader access may choose multi-user or enterprise licenses for cost-effective access to the report.
13. Are there any additional resources or data provided in the Gas Chromatography Market report?
While the report offers comprehensive insights, it's advisable to review the specific contents or supplementary materials provided to ascertain if additional resources or data are available.
14. How can I stay updated on further developments or reports in the Gas Chromatography Market?
To stay informed about further developments, trends, and reports in the Gas Chromatography Market, consider subscribing to industry newsletters, following relevant companies and organizations, or regularly checking reputable industry news sources and publications.
Methodology
Step 1 - Identification of Relevant Samples Size from Population Database


Step 2 - Approaches for Defining Global Market Size (Value, Volume* & Price*)

Note*: In applicable scenarios
Step 3 - Data Sources
Primary Research
- Web Analytics
- Survey Reports
- Research Institute
- Latest Research Reports
- Opinion Leaders
Secondary Research
- Annual Reports
- White Paper
- Latest Press Release
- Industry Association
- Paid Database
- Investor Presentations

Step 4 - Data Triangulation
Involves using different sources of information in order to increase the validity of a study
These sources are likely to be stakeholders in a program - participants, other researchers, program staff, other community members, and so on.
Then we put all data in single framework & apply various statistical tools to find out the dynamic on the market.
During the analysis stage, feedback from the stakeholder groups would be compared to determine areas of agreement as well as areas of divergence