

Key Insights
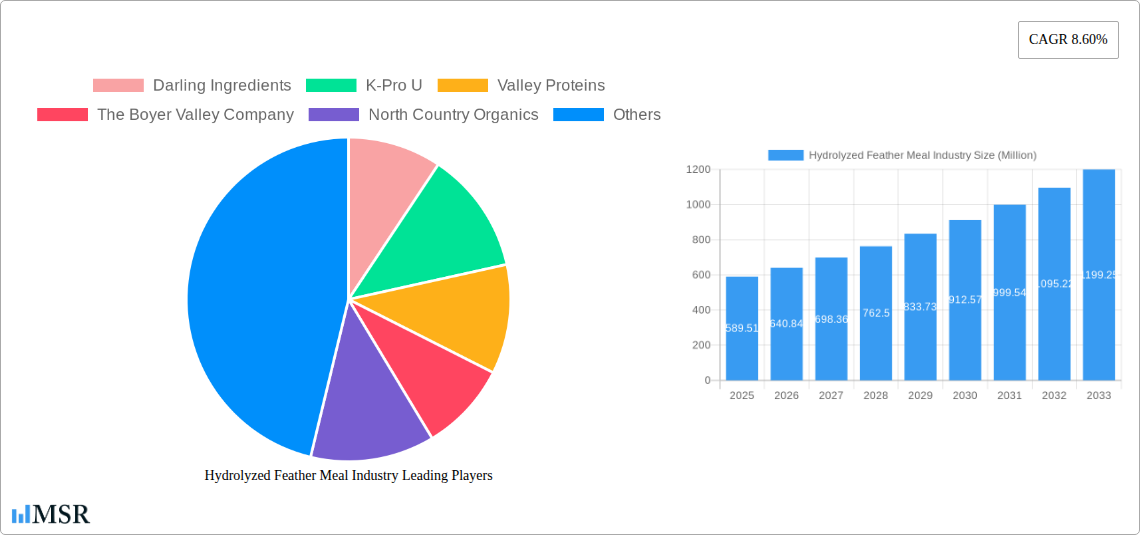
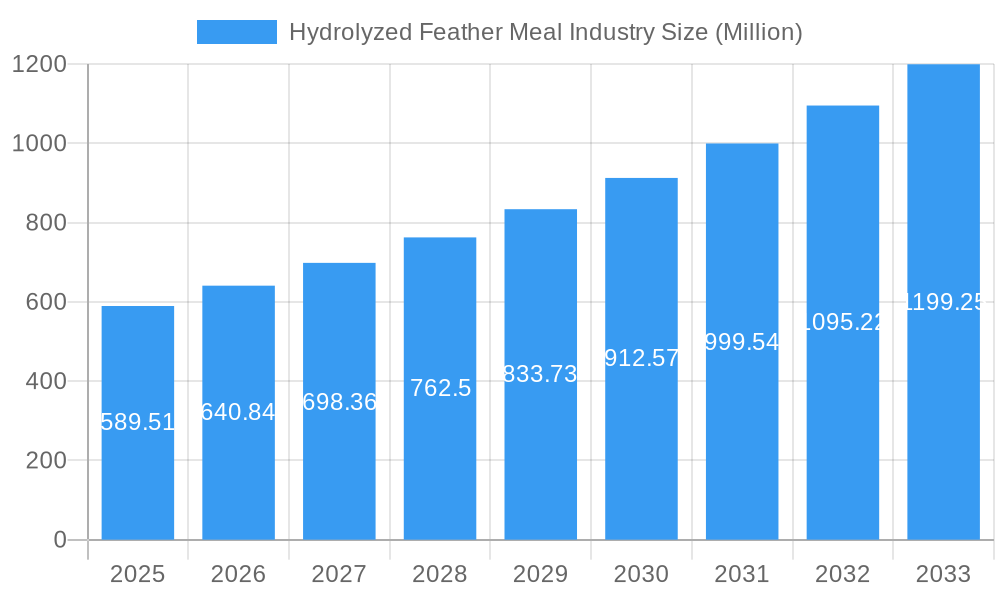
The hydrolyzed feather meal market, valued at $589.51 million in 2025, is projected to experience robust growth, driven by increasing demand in animal feed and agrochemicals. A Compound Annual Growth Rate (CAGR) of 8.60% from 2025 to 2033 indicates a significant expansion of this market, largely fueled by the rising global population and the consequential need for efficient and sustainable protein sources in animal feed. The organic segment is expected to witness faster growth compared to the conventional segment due to growing consumer awareness regarding sustainable and environmentally friendly agricultural practices. This heightened demand is particularly pronounced in the animal feed application, where hydrolyzed feather meal offers a cost-effective and protein-rich alternative to traditional feed ingredients. However, challenges remain, such as overcoming consumer perceptions regarding the use of feather meal and ensuring consistent quality and safety standards across production. Further market penetration will depend on successful strategies addressing these concerns through transparent supply chains and robust quality control measures. Geographic expansion, particularly in developing economies with burgeoning agricultural sectors, presents a key opportunity for growth. Leading players in the market are focusing on innovation, partnerships, and capacity expansion to meet the growing demand and capitalize on these opportunities.
Hydrolyzed Feather Meal Industry Market Size (In Million)
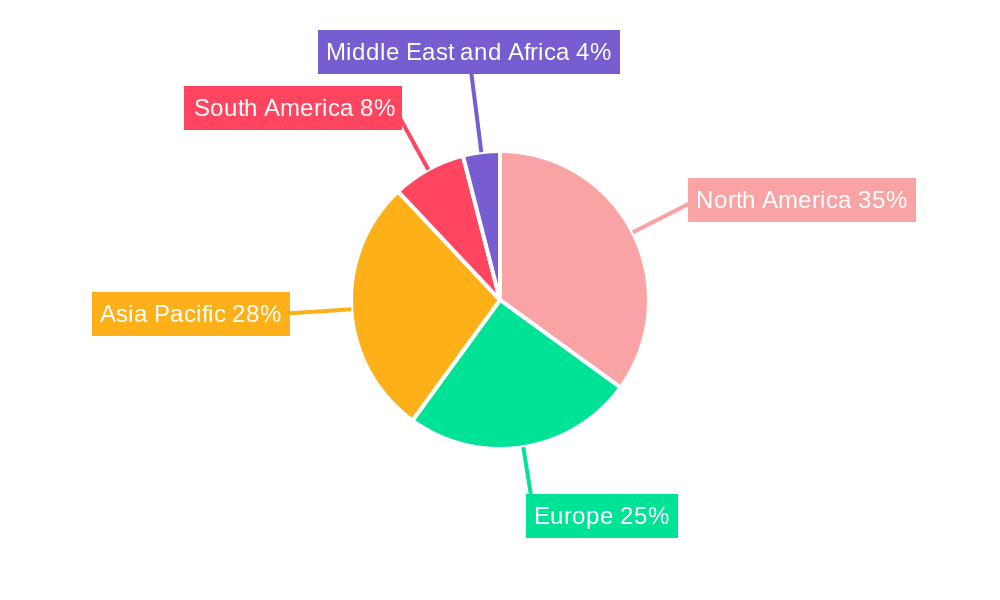
The North American market currently holds a significant share, owing to established infrastructure and high demand. However, the Asia-Pacific region is poised for substantial growth, driven by rapid economic development and increasing livestock production in countries like China and India. Europe is also expected to contribute significantly, owing to the rising adoption of sustainable farming practices and stricter regulations on conventional feed ingredients. Competitive dynamics are shaped by factors like pricing strategies, product quality, and technological advancements in the production process. The overall outlook for the hydrolyzed feather meal market is positive, with continued expansion expected throughout the forecast period, driven by the factors mentioned above and further supported by ongoing research and development in improving the efficiency and sustainability of feather meal production.
Hydrolyzed Feather Meal Industry Company Market Share
Hydrolyzed Feather Meal Industry: A Comprehensive Market Report (2019-2033)
This comprehensive report provides a detailed analysis of the Hydrolyzed Feather Meal industry, offering invaluable insights for stakeholders seeking to understand market dynamics, growth drivers, and future opportunities. With a study period spanning 2019-2033, a base year of 2025, and an estimated year of 2025, this report forecasts market trends from 2025-2033, building upon historical data from 2019-2024. The report's meticulous analysis covers market size, CAGR, market concentration, technological advancements, and competitive landscapes, providing a crucial foundation for informed decision-making.
Hydrolyzed Feather Meal Industry Market Concentration & Dynamics
The global hydrolyzed feather meal market exhibits a moderately concentrated structure, with several key players commanding significant market share. Darling Ingredients, Valley Proteins, and K-Pro U are among the leading producers, collectively holding an estimated xx% market share in 2025. The market's dynamics are shaped by several factors, including:
- Innovation Ecosystems: Ongoing research and development focus on improving hydrolysis techniques to enhance product quality and reduce production costs. This includes exploring alternative feedstock and expanding applications beyond animal feed.
- Regulatory Frameworks: Government regulations concerning animal feed additives and environmental protection impact the industry, necessitating compliance with specific standards and certifications (e.g., organic certifications).
- Substitute Products: Competitors like soybean meal and fishmeal exert pressure on the market, although hydrolyzed feather meal offers cost-competitive and sustainable advantages.
- End-User Trends: Growing demand for sustainable and cost-effective animal feed, particularly in the poultry and aquaculture sectors, drives market expansion. The shift towards organic farming also boosts demand for organic hydrolyzed feather meal.
- M&A Activities: The number of M&A deals in the industry has been relatively moderate in recent years, with xx deals recorded between 2019 and 2024. Consolidation is expected to continue as companies seek to expand their market reach and enhance their product portfolios.
Hydrolyzed Feather Meal Industry Industry Insights & Trends
The global hydrolyzed feather meal market is projected to experience substantial growth, driven by increasing demand from the animal feed industry. The market size was valued at approximately $xx Million in 2024 and is forecast to reach $xx Million by 2033, exhibiting a CAGR of xx% during the forecast period (2025-2033). Several factors fuel this growth:
The increasing global population and rising demand for animal protein are key drivers. This heightened demand necessitates cost-effective and sustainable feed sources, positioning hydrolyzed feather meal favorably. Technological advancements in hydrolysis processes have improved product quality and efficiency, making it a more attractive option for feed manufacturers. Additionally, rising awareness of environmental sustainability promotes the adoption of alternative feed ingredients with reduced environmental footprints, thereby boosting the demand for hydrolyzed feather meal. The market is further strengthened by favorable government policies encouraging the sustainable utilization of agricultural by-products. Shifting consumer preferences towards organic and sustainable products also contributes to the market expansion. However, challenges such as fluctuating raw material prices and potential regulatory changes could impact growth trajectories.
Key Markets & Segments Leading Hydrolyzed Feather Meal Industry
The animal feed application segment currently dominates the hydrolyzed feather meal market, accounting for approximately xx% of global consumption in 2025. Within this segment, the poultry feed application holds the largest market share. The organic segment is growing rapidly, driven by increasing consumer demand for sustainably produced animal products. Geographically, North America and Europe are major markets, although emerging economies in Asia and Latin America offer significant growth potential.
Key Drivers:
- Animal Feed: Growing global demand for meat and poultry, driving the need for affordable and nutritious animal feed.
- Economic Growth: Rising disposable incomes in developing countries increase meat consumption, pushing demand for feed ingredients.
- Infrastructure Development: Improved infrastructure in emerging markets facilitates efficient transportation and distribution of hydrolyzed feather meal.
- Agrochemicals: Increasing use of hydrolyzed feather meal as a soil amendment in agriculture due to its nutrient content.
- Other Applications: Growing exploration of its use in various other applications such as cosmetics and pharmaceuticals is expected to contribute to market expansion.
Dominance Analysis: North America and Europe currently hold the largest market share due to established animal feed industries and stringent environmental regulations promoting sustainable practices. However, Asia-Pacific is anticipated to witness significant growth in the coming years due to expanding poultry and aquaculture sectors.
Hydrolyzed Feather Meal Industry Product Developments
Recent product innovations include the development of enzymatically hydrolyzed feather meal with improved digestibility and protein quality for optimal animal feed performance. This enhanced product provides a competitive advantage by improving feed efficiency and animal growth rates. Furthermore, research is exploring new applications in agriculture, creating specialized formulations for enhanced soil health and plant nutrition. These advancements improve the versatility of hydrolyzed feather meal, strengthening its market relevance and competitive edge.
Challenges in the Hydrolyzed Feather Meal Industry Market
The hydrolyzed feather meal market faces challenges such as fluctuating raw material prices (feather availability), complex and evolving regulations affecting feed additives, and intense competition from alternative protein sources. Supply chain disruptions, particularly during periods of avian influenza outbreaks, pose significant threats, impacting production and potentially driving up prices. These challenges necessitate strategic planning and proactive risk management by industry players. The competition from cheaper protein sources, such as soymeal and fishmeal, presents an ongoing challenge that requires continual improvement in product quality and cost-effectiveness.
Forces Driving Hydrolyzed Feather Meal Industry Growth
Several factors drive the growth of the hydrolyzed feather meal industry: rising global demand for animal protein, increasing consumer awareness of sustainable feed sources, advancements in hydrolysis technology yielding higher-quality products, and favorable government policies promoting the utilization of agricultural by-products. The growing focus on environmental sustainability and reducing agricultural waste fuels market expansion. Furthermore, the rising demand for organic products extends to animal feed, increasing the demand for organically produced hydrolyzed feather meal.
Long-Term Growth Catalysts in the Hydrolyzed Feather Meal Industry
Long-term growth will be driven by continued innovation in hydrolysis technologies to enhance product quality and reduce production costs. Strategic partnerships between feed manufacturers and feather processors ensure a stable supply chain. Expanding into new markets, particularly in developing regions with burgeoning poultry and aquaculture sectors, will unlock considerable growth potential. Additionally, diversifying product applications beyond animal feed, such as agrochemicals and other industrial uses, will provide new avenues for market expansion.
Emerging Opportunities in Hydrolyzed Feather Meal Industry
Emerging opportunities lie in the development of value-added products derived from hydrolyzed feather meal, such as specialized formulations for specific animal species or growth stages. Further exploration of novel applications in bioplastics and other industrial segments presents a potential for significant market expansion. The increased demand for sustainable and traceable products presents opportunities for companies that can effectively manage and communicate their sustainability credentials throughout their supply chains.
Leading Players in the Hydrolyzed Feather Meal Industry Sector
- Darling Ingredients
- K-Pro U
- Valley Proteins
- The Boyer Valley Company
- North Country Organics
- JG Pears
- Kleingarn Agrarprodukte
- FASA Group
Key Milestones in Hydrolyzed Feather Meal Industry Industry
- September 2021: Indian scientists developed a new hydrodynamic, sustainable, and affordable technique to convert poultry feathers and animal hair into fertilizer, showcasing innovation in waste utilization and expanding potential applications.
- August 2022: The University of Danang - University of Science and Technology successfully created a bio-organic fertilizer from chicken feathers, highlighting the potential for environmentally friendly solutions and addressing waste management challenges.
Strategic Outlook for Hydrolyzed Feather Meal Industry Market
The hydrolyzed feather meal market holds substantial long-term growth potential, driven by increasing demand for sustainable and cost-effective animal feed, technological advancements, and the growing focus on waste reduction. Companies strategically positioned to leverage these trends and invest in research and development will be well-placed to capture a larger share of this expanding market. The industry is expected to see further consolidation through mergers and acquisitions, resulting in stronger and more globally competitive players.
Hydrolyzed Feather Meal Industry Segmentation
- 1. Production Analysis
- 2. Consumption Analysis
- 3. Import Market Analysis (Value & Volume)
- 4. Export Market Analysis (Value & Volume)
- 5. Price Trend Analysis
Hydrolyzed Feather Meal Industry Segmentation By Geography
-
1. North America
- 1.1. United States
- 1.2. Canada
- 1.3. Mexico
-
2. South America
- 2.1. Brazil
- 2.2. Argentina
- 2.3. Rest of South America
-
3. Europe
- 3.1. United Kingdom
- 3.2. Germany
- 3.3. France
- 3.4. Italy
- 3.5. Spain
- 3.6. Russia
- 3.7. Benelux
- 3.8. Nordics
- 3.9. Rest of Europe
-
4. Middle East & Africa
- 4.1. Turkey
- 4.2. Israel
- 4.3. GCC
- 4.4. North Africa
- 4.5. South Africa
- 4.6. Rest of Middle East & Africa
-
5. Asia Pacific
- 5.1. China
- 5.2. India
- 5.3. Japan
- 5.4. South Korea
- 5.5. ASEAN
- 5.6. Oceania
- 5.7. Rest of Asia Pacific
Hydrolyzed Feather Meal Industry Regional Market Share
Geographic Coverage of Hydrolyzed Feather Meal Industry
Hydrolyzed Feather Meal Industry REPORT HIGHLIGHTS
| Aspects | Details |
|---|---|
| Study Period | 2020-2034 |
| Base Year | 2025 |
| Estimated Year | 2026 |
| Forecast Period | 2026-2034 |
| Historical Period | 2020-2025 |
| Growth Rate | CAGR of 8.60% from 2020-2034 |
| Segmentation |
|
Table of Contents
- 1. Introduction
- 1.1. Research Scope
- 1.2. Market Segmentation
- 1.3. Research Objective
- 1.4. Definitions and Assumptions
- 2. Executive Summary
- 2.1. Market Snapshot
- 3. Market Dynamics
- 3.1. Market Drivers
- 3.2. Market Restrains
- 3.3. Market Trends
- 3.4. Market Opportunities
- 4. Market Factor Analysis
- 4.1. Porters Five Forces
- 4.1.1. Bargaining Power of Suppliers
- 4.1.2. Bargaining Power of Buyers
- 4.1.3. Threat of New Entrants
- 4.1.4. Threat of Substitutes
- 4.1.5. Competitive Rivalry
- 4.2. PESTEL analysis
- 4.3. BCG Analysis
- 4.3.1. Stars (High Growth, High Market Share)
- 4.3.2. Cash Cows (Low Growth, High Market Share)
- 4.3.3. Question Mark (High Growth, Low Market Share)
- 4.3.4. Dogs (Low Growth, Low Market Share)
- 4.4. Ansoff Matrix Analysis
- 4.5. Supply Chain Analysis
- 4.6. Regulatory Landscape
- 4.7. Current Market Potential and Opportunity Assessment (TAM–SAM–SOM Framework)
- 4.8. MSR Analyst Note
- 4.1. Porters Five Forces
- 5. Market Analysis, Insights and Forecast 2021-2033
- 5.1. Market Analysis, Insights and Forecast - by Production Analysis
- 5.2. Market Analysis, Insights and Forecast - by Consumption Analysis
- 5.3. Market Analysis, Insights and Forecast - by Import Market Analysis (Value & Volume)
- 5.4. Market Analysis, Insights and Forecast - by Export Market Analysis (Value & Volume)
- 5.5. Market Analysis, Insights and Forecast - by Price Trend Analysis
- 5.6. Market Analysis, Insights and Forecast - by Region
- 5.6.1. North America
- 5.6.2. South America
- 5.6.3. Europe
- 5.6.4. Middle East & Africa
- 5.6.5. Asia Pacific
- 6. Global Hydrolyzed Feather Meal Industry Analysis, Insights and Forecast, 2021-2033
- 6.1. Market Analysis, Insights and Forecast - by Production Analysis
- 6.2. Market Analysis, Insights and Forecast - by Consumption Analysis
- 6.3. Market Analysis, Insights and Forecast - by Import Market Analysis (Value & Volume)
- 6.4. Market Analysis, Insights and Forecast - by Export Market Analysis (Value & Volume)
- 6.5. Market Analysis, Insights and Forecast - by Price Trend Analysis
- 7. North America Hydrolyzed Feather Meal Industry Analysis, Insights and Forecast, 2020-2032
- 7.1. Market Analysis, Insights and Forecast - by Production Analysis
- 7.2. Market Analysis, Insights and Forecast - by Consumption Analysis
- 7.3. Market Analysis, Insights and Forecast - by Import Market Analysis (Value & Volume)
- 7.4. Market Analysis, Insights and Forecast - by Export Market Analysis (Value & Volume)
- 7.5. Market Analysis, Insights and Forecast - by Price Trend Analysis
- 8. South America Hydrolyzed Feather Meal Industry Analysis, Insights and Forecast, 2020-2032
- 8.1. Market Analysis, Insights and Forecast - by Production Analysis
- 8.2. Market Analysis, Insights and Forecast - by Consumption Analysis
- 8.3. Market Analysis, Insights and Forecast - by Import Market Analysis (Value & Volume)
- 8.4. Market Analysis, Insights and Forecast - by Export Market Analysis (Value & Volume)
- 8.5. Market Analysis, Insights and Forecast - by Price Trend Analysis
- 9. Europe Hydrolyzed Feather Meal Industry Analysis, Insights and Forecast, 2020-2032
- 9.1. Market Analysis, Insights and Forecast - by Production Analysis
- 9.2. Market Analysis, Insights and Forecast - by Consumption Analysis
- 9.3. Market Analysis, Insights and Forecast - by Import Market Analysis (Value & Volume)
- 9.4. Market Analysis, Insights and Forecast - by Export Market Analysis (Value & Volume)
- 9.5. Market Analysis, Insights and Forecast - by Price Trend Analysis
- 10. Middle East & Africa Hydrolyzed Feather Meal Industry Analysis, Insights and Forecast, 2020-2032
- 10.1. Market Analysis, Insights and Forecast - by Production Analysis
- 10.2. Market Analysis, Insights and Forecast - by Consumption Analysis
- 10.3. Market Analysis, Insights and Forecast - by Import Market Analysis (Value & Volume)
- 10.4. Market Analysis, Insights and Forecast - by Export Market Analysis (Value & Volume)
- 10.5. Market Analysis, Insights and Forecast - by Price Trend Analysis
- 11. Asia Pacific Hydrolyzed Feather Meal Industry Analysis, Insights and Forecast, 2020-2032
- 11.1. Market Analysis, Insights and Forecast - by Production Analysis
- 11.2. Market Analysis, Insights and Forecast - by Consumption Analysis
- 11.3. Market Analysis, Insights and Forecast - by Import Market Analysis (Value & Volume)
- 11.4. Market Analysis, Insights and Forecast - by Export Market Analysis (Value & Volume)
- 11.5. Market Analysis, Insights and Forecast - by Price Trend Analysis
- 12. Competitive Analysis
- 12.1. Company Profiles
- 12.1.1 Darling Ingredients
- 12.1.1.1. Company Overview
- 12.1.1.2. Products
- 12.1.1.3. Company Financials
- 12.1.1.4. SWOT Analysis
- 12.1.2 K-Pro U
- 12.1.2.1. Company Overview
- 12.1.2.2. Products
- 12.1.2.3. Company Financials
- 12.1.2.4. SWOT Analysis
- 12.1.3 Valley Proteins
- 12.1.3.1. Company Overview
- 12.1.3.2. Products
- 12.1.3.3. Company Financials
- 12.1.3.4. SWOT Analysis
- 12.1.4 The Boyer Valley Company
- 12.1.4.1. Company Overview
- 12.1.4.2. Products
- 12.1.4.3. Company Financials
- 12.1.4.4. SWOT Analysis
- 12.1.5 North Country Organics
- 12.1.5.1. Company Overview
- 12.1.5.2. Products
- 12.1.5.3. Company Financials
- 12.1.5.4. SWOT Analysis
- 12.1.6 JG Pears
- 12.1.6.1. Company Overview
- 12.1.6.2. Products
- 12.1.6.3. Company Financials
- 12.1.6.4. SWOT Analysis
- 12.1.7 Kleingarn Agrarprodukte
- 12.1.7.1. Company Overview
- 12.1.7.2. Products
- 12.1.7.3. Company Financials
- 12.1.7.4. SWOT Analysis
- 12.1.8 FASA Group
- 12.1.8.1. Company Overview
- 12.1.8.2. Products
- 12.1.8.3. Company Financials
- 12.1.8.4. SWOT Analysis
- 12.1.1 Darling Ingredients
- 12.2. Market Entropy
- 12.2.1 Company's Key Areas Served
- 12.2.2 Recent Developments
- 12.3. Company Market Share Analysis 2025
- 12.3.1 Top 5 Companies Market Share Analysis
- 12.3.2 Top 3 Companies Market Share Analysis
- 12.4. List of Potential Customers
- 13. Research Methodology
List of Figures
- Figure 1: Global Hydrolyzed Feather Meal Industry Revenue Breakdown (Million, %) by Region 2025 & 2033
- Figure 2: North America Hydrolyzed Feather Meal Industry Revenue (Million), by Production Analysis 2025 & 2033
- Figure 3: North America Hydrolyzed Feather Meal Industry Revenue Share (%), by Production Analysis 2025 & 2033
- Figure 4: North America Hydrolyzed Feather Meal Industry Revenue (Million), by Consumption Analysis 2025 & 2033
- Figure 5: North America Hydrolyzed Feather Meal Industry Revenue Share (%), by Consumption Analysis 2025 & 2033
- Figure 6: North America Hydrolyzed Feather Meal Industry Revenue (Million), by Import Market Analysis (Value & Volume) 2025 & 2033
- Figure 7: North America Hydrolyzed Feather Meal Industry Revenue Share (%), by Import Market Analysis (Value & Volume) 2025 & 2033
- Figure 8: North America Hydrolyzed Feather Meal Industry Revenue (Million), by Export Market Analysis (Value & Volume) 2025 & 2033
- Figure 9: North America Hydrolyzed Feather Meal Industry Revenue Share (%), by Export Market Analysis (Value & Volume) 2025 & 2033
- Figure 10: North America Hydrolyzed Feather Meal Industry Revenue (Million), by Price Trend Analysis 2025 & 2033
- Figure 11: North America Hydrolyzed Feather Meal Industry Revenue Share (%), by Price Trend Analysis 2025 & 2033
- Figure 12: North America Hydrolyzed Feather Meal Industry Revenue (Million), by Country 2025 & 2033
- Figure 13: North America Hydrolyzed Feather Meal Industry Revenue Share (%), by Country 2025 & 2033
- Figure 14: South America Hydrolyzed Feather Meal Industry Revenue (Million), by Production Analysis 2025 & 2033
- Figure 15: South America Hydrolyzed Feather Meal Industry Revenue Share (%), by Production Analysis 2025 & 2033
- Figure 16: South America Hydrolyzed Feather Meal Industry Revenue (Million), by Consumption Analysis 2025 & 2033
- Figure 17: South America Hydrolyzed Feather Meal Industry Revenue Share (%), by Consumption Analysis 2025 & 2033
- Figure 18: South America Hydrolyzed Feather Meal Industry Revenue (Million), by Import Market Analysis (Value & Volume) 2025 & 2033
- Figure 19: South America Hydrolyzed Feather Meal Industry Revenue Share (%), by Import Market Analysis (Value & Volume) 2025 & 2033
- Figure 20: South America Hydrolyzed Feather Meal Industry Revenue (Million), by Export Market Analysis (Value & Volume) 2025 & 2033
- Figure 21: South America Hydrolyzed Feather Meal Industry Revenue Share (%), by Export Market Analysis (Value & Volume) 2025 & 2033
- Figure 22: South America Hydrolyzed Feather Meal Industry Revenue (Million), by Price Trend Analysis 2025 & 2033
- Figure 23: South America Hydrolyzed Feather Meal Industry Revenue Share (%), by Price Trend Analysis 2025 & 2033
- Figure 24: South America Hydrolyzed Feather Meal Industry Revenue (Million), by Country 2025 & 2033
- Figure 25: South America Hydrolyzed Feather Meal Industry Revenue Share (%), by Country 2025 & 2033
- Figure 26: Europe Hydrolyzed Feather Meal Industry Revenue (Million), by Production Analysis 2025 & 2033
- Figure 27: Europe Hydrolyzed Feather Meal Industry Revenue Share (%), by Production Analysis 2025 & 2033
- Figure 28: Europe Hydrolyzed Feather Meal Industry Revenue (Million), by Consumption Analysis 2025 & 2033
- Figure 29: Europe Hydrolyzed Feather Meal Industry Revenue Share (%), by Consumption Analysis 2025 & 2033
- Figure 30: Europe Hydrolyzed Feather Meal Industry Revenue (Million), by Import Market Analysis (Value & Volume) 2025 & 2033
- Figure 31: Europe Hydrolyzed Feather Meal Industry Revenue Share (%), by Import Market Analysis (Value & Volume) 2025 & 2033
- Figure 32: Europe Hydrolyzed Feather Meal Industry Revenue (Million), by Export Market Analysis (Value & Volume) 2025 & 2033
- Figure 33: Europe Hydrolyzed Feather Meal Industry Revenue Share (%), by Export Market Analysis (Value & Volume) 2025 & 2033
- Figure 34: Europe Hydrolyzed Feather Meal Industry Revenue (Million), by Price Trend Analysis 2025 & 2033
- Figure 35: Europe Hydrolyzed Feather Meal Industry Revenue Share (%), by Price Trend Analysis 2025 & 2033
- Figure 36: Europe Hydrolyzed Feather Meal Industry Revenue (Million), by Country 2025 & 2033
- Figure 37: Europe Hydrolyzed Feather Meal Industry Revenue Share (%), by Country 2025 & 2033
- Figure 38: Middle East & Africa Hydrolyzed Feather Meal Industry Revenue (Million), by Production Analysis 2025 & 2033
- Figure 39: Middle East & Africa Hydrolyzed Feather Meal Industry Revenue Share (%), by Production Analysis 2025 & 2033
- Figure 40: Middle East & Africa Hydrolyzed Feather Meal Industry Revenue (Million), by Consumption Analysis 2025 & 2033
- Figure 41: Middle East & Africa Hydrolyzed Feather Meal Industry Revenue Share (%), by Consumption Analysis 2025 & 2033
- Figure 42: Middle East & Africa Hydrolyzed Feather Meal Industry Revenue (Million), by Import Market Analysis (Value & Volume) 2025 & 2033
- Figure 43: Middle East & Africa Hydrolyzed Feather Meal Industry Revenue Share (%), by Import Market Analysis (Value & Volume) 2025 & 2033
- Figure 44: Middle East & Africa Hydrolyzed Feather Meal Industry Revenue (Million), by Export Market Analysis (Value & Volume) 2025 & 2033
- Figure 45: Middle East & Africa Hydrolyzed Feather Meal Industry Revenue Share (%), by Export Market Analysis (Value & Volume) 2025 & 2033
- Figure 46: Middle East & Africa Hydrolyzed Feather Meal Industry Revenue (Million), by Price Trend Analysis 2025 & 2033
- Figure 47: Middle East & Africa Hydrolyzed Feather Meal Industry Revenue Share (%), by Price Trend Analysis 2025 & 2033
- Figure 48: Middle East & Africa Hydrolyzed Feather Meal Industry Revenue (Million), by Country 2025 & 2033
- Figure 49: Middle East & Africa Hydrolyzed Feather Meal Industry Revenue Share (%), by Country 2025 & 2033
- Figure 50: Asia Pacific Hydrolyzed Feather Meal Industry Revenue (Million), by Production Analysis 2025 & 2033
- Figure 51: Asia Pacific Hydrolyzed Feather Meal Industry Revenue Share (%), by Production Analysis 2025 & 2033
- Figure 52: Asia Pacific Hydrolyzed Feather Meal Industry Revenue (Million), by Consumption Analysis 2025 & 2033
- Figure 53: Asia Pacific Hydrolyzed Feather Meal Industry Revenue Share (%), by Consumption Analysis 2025 & 2033
- Figure 54: Asia Pacific Hydrolyzed Feather Meal Industry Revenue (Million), by Import Market Analysis (Value & Volume) 2025 & 2033
- Figure 55: Asia Pacific Hydrolyzed Feather Meal Industry Revenue Share (%), by Import Market Analysis (Value & Volume) 2025 & 2033
- Figure 56: Asia Pacific Hydrolyzed Feather Meal Industry Revenue (Million), by Export Market Analysis (Value & Volume) 2025 & 2033
- Figure 57: Asia Pacific Hydrolyzed Feather Meal Industry Revenue Share (%), by Export Market Analysis (Value & Volume) 2025 & 2033
- Figure 58: Asia Pacific Hydrolyzed Feather Meal Industry Revenue (Million), by Price Trend Analysis 2025 & 2033
- Figure 59: Asia Pacific Hydrolyzed Feather Meal Industry Revenue Share (%), by Price Trend Analysis 2025 & 2033
- Figure 60: Asia Pacific Hydrolyzed Feather Meal Industry Revenue (Million), by Country 2025 & 2033
- Figure 61: Asia Pacific Hydrolyzed Feather Meal Industry Revenue Share (%), by Country 2025 & 2033
List of Tables
- Table 1: Global Hydrolyzed Feather Meal Industry Revenue Million Forecast, by Production Analysis 2020 & 2033
- Table 2: Global Hydrolyzed Feather Meal Industry Revenue Million Forecast, by Consumption Analysis 2020 & 2033
- Table 3: Global Hydrolyzed Feather Meal Industry Revenue Million Forecast, by Import Market Analysis (Value & Volume) 2020 & 2033
- Table 4: Global Hydrolyzed Feather Meal Industry Revenue Million Forecast, by Export Market Analysis (Value & Volume) 2020 & 2033
- Table 5: Global Hydrolyzed Feather Meal Industry Revenue Million Forecast, by Price Trend Analysis 2020 & 2033
- Table 6: Global Hydrolyzed Feather Meal Industry Revenue Million Forecast, by Region 2020 & 2033
- Table 7: Global Hydrolyzed Feather Meal Industry Revenue Million Forecast, by Production Analysis 2020 & 2033
- Table 8: Global Hydrolyzed Feather Meal Industry Revenue Million Forecast, by Consumption Analysis 2020 & 2033
- Table 9: Global Hydrolyzed Feather Meal Industry Revenue Million Forecast, by Import Market Analysis (Value & Volume) 2020 & 2033
- Table 10: Global Hydrolyzed Feather Meal Industry Revenue Million Forecast, by Export Market Analysis (Value & Volume) 2020 & 2033
- Table 11: Global Hydrolyzed Feather Meal Industry Revenue Million Forecast, by Price Trend Analysis 2020 & 2033
- Table 12: Global Hydrolyzed Feather Meal Industry Revenue Million Forecast, by Country 2020 & 2033
- Table 13: United States Hydrolyzed Feather Meal Industry Revenue (Million) Forecast, by Application 2020 & 2033
- Table 14: Canada Hydrolyzed Feather Meal Industry Revenue (Million) Forecast, by Application 2020 & 2033
- Table 15: Mexico Hydrolyzed Feather Meal Industry Revenue (Million) Forecast, by Application 2020 & 2033
- Table 16: Global Hydrolyzed Feather Meal Industry Revenue Million Forecast, by Production Analysis 2020 & 2033
- Table 17: Global Hydrolyzed Feather Meal Industry Revenue Million Forecast, by Consumption Analysis 2020 & 2033
- Table 18: Global Hydrolyzed Feather Meal Industry Revenue Million Forecast, by Import Market Analysis (Value & Volume) 2020 & 2033
- Table 19: Global Hydrolyzed Feather Meal Industry Revenue Million Forecast, by Export Market Analysis (Value & Volume) 2020 & 2033
- Table 20: Global Hydrolyzed Feather Meal Industry Revenue Million Forecast, by Price Trend Analysis 2020 & 2033
- Table 21: Global Hydrolyzed Feather Meal Industry Revenue Million Forecast, by Country 2020 & 2033
- Table 22: Brazil Hydrolyzed Feather Meal Industry Revenue (Million) Forecast, by Application 2020 & 2033
- Table 23: Argentina Hydrolyzed Feather Meal Industry Revenue (Million) Forecast, by Application 2020 & 2033
- Table 24: Rest of South America Hydrolyzed Feather Meal Industry Revenue (Million) Forecast, by Application 2020 & 2033
- Table 25: Global Hydrolyzed Feather Meal Industry Revenue Million Forecast, by Production Analysis 2020 & 2033
- Table 26: Global Hydrolyzed Feather Meal Industry Revenue Million Forecast, by Consumption Analysis 2020 & 2033
- Table 27: Global Hydrolyzed Feather Meal Industry Revenue Million Forecast, by Import Market Analysis (Value & Volume) 2020 & 2033
- Table 28: Global Hydrolyzed Feather Meal Industry Revenue Million Forecast, by Export Market Analysis (Value & Volume) 2020 & 2033
- Table 29: Global Hydrolyzed Feather Meal Industry Revenue Million Forecast, by Price Trend Analysis 2020 & 2033
- Table 30: Global Hydrolyzed Feather Meal Industry Revenue Million Forecast, by Country 2020 & 2033
- Table 31: United Kingdom Hydrolyzed Feather Meal Industry Revenue (Million) Forecast, by Application 2020 & 2033
- Table 32: Germany Hydrolyzed Feather Meal Industry Revenue (Million) Forecast, by Application 2020 & 2033
- Table 33: France Hydrolyzed Feather Meal Industry Revenue (Million) Forecast, by Application 2020 & 2033
- Table 34: Italy Hydrolyzed Feather Meal Industry Revenue (Million) Forecast, by Application 2020 & 2033
- Table 35: Spain Hydrolyzed Feather Meal Industry Revenue (Million) Forecast, by Application 2020 & 2033
- Table 36: Russia Hydrolyzed Feather Meal Industry Revenue (Million) Forecast, by Application 2020 & 2033
- Table 37: Benelux Hydrolyzed Feather Meal Industry Revenue (Million) Forecast, by Application 2020 & 2033
- Table 38: Nordics Hydrolyzed Feather Meal Industry Revenue (Million) Forecast, by Application 2020 & 2033
- Table 39: Rest of Europe Hydrolyzed Feather Meal Industry Revenue (Million) Forecast, by Application 2020 & 2033
- Table 40: Global Hydrolyzed Feather Meal Industry Revenue Million Forecast, by Production Analysis 2020 & 2033
- Table 41: Global Hydrolyzed Feather Meal Industry Revenue Million Forecast, by Consumption Analysis 2020 & 2033
- Table 42: Global Hydrolyzed Feather Meal Industry Revenue Million Forecast, by Import Market Analysis (Value & Volume) 2020 & 2033
- Table 43: Global Hydrolyzed Feather Meal Industry Revenue Million Forecast, by Export Market Analysis (Value & Volume) 2020 & 2033
- Table 44: Global Hydrolyzed Feather Meal Industry Revenue Million Forecast, by Price Trend Analysis 2020 & 2033
- Table 45: Global Hydrolyzed Feather Meal Industry Revenue Million Forecast, by Country 2020 & 2033
- Table 46: Turkey Hydrolyzed Feather Meal Industry Revenue (Million) Forecast, by Application 2020 & 2033
- Table 47: Israel Hydrolyzed Feather Meal Industry Revenue (Million) Forecast, by Application 2020 & 2033
- Table 48: GCC Hydrolyzed Feather Meal Industry Revenue (Million) Forecast, by Application 2020 & 2033
- Table 49: North Africa Hydrolyzed Feather Meal Industry Revenue (Million) Forecast, by Application 2020 & 2033
- Table 50: South Africa Hydrolyzed Feather Meal Industry Revenue (Million) Forecast, by Application 2020 & 2033
- Table 51: Rest of Middle East & Africa Hydrolyzed Feather Meal Industry Revenue (Million) Forecast, by Application 2020 & 2033
- Table 52: Global Hydrolyzed Feather Meal Industry Revenue Million Forecast, by Production Analysis 2020 & 2033
- Table 53: Global Hydrolyzed Feather Meal Industry Revenue Million Forecast, by Consumption Analysis 2020 & 2033
- Table 54: Global Hydrolyzed Feather Meal Industry Revenue Million Forecast, by Import Market Analysis (Value & Volume) 2020 & 2033
- Table 55: Global Hydrolyzed Feather Meal Industry Revenue Million Forecast, by Export Market Analysis (Value & Volume) 2020 & 2033
- Table 56: Global Hydrolyzed Feather Meal Industry Revenue Million Forecast, by Price Trend Analysis 2020 & 2033
- Table 57: Global Hydrolyzed Feather Meal Industry Revenue Million Forecast, by Country 2020 & 2033
- Table 58: China Hydrolyzed Feather Meal Industry Revenue (Million) Forecast, by Application 2020 & 2033
- Table 59: India Hydrolyzed Feather Meal Industry Revenue (Million) Forecast, by Application 2020 & 2033
- Table 60: Japan Hydrolyzed Feather Meal Industry Revenue (Million) Forecast, by Application 2020 & 2033
- Table 61: South Korea Hydrolyzed Feather Meal Industry Revenue (Million) Forecast, by Application 2020 & 2033
- Table 62: ASEAN Hydrolyzed Feather Meal Industry Revenue (Million) Forecast, by Application 2020 & 2033
- Table 63: Oceania Hydrolyzed Feather Meal Industry Revenue (Million) Forecast, by Application 2020 & 2033
- Table 64: Rest of Asia Pacific Hydrolyzed Feather Meal Industry Revenue (Million) Forecast, by Application 2020 & 2033
Frequently Asked Questions
1. What is the projected Compound Annual Growth Rate (CAGR) of the Hydrolyzed Feather Meal Industry?
The projected CAGR is approximately 8.60%.
2. Which companies are prominent players in the Hydrolyzed Feather Meal Industry?
Key companies in the market include Darling Ingredients, K-Pro U, Valley Proteins, The Boyer Valley Company, North Country Organics, JG Pears, Kleingarn Agrarprodukte, FASA Group.
3. What are the main segments of the Hydrolyzed Feather Meal Industry?
The market segments include Production Analysis, Consumption Analysis, Import Market Analysis (Value & Volume), Export Market Analysis (Value & Volume), Price Trend Analysis.
4. Can you provide details about the market size?
The market size is estimated to be USD 589.51 Million as of 2022.
5. What are some drivers contributing to market growth?
Adoption of Organic and Eco-friendly Farming Practices; Declining Area of Arable Land and Rising Food Security Concerns.
6. What are the notable trends driving market growth?
Increasing demand for organic farming accelerating feather meal market.
7. Are there any restraints impacting market growth?
High Demand for Conventional and Synthetic Products; Lack of Awareness and Other Factors Limiting the Adoption of Agricultural Inoculants.
8. Can you provide examples of recent developments in the market?
August 2022: The University of Danang - University of Science and Technology has successfully made a type of bio-organic fertilizer from chicken feathers with the desire to reduce environmental pollution from by-products such as chicken feathers.
9. What pricing options are available for accessing the report?
Pricing options include single-user, multi-user, and enterprise licenses priced at USD 4750, USD 5250, and USD 8750 respectively.
10. Is the market size provided in terms of value or volume?
The market size is provided in terms of value, measured in Million.
11. Are there any specific market keywords associated with the report?
Yes, the market keyword associated with the report is "Hydrolyzed Feather Meal Industry," which aids in identifying and referencing the specific market segment covered.
12. How do I determine which pricing option suits my needs best?
The pricing options vary based on user requirements and access needs. Individual users may opt for single-user licenses, while businesses requiring broader access may choose multi-user or enterprise licenses for cost-effective access to the report.
13. Are there any additional resources or data provided in the Hydrolyzed Feather Meal Industry report?
While the report offers comprehensive insights, it's advisable to review the specific contents or supplementary materials provided to ascertain if additional resources or data are available.
14. How can I stay updated on further developments or reports in the Hydrolyzed Feather Meal Industry?
To stay informed about further developments, trends, and reports in the Hydrolyzed Feather Meal Industry, consider subscribing to industry newsletters, following relevant companies and organizations, or regularly checking reputable industry news sources and publications.
Methodology
Step 1 - Identification of Relevant Samples Size from Population Database


Step 2 - Approaches for Defining Global Market Size (Value, Volume* & Price*)

Note*: In applicable scenarios
Step 3 - Data Sources
Primary Research
- Web Analytics
- Survey Reports
- Research Institute
- Latest Research Reports
- Opinion Leaders
Secondary Research
- Annual Reports
- White Paper
- Latest Press Release
- Industry Association
- Paid Database
- Investor Presentations

Step 4 - Data Triangulation
Involves using different sources of information in order to increase the validity of a study
These sources are likely to be stakeholders in a program - participants, other researchers, program staff, other community members, and so on.
Then we put all data in single framework & apply various statistical tools to find out the dynamic on the market.
During the analysis stage, feedback from the stakeholder groups would be compared to determine areas of agreement as well as areas of divergence