

Key Insights
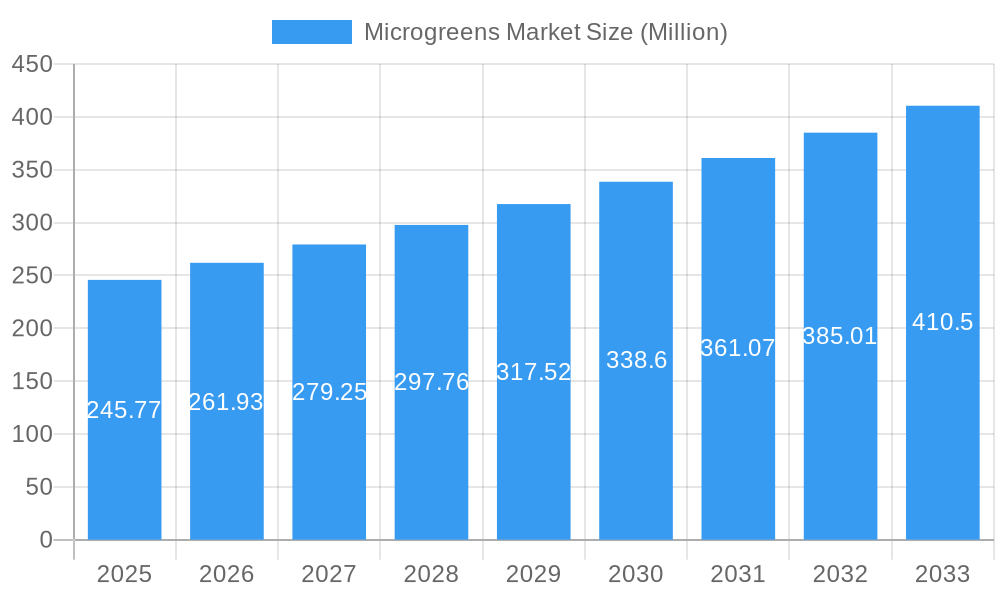
The global microgreens market, valued at $245.77 million in 2025, is projected to experience robust growth, driven by a Compound Annual Growth Rate (CAGR) of 6.40% from 2025 to 2033. This expansion is fueled by several key factors. The rising consumer awareness of health benefits associated with microgreens, including their high nutritional value and concentration of vitamins and antioxidants, is a significant driver. The increasing popularity of plant-based diets and the growing demand for fresh, locally sourced produce further contribute to market growth. The versatility of microgreens in culinary applications, suitable for salads, garnishes, and as components in various dishes, broadens their market appeal. Innovation in farming techniques, such as indoor, vertical, and commercial greenhouse farming, is enhancing production efficiency and yield, contributing to market expansion. The shift towards sustainable and environmentally friendly agricultural practices aligns with consumer preferences and further boosts market potential. While challenges such as initial investment costs for advanced farming technologies and potential supply chain disruptions might present some constraints, the overall market outlook remains positive.
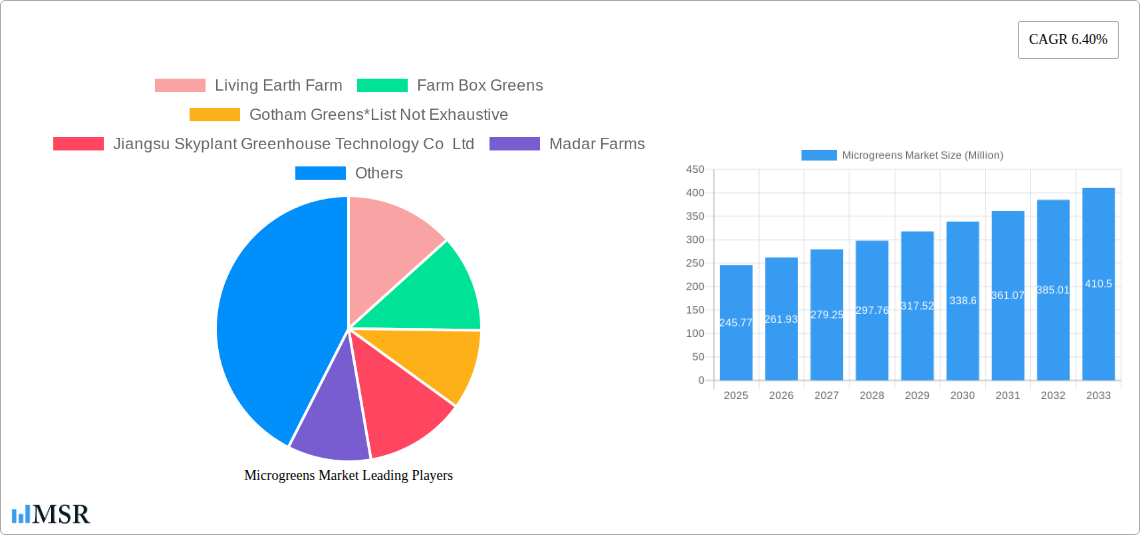
Microgreens Market Market Size (In Million)
The market segmentation reveals diverse opportunities. Hypermarkets and supermarkets represent a significant distribution channel, followed by restaurants and other channels. Broccoli, lettuce, and chicory are currently the leading microgreen types, although the market for diverse varieties like arugula, basil, and fennel is also growing rapidly. Peat moss remains a prevalent growth medium, while coconut coir and other sustainable options are gaining traction, reflecting the increasing emphasis on eco-friendly farming. Geographically, North America and Europe currently hold substantial market shares, while the Asia-Pacific region is poised for significant expansion due to rising disposable incomes and changing dietary habits. Key players like Living Earth Farm, Farm Box Greens, and AeroFarms are shaping market dynamics through innovation and expansion, while new entrants constantly emerge, fostering competition and driving further growth. The projected growth trajectory suggests a substantial market expansion by 2033, with considerable potential for further diversification and innovation within the industry.
Microgreens Market Company Market Share
Microgreens Market Report: A Comprehensive Analysis (2019-2033)
This comprehensive report provides a detailed analysis of the global microgreens market, offering invaluable insights for industry stakeholders, investors, and businesses looking to capitalize on this rapidly expanding sector. The report covers the period 2019-2033, with a focus on the 2025-2033 forecast period. The market is segmented by distribution channel (hypermarkets/supermarkets, restaurants, other distribution channels), type (broccoli, lettuce & chicory, arugula, basil, fennel, carrots, sunflower, radish, peas, other types), farming method (indoor farming, vertical farming, commercial greenhouses, other farming), and growth medium (peat moss, soil, coconut coir, tissue paper, other growth mediums). Key players analyzed include Living Earth Farm, Farm Box Greens, Gotham Greens, Jiangsu Skyplant Greenhouse Technology Co Ltd, Madar Farms, Chef's Garden Inc, Shanghai Dehuan Industry Co Ltd, Metro Microgreens, Goodleaf Farms, and AeroFarms LLC. The total market value is projected to reach xx Million by 2033.
Microgreens Market Concentration & Dynamics
The microgreens market exhibits a moderately fragmented landscape, with several large players and numerous smaller, regional producers competing for market share. Market concentration is expected to shift slightly towards larger players as technological advancements favor economies of scale. The report analyses market share data for key players, revealing the dominance of a few key players in certain segments. M&A activity has been relatively modest in recent years, with approximately xx deals recorded between 2019 and 2024. However, strategic partnerships and collaborations are increasingly common, as evidenced by recent joint ventures focused on expanding distribution networks and product lines. Innovation is driven by advancements in vertical farming technologies, automation, and sustainable growing practices. Regulatory frameworks vary across regions, impacting production costs and market access. Substitute products, such as conventional leafy greens and sprouts, exert competitive pressure. End-user trends are increasingly focused on health and wellness, driving demand for nutrient-rich microgreens.
- Market Share: xx% held by top 5 players in 2024.
- M&A Deal Count (2019-2024): xx
- Key Innovation Areas: Vertical farming, automation, sustainable growing practices.
- Regulatory Landscape: Varies significantly across regions.
Microgreens Market Industry Insights & Trends
The global microgreens market is experiencing robust growth, driven by rising consumer demand for healthy and nutritious food options. The market size was valued at xx Million in 2024 and is projected to reach xx Million by 2033, exhibiting a Compound Annual Growth Rate (CAGR) of xx% during the forecast period. This growth is fueled by several factors, including increasing consumer awareness of the nutritional benefits of microgreens, rising disposable incomes, and growing adoption of convenient, ready-to-eat products. Technological advancements in vertical farming and indoor agriculture are further enhancing production efficiency and reducing costs, making microgreens more accessible to a wider consumer base. Changing consumer behaviors, including a preference for locally sourced and sustainably produced food, are also significantly impacting market dynamics.
Key Markets & Segments Leading Microgreens Market
The North American region currently dominates the global microgreens market, driven by high consumer demand and robust infrastructure. Within this region, the United States holds the largest market share. However, Asia-Pacific is expected to exhibit significant growth in the coming years, fueled by rapid economic development and increasing urbanization.
Key Drivers:
- Economic Growth: Increased disposable incomes drive demand for premium food products.
- Infrastructure Development: Enhanced logistics and supply chains improve market access.
- Consumer Preferences: Growing health consciousness and preference for convenient food.
Dominant Segments:
- Distribution Channel: Hypermarkets/supermarkets are the largest distribution channel, followed by restaurants.
- Type: Lettuce and chicory, and arugula are currently leading the microgreens types, but others such as basil and radish are gaining traction.
- Farming Method: Indoor and vertical farming are gaining popularity due to increased efficiency and controlled environment.
- Growth Medium: Soil and coconut coir are widely used but newer mediums are being experimented with for optimal growth.
Microgreens Market Product Developments
The microgreens sector is witnessing exciting product developments driven by a dual focus on boosting nutritional density and extending shelf life. Significant advancements in controlled environment agriculture (CEA) technologies, such as sophisticated hydroponic and aeroponic systems, are paving the way for more resource-efficient and environmentally conscious cultivation practices. Concurrently, innovations in packaging solutions are playing a crucial role in preserving freshness and prolonging the availability of these nutrient-packed greens. The market is also seeing a surge in the introduction of unique microgreen varietals and thoughtfully curated pre-packaged mixes. These offerings are meticulously designed to meet the evolving and diverse palates of consumers, offering innovative companies a distinct advantage and fostering greater market penetration.
Challenges in the Microgreens Market Market
Despite its growth potential, the microgreens market encounters several hurdles. A primary concern is the substantial initial capital outlay required for setting up advanced vertical farming and indoor agriculture operations. Furthermore, the market must navigate a complex landscape of stringent food safety and hygiene regulations. The inherent vulnerability of microgreens to pests and diseases poses another significant challenge, which can lead to unpredictable supply chain disruptions and consequently, elevated production expenses. These factors collectively can impede the market's expansion and hinder its broader acceptance. The increasing competitive intensity, fueled by both established industry leaders and agile new entrants, further compounds these challenges.
Forces Driving Microgreens Market Growth
The microgreens market's growth is primarily driven by increasing health awareness among consumers, leading to a surge in demand for nutrient-rich foods. Technological advancements in controlled environment agriculture are boosting efficiency and reducing production costs, making microgreens more affordable and accessible. Government initiatives promoting sustainable agriculture and healthy eating also contribute positively to market expansion. Moreover, strategic partnerships and collaborations among producers, retailers, and technology providers facilitate market penetration and distribution.
Long-Term Growth Catalysts in the Microgreens Market
Long-term growth in the microgreens market will be driven by continuous innovation in vertical farming technologies, leading to higher yields and lower operating costs. Strategic partnerships and collaborations, such as AeroFarm's expansion with Amazon Fresh, will broaden market access and distribution. The expansion into new markets with a growing health-conscious population will create further growth opportunities.
Emerging Opportunities in Microgreens Market
Emerging opportunities include the development of novel microgreen varieties with enhanced nutritional profiles and unique flavors, expanding into niche markets such as organic and specialty food stores, and leveraging advanced technologies like artificial intelligence for optimized production and supply chain management.
Leading Players in the Microgreens Market Sector
- Living Earth Farm
- Farm Box Greens
- Gotham Greens
- Jiangsu Skyplant Greenhouse Technology Co Ltd
- Madar Farms
- Chef's Garden Inc
- Shanghai Dehuan Industry Co Ltd
- Metro Microgreens
- Goodleaf Farms
- AeroFarms LLC
Key Milestones in Microgreens Market Industry
- August 2022: AeroFarms expands retail presence to 160 Fresh Market stores across 22 states.
- February 2023: Good Leaf Farm partners with Unfold to introduce premium vertically farmed greens.
- May 2023: AeroFarms launches nationwide expansion through collaboration with Amazon Fresh.
Strategic Outlook for Microgreens Market Market
The microgreens market presents significant growth potential driven by escalating demand for healthy and convenient food options. Strategic investments in vertical farming technologies, expansion into new markets, and strategic partnerships with major retailers will be crucial for success in this dynamic sector. The focus on sustainability and traceability will also be pivotal to capturing the evolving consumer preferences and securing long-term market leadership.
Microgreens Market Segmentation
- 1. Production Analysis
- 2. Consumption Analysis
- 3. Import Market Analysis (Value & Volume)
- 4. Export Market Analysis (Value & Volume)
- 5. Price Trend Analysis
Microgreens Market Segmentation By Geography
-
1. North America
- 1.1. United States
- 1.2. Canada
- 1.3. Mexico
-
2. South America
- 2.1. Brazil
- 2.2. Argentina
- 2.3. Rest of South America
-
3. Europe
- 3.1. United Kingdom
- 3.2. Germany
- 3.3. France
- 3.4. Italy
- 3.5. Spain
- 3.6. Russia
- 3.7. Benelux
- 3.8. Nordics
- 3.9. Rest of Europe
-
4. Middle East & Africa
- 4.1. Turkey
- 4.2. Israel
- 4.3. GCC
- 4.4. North Africa
- 4.5. South Africa
- 4.6. Rest of Middle East & Africa
-
5. Asia Pacific
- 5.1. China
- 5.2. India
- 5.3. Japan
- 5.4. South Korea
- 5.5. ASEAN
- 5.6. Oceania
- 5.7. Rest of Asia Pacific
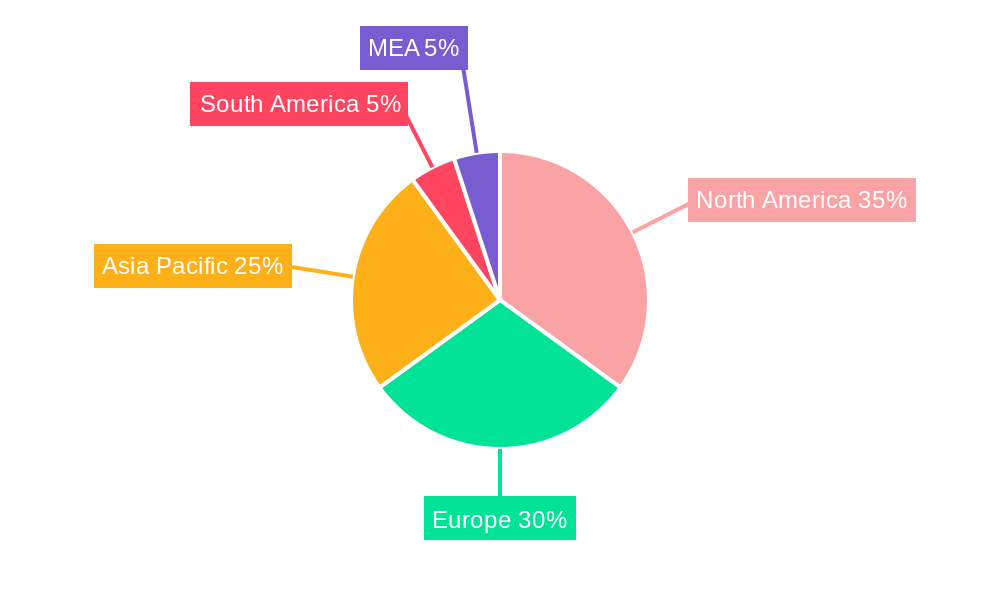
Microgreens Market Regional Market Share
Geographic Coverage of Microgreens Market
Microgreens Market REPORT HIGHLIGHTS
| Aspects | Details |
|---|---|
| Study Period | 2020-2034 |
| Base Year | 2025 |
| Estimated Year | 2026 |
| Forecast Period | 2026-2034 |
| Historical Period | 2020-2025 |
| Growth Rate | CAGR of 6.40% from 2020-2034 |
| Segmentation |
|
Table of Contents
- 1. Introduction
- 1.1. Research Scope
- 1.2. Market Segmentation
- 1.3. Research Objective
- 1.4. Definitions and Assumptions
- 2. Executive Summary
- 2.1. Market Snapshot
- 3. Market Dynamics
- 3.1. Market Drivers
- 3.2. Market Restrains
- 3.3. Market Trends
- 3.4. Market Opportunities
- 4. Market Factor Analysis
- 4.1. Porters Five Forces
- 4.1.1. Bargaining Power of Suppliers
- 4.1.2. Bargaining Power of Buyers
- 4.1.3. Threat of New Entrants
- 4.1.4. Threat of Substitutes
- 4.1.5. Competitive Rivalry
- 4.2. PESTEL analysis
- 4.3. BCG Analysis
- 4.3.1. Stars (High Growth, High Market Share)
- 4.3.2. Cash Cows (Low Growth, High Market Share)
- 4.3.3. Question Mark (High Growth, Low Market Share)
- 4.3.4. Dogs (Low Growth, Low Market Share)
- 4.4. Ansoff Matrix Analysis
- 4.5. Supply Chain Analysis
- 4.6. Regulatory Landscape
- 4.7. Current Market Potential and Opportunity Assessment (TAM–SAM–SOM Framework)
- 4.8. MSR Analyst Note
- 4.1. Porters Five Forces
- 5. Market Analysis, Insights and Forecast 2021-2033
- 5.1. Market Analysis, Insights and Forecast - by Production Analysis
- 5.2. Market Analysis, Insights and Forecast - by Consumption Analysis
- 5.3. Market Analysis, Insights and Forecast - by Import Market Analysis (Value & Volume)
- 5.4. Market Analysis, Insights and Forecast - by Export Market Analysis (Value & Volume)
- 5.5. Market Analysis, Insights and Forecast - by Price Trend Analysis
- 5.6. Market Analysis, Insights and Forecast - by Region
- 5.6.1. North America
- 5.6.2. South America
- 5.6.3. Europe
- 5.6.4. Middle East & Africa
- 5.6.5. Asia Pacific
- 6. Global Microgreens Market Analysis, Insights and Forecast, 2021-2033
- 6.1. Market Analysis, Insights and Forecast - by Production Analysis
- 6.2. Market Analysis, Insights and Forecast - by Consumption Analysis
- 6.3. Market Analysis, Insights and Forecast - by Import Market Analysis (Value & Volume)
- 6.4. Market Analysis, Insights and Forecast - by Export Market Analysis (Value & Volume)
- 6.5. Market Analysis, Insights and Forecast - by Price Trend Analysis
- 7. North America Microgreens Market Analysis, Insights and Forecast, 2020-2032
- 7.1. Market Analysis, Insights and Forecast - by Production Analysis
- 7.2. Market Analysis, Insights and Forecast - by Consumption Analysis
- 7.3. Market Analysis, Insights and Forecast - by Import Market Analysis (Value & Volume)
- 7.4. Market Analysis, Insights and Forecast - by Export Market Analysis (Value & Volume)
- 7.5. Market Analysis, Insights and Forecast - by Price Trend Analysis
- 8. South America Microgreens Market Analysis, Insights and Forecast, 2020-2032
- 8.1. Market Analysis, Insights and Forecast - by Production Analysis
- 8.2. Market Analysis, Insights and Forecast - by Consumption Analysis
- 8.3. Market Analysis, Insights and Forecast - by Import Market Analysis (Value & Volume)
- 8.4. Market Analysis, Insights and Forecast - by Export Market Analysis (Value & Volume)
- 8.5. Market Analysis, Insights and Forecast - by Price Trend Analysis
- 9. Europe Microgreens Market Analysis, Insights and Forecast, 2020-2032
- 9.1. Market Analysis, Insights and Forecast - by Production Analysis
- 9.2. Market Analysis, Insights and Forecast - by Consumption Analysis
- 9.3. Market Analysis, Insights and Forecast - by Import Market Analysis (Value & Volume)
- 9.4. Market Analysis, Insights and Forecast - by Export Market Analysis (Value & Volume)
- 9.5. Market Analysis, Insights and Forecast - by Price Trend Analysis
- 10. Middle East & Africa Microgreens Market Analysis, Insights and Forecast, 2020-2032
- 10.1. Market Analysis, Insights and Forecast - by Production Analysis
- 10.2. Market Analysis, Insights and Forecast - by Consumption Analysis
- 10.3. Market Analysis, Insights and Forecast - by Import Market Analysis (Value & Volume)
- 10.4. Market Analysis, Insights and Forecast - by Export Market Analysis (Value & Volume)
- 10.5. Market Analysis, Insights and Forecast - by Price Trend Analysis
- 11. Asia Pacific Microgreens Market Analysis, Insights and Forecast, 2020-2032
- 11.1. Market Analysis, Insights and Forecast - by Production Analysis
- 11.2. Market Analysis, Insights and Forecast - by Consumption Analysis
- 11.3. Market Analysis, Insights and Forecast - by Import Market Analysis (Value & Volume)
- 11.4. Market Analysis, Insights and Forecast - by Export Market Analysis (Value & Volume)
- 11.5. Market Analysis, Insights and Forecast - by Price Trend Analysis
- 12. Competitive Analysis
- 12.1. Company Profiles
- 12.1.1 Living Earth Farm
- 12.1.1.1. Company Overview
- 12.1.1.2. Products
- 12.1.1.3. Company Financials
- 12.1.1.4. SWOT Analysis
- 12.1.2 Farm Box Greens
- 12.1.2.1. Company Overview
- 12.1.2.2. Products
- 12.1.2.3. Company Financials
- 12.1.2.4. SWOT Analysis
- 12.1.3 Gotham Greens*List Not Exhaustive
- 12.1.3.1. Company Overview
- 12.1.3.2. Products
- 12.1.3.3. Company Financials
- 12.1.3.4. SWOT Analysis
- 12.1.4 Jiangsu Skyplant Greenhouse Technology Co Ltd
- 12.1.4.1. Company Overview
- 12.1.4.2. Products
- 12.1.4.3. Company Financials
- 12.1.4.4. SWOT Analysis
- 12.1.5 Madar Farms
- 12.1.5.1. Company Overview
- 12.1.5.2. Products
- 12.1.5.3. Company Financials
- 12.1.5.4. SWOT Analysis
- 12.1.6 Chef's Garden Inc
- 12.1.6.1. Company Overview
- 12.1.6.2. Products
- 12.1.6.3. Company Financials
- 12.1.6.4. SWOT Analysis
- 12.1.7 Shanghai Dehuan Industry Co Ltd
- 12.1.7.1. Company Overview
- 12.1.7.2. Products
- 12.1.7.3. Company Financials
- 12.1.7.4. SWOT Analysis
- 12.1.8 Metro Microgreens
- 12.1.8.1. Company Overview
- 12.1.8.2. Products
- 12.1.8.3. Company Financials
- 12.1.8.4. SWOT Analysis
- 12.1.9 Goodleaf Farms
- 12.1.9.1. Company Overview
- 12.1.9.2. Products
- 12.1.9.3. Company Financials
- 12.1.9.4. SWOT Analysis
- 12.1.10 AeroFarms LLC
- 12.1.10.1. Company Overview
- 12.1.10.2. Products
- 12.1.10.3. Company Financials
- 12.1.10.4. SWOT Analysis
- 12.1.1 Living Earth Farm
- 12.2. Market Entropy
- 12.2.1 Company's Key Areas Served
- 12.2.2 Recent Developments
- 12.3. Company Market Share Analysis 2025
- 12.3.1 Top 5 Companies Market Share Analysis
- 12.3.2 Top 3 Companies Market Share Analysis
- 12.4. List of Potential Customers
- 13. Research Methodology
List of Figures
- Figure 1: Global Microgreens Market Revenue Breakdown (Million, %) by Region 2025 & 2033
- Figure 2: North America Microgreens Market Revenue (Million), by Production Analysis 2025 & 2033
- Figure 3: North America Microgreens Market Revenue Share (%), by Production Analysis 2025 & 2033
- Figure 4: North America Microgreens Market Revenue (Million), by Consumption Analysis 2025 & 2033
- Figure 5: North America Microgreens Market Revenue Share (%), by Consumption Analysis 2025 & 2033
- Figure 6: North America Microgreens Market Revenue (Million), by Import Market Analysis (Value & Volume) 2025 & 2033
- Figure 7: North America Microgreens Market Revenue Share (%), by Import Market Analysis (Value & Volume) 2025 & 2033
- Figure 8: North America Microgreens Market Revenue (Million), by Export Market Analysis (Value & Volume) 2025 & 2033
- Figure 9: North America Microgreens Market Revenue Share (%), by Export Market Analysis (Value & Volume) 2025 & 2033
- Figure 10: North America Microgreens Market Revenue (Million), by Price Trend Analysis 2025 & 2033
- Figure 11: North America Microgreens Market Revenue Share (%), by Price Trend Analysis 2025 & 2033
- Figure 12: North America Microgreens Market Revenue (Million), by Country 2025 & 2033
- Figure 13: North America Microgreens Market Revenue Share (%), by Country 2025 & 2033
- Figure 14: South America Microgreens Market Revenue (Million), by Production Analysis 2025 & 2033
- Figure 15: South America Microgreens Market Revenue Share (%), by Production Analysis 2025 & 2033
- Figure 16: South America Microgreens Market Revenue (Million), by Consumption Analysis 2025 & 2033
- Figure 17: South America Microgreens Market Revenue Share (%), by Consumption Analysis 2025 & 2033
- Figure 18: South America Microgreens Market Revenue (Million), by Import Market Analysis (Value & Volume) 2025 & 2033
- Figure 19: South America Microgreens Market Revenue Share (%), by Import Market Analysis (Value & Volume) 2025 & 2033
- Figure 20: South America Microgreens Market Revenue (Million), by Export Market Analysis (Value & Volume) 2025 & 2033
- Figure 21: South America Microgreens Market Revenue Share (%), by Export Market Analysis (Value & Volume) 2025 & 2033
- Figure 22: South America Microgreens Market Revenue (Million), by Price Trend Analysis 2025 & 2033
- Figure 23: South America Microgreens Market Revenue Share (%), by Price Trend Analysis 2025 & 2033
- Figure 24: South America Microgreens Market Revenue (Million), by Country 2025 & 2033
- Figure 25: South America Microgreens Market Revenue Share (%), by Country 2025 & 2033
- Figure 26: Europe Microgreens Market Revenue (Million), by Production Analysis 2025 & 2033
- Figure 27: Europe Microgreens Market Revenue Share (%), by Production Analysis 2025 & 2033
- Figure 28: Europe Microgreens Market Revenue (Million), by Consumption Analysis 2025 & 2033
- Figure 29: Europe Microgreens Market Revenue Share (%), by Consumption Analysis 2025 & 2033
- Figure 30: Europe Microgreens Market Revenue (Million), by Import Market Analysis (Value & Volume) 2025 & 2033
- Figure 31: Europe Microgreens Market Revenue Share (%), by Import Market Analysis (Value & Volume) 2025 & 2033
- Figure 32: Europe Microgreens Market Revenue (Million), by Export Market Analysis (Value & Volume) 2025 & 2033
- Figure 33: Europe Microgreens Market Revenue Share (%), by Export Market Analysis (Value & Volume) 2025 & 2033
- Figure 34: Europe Microgreens Market Revenue (Million), by Price Trend Analysis 2025 & 2033
- Figure 35: Europe Microgreens Market Revenue Share (%), by Price Trend Analysis 2025 & 2033
- Figure 36: Europe Microgreens Market Revenue (Million), by Country 2025 & 2033
- Figure 37: Europe Microgreens Market Revenue Share (%), by Country 2025 & 2033
- Figure 38: Middle East & Africa Microgreens Market Revenue (Million), by Production Analysis 2025 & 2033
- Figure 39: Middle East & Africa Microgreens Market Revenue Share (%), by Production Analysis 2025 & 2033
- Figure 40: Middle East & Africa Microgreens Market Revenue (Million), by Consumption Analysis 2025 & 2033
- Figure 41: Middle East & Africa Microgreens Market Revenue Share (%), by Consumption Analysis 2025 & 2033
- Figure 42: Middle East & Africa Microgreens Market Revenue (Million), by Import Market Analysis (Value & Volume) 2025 & 2033
- Figure 43: Middle East & Africa Microgreens Market Revenue Share (%), by Import Market Analysis (Value & Volume) 2025 & 2033
- Figure 44: Middle East & Africa Microgreens Market Revenue (Million), by Export Market Analysis (Value & Volume) 2025 & 2033
- Figure 45: Middle East & Africa Microgreens Market Revenue Share (%), by Export Market Analysis (Value & Volume) 2025 & 2033
- Figure 46: Middle East & Africa Microgreens Market Revenue (Million), by Price Trend Analysis 2025 & 2033
- Figure 47: Middle East & Africa Microgreens Market Revenue Share (%), by Price Trend Analysis 2025 & 2033
- Figure 48: Middle East & Africa Microgreens Market Revenue (Million), by Country 2025 & 2033
- Figure 49: Middle East & Africa Microgreens Market Revenue Share (%), by Country 2025 & 2033
- Figure 50: Asia Pacific Microgreens Market Revenue (Million), by Production Analysis 2025 & 2033
- Figure 51: Asia Pacific Microgreens Market Revenue Share (%), by Production Analysis 2025 & 2033
- Figure 52: Asia Pacific Microgreens Market Revenue (Million), by Consumption Analysis 2025 & 2033
- Figure 53: Asia Pacific Microgreens Market Revenue Share (%), by Consumption Analysis 2025 & 2033
- Figure 54: Asia Pacific Microgreens Market Revenue (Million), by Import Market Analysis (Value & Volume) 2025 & 2033
- Figure 55: Asia Pacific Microgreens Market Revenue Share (%), by Import Market Analysis (Value & Volume) 2025 & 2033
- Figure 56: Asia Pacific Microgreens Market Revenue (Million), by Export Market Analysis (Value & Volume) 2025 & 2033
- Figure 57: Asia Pacific Microgreens Market Revenue Share (%), by Export Market Analysis (Value & Volume) 2025 & 2033
- Figure 58: Asia Pacific Microgreens Market Revenue (Million), by Price Trend Analysis 2025 & 2033
- Figure 59: Asia Pacific Microgreens Market Revenue Share (%), by Price Trend Analysis 2025 & 2033
- Figure 60: Asia Pacific Microgreens Market Revenue (Million), by Country 2025 & 2033
- Figure 61: Asia Pacific Microgreens Market Revenue Share (%), by Country 2025 & 2033
List of Tables
- Table 1: Global Microgreens Market Revenue Million Forecast, by Production Analysis 2020 & 2033
- Table 2: Global Microgreens Market Revenue Million Forecast, by Consumption Analysis 2020 & 2033
- Table 3: Global Microgreens Market Revenue Million Forecast, by Import Market Analysis (Value & Volume) 2020 & 2033
- Table 4: Global Microgreens Market Revenue Million Forecast, by Export Market Analysis (Value & Volume) 2020 & 2033
- Table 5: Global Microgreens Market Revenue Million Forecast, by Price Trend Analysis 2020 & 2033
- Table 6: Global Microgreens Market Revenue Million Forecast, by Region 2020 & 2033
- Table 7: Global Microgreens Market Revenue Million Forecast, by Production Analysis 2020 & 2033
- Table 8: Global Microgreens Market Revenue Million Forecast, by Consumption Analysis 2020 & 2033
- Table 9: Global Microgreens Market Revenue Million Forecast, by Import Market Analysis (Value & Volume) 2020 & 2033
- Table 10: Global Microgreens Market Revenue Million Forecast, by Export Market Analysis (Value & Volume) 2020 & 2033
- Table 11: Global Microgreens Market Revenue Million Forecast, by Price Trend Analysis 2020 & 2033
- Table 12: Global Microgreens Market Revenue Million Forecast, by Country 2020 & 2033
- Table 13: United States Microgreens Market Revenue (Million) Forecast, by Application 2020 & 2033
- Table 14: Canada Microgreens Market Revenue (Million) Forecast, by Application 2020 & 2033
- Table 15: Mexico Microgreens Market Revenue (Million) Forecast, by Application 2020 & 2033
- Table 16: Global Microgreens Market Revenue Million Forecast, by Production Analysis 2020 & 2033
- Table 17: Global Microgreens Market Revenue Million Forecast, by Consumption Analysis 2020 & 2033
- Table 18: Global Microgreens Market Revenue Million Forecast, by Import Market Analysis (Value & Volume) 2020 & 2033
- Table 19: Global Microgreens Market Revenue Million Forecast, by Export Market Analysis (Value & Volume) 2020 & 2033
- Table 20: Global Microgreens Market Revenue Million Forecast, by Price Trend Analysis 2020 & 2033
- Table 21: Global Microgreens Market Revenue Million Forecast, by Country 2020 & 2033
- Table 22: Brazil Microgreens Market Revenue (Million) Forecast, by Application 2020 & 2033
- Table 23: Argentina Microgreens Market Revenue (Million) Forecast, by Application 2020 & 2033
- Table 24: Rest of South America Microgreens Market Revenue (Million) Forecast, by Application 2020 & 2033
- Table 25: Global Microgreens Market Revenue Million Forecast, by Production Analysis 2020 & 2033
- Table 26: Global Microgreens Market Revenue Million Forecast, by Consumption Analysis 2020 & 2033
- Table 27: Global Microgreens Market Revenue Million Forecast, by Import Market Analysis (Value & Volume) 2020 & 2033
- Table 28: Global Microgreens Market Revenue Million Forecast, by Export Market Analysis (Value & Volume) 2020 & 2033
- Table 29: Global Microgreens Market Revenue Million Forecast, by Price Trend Analysis 2020 & 2033
- Table 30: Global Microgreens Market Revenue Million Forecast, by Country 2020 & 2033
- Table 31: United Kingdom Microgreens Market Revenue (Million) Forecast, by Application 2020 & 2033
- Table 32: Germany Microgreens Market Revenue (Million) Forecast, by Application 2020 & 2033
- Table 33: France Microgreens Market Revenue (Million) Forecast, by Application 2020 & 2033
- Table 34: Italy Microgreens Market Revenue (Million) Forecast, by Application 2020 & 2033
- Table 35: Spain Microgreens Market Revenue (Million) Forecast, by Application 2020 & 2033
- Table 36: Russia Microgreens Market Revenue (Million) Forecast, by Application 2020 & 2033
- Table 37: Benelux Microgreens Market Revenue (Million) Forecast, by Application 2020 & 2033
- Table 38: Nordics Microgreens Market Revenue (Million) Forecast, by Application 2020 & 2033
- Table 39: Rest of Europe Microgreens Market Revenue (Million) Forecast, by Application 2020 & 2033
- Table 40: Global Microgreens Market Revenue Million Forecast, by Production Analysis 2020 & 2033
- Table 41: Global Microgreens Market Revenue Million Forecast, by Consumption Analysis 2020 & 2033
- Table 42: Global Microgreens Market Revenue Million Forecast, by Import Market Analysis (Value & Volume) 2020 & 2033
- Table 43: Global Microgreens Market Revenue Million Forecast, by Export Market Analysis (Value & Volume) 2020 & 2033
- Table 44: Global Microgreens Market Revenue Million Forecast, by Price Trend Analysis 2020 & 2033
- Table 45: Global Microgreens Market Revenue Million Forecast, by Country 2020 & 2033
- Table 46: Turkey Microgreens Market Revenue (Million) Forecast, by Application 2020 & 2033
- Table 47: Israel Microgreens Market Revenue (Million) Forecast, by Application 2020 & 2033
- Table 48: GCC Microgreens Market Revenue (Million) Forecast, by Application 2020 & 2033
- Table 49: North Africa Microgreens Market Revenue (Million) Forecast, by Application 2020 & 2033
- Table 50: South Africa Microgreens Market Revenue (Million) Forecast, by Application 2020 & 2033
- Table 51: Rest of Middle East & Africa Microgreens Market Revenue (Million) Forecast, by Application 2020 & 2033
- Table 52: Global Microgreens Market Revenue Million Forecast, by Production Analysis 2020 & 2033
- Table 53: Global Microgreens Market Revenue Million Forecast, by Consumption Analysis 2020 & 2033
- Table 54: Global Microgreens Market Revenue Million Forecast, by Import Market Analysis (Value & Volume) 2020 & 2033
- Table 55: Global Microgreens Market Revenue Million Forecast, by Export Market Analysis (Value & Volume) 2020 & 2033
- Table 56: Global Microgreens Market Revenue Million Forecast, by Price Trend Analysis 2020 & 2033
- Table 57: Global Microgreens Market Revenue Million Forecast, by Country 2020 & 2033
- Table 58: China Microgreens Market Revenue (Million) Forecast, by Application 2020 & 2033
- Table 59: India Microgreens Market Revenue (Million) Forecast, by Application 2020 & 2033
- Table 60: Japan Microgreens Market Revenue (Million) Forecast, by Application 2020 & 2033
- Table 61: South Korea Microgreens Market Revenue (Million) Forecast, by Application 2020 & 2033
- Table 62: ASEAN Microgreens Market Revenue (Million) Forecast, by Application 2020 & 2033
- Table 63: Oceania Microgreens Market Revenue (Million) Forecast, by Application 2020 & 2033
- Table 64: Rest of Asia Pacific Microgreens Market Revenue (Million) Forecast, by Application 2020 & 2033
Frequently Asked Questions
1. What is the projected Compound Annual Growth Rate (CAGR) of the Microgreens Market?
The projected CAGR is approximately 6.40%.
2. Which companies are prominent players in the Microgreens Market?
Key companies in the market include Living Earth Farm, Farm Box Greens, Gotham Greens*List Not Exhaustive, Jiangsu Skyplant Greenhouse Technology Co Ltd, Madar Farms, Chef's Garden Inc, Shanghai Dehuan Industry Co Ltd, Metro Microgreens, Goodleaf Farms, AeroFarms LLC.
3. What are the main segments of the Microgreens Market?
The market segments include Production Analysis, Consumption Analysis, Import Market Analysis (Value & Volume), Export Market Analysis (Value & Volume), Price Trend Analysis.
4. Can you provide details about the market size?
The market size is estimated to be USD 245.77 Million as of 2022.
5. What are some drivers contributing to market growth?
Seed Treatment As A Solution To Enhance Yield; Growing Awareness For Seed Treatment Among The Farmers; Rising Trend Of Organic Farming.
6. What are the notable trends driving market growth?
Rise in Adoption of Indoor Farming.
7. Are there any restraints impacting market growth?
Limitations Across Farm-Level Seed Treatment; Rising Environmental Concerns.
8. Can you provide examples of recent developments in the market?
May 2023: AeroFarms, a Certified B Corporation and a prominent figure in indoor vertical farming took a significant step forward by launching a nationwide expansion through a collaboration with Amazon Fresh. This partnership aims to enhance the high-tech consumer grocery experience. Building on their prior success with Whole Foods Market in 2022, AeroFarms became the first indoor leafy greens grower to be included in Whole Foods Market's Global Planogram, setting an industry precedent.
9. What pricing options are available for accessing the report?
Pricing options include single-user, multi-user, and enterprise licenses priced at USD 4750, USD 5250, and USD 8750 respectively.
10. Is the market size provided in terms of value or volume?
The market size is provided in terms of value, measured in Million.
11. Are there any specific market keywords associated with the report?
Yes, the market keyword associated with the report is "Microgreens Market," which aids in identifying and referencing the specific market segment covered.
12. How do I determine which pricing option suits my needs best?
The pricing options vary based on user requirements and access needs. Individual users may opt for single-user licenses, while businesses requiring broader access may choose multi-user or enterprise licenses for cost-effective access to the report.
13. Are there any additional resources or data provided in the Microgreens Market report?
While the report offers comprehensive insights, it's advisable to review the specific contents or supplementary materials provided to ascertain if additional resources or data are available.
14. How can I stay updated on further developments or reports in the Microgreens Market?
To stay informed about further developments, trends, and reports in the Microgreens Market, consider subscribing to industry newsletters, following relevant companies and organizations, or regularly checking reputable industry news sources and publications.
Methodology
Step 1 - Identification of Relevant Samples Size from Population Database


Step 2 - Approaches for Defining Global Market Size (Value, Volume* & Price*)

Note*: In applicable scenarios
Step 3 - Data Sources
Primary Research
- Web Analytics
- Survey Reports
- Research Institute
- Latest Research Reports
- Opinion Leaders
Secondary Research
- Annual Reports
- White Paper
- Latest Press Release
- Industry Association
- Paid Database
- Investor Presentations

Step 4 - Data Triangulation
Involves using different sources of information in order to increase the validity of a study
These sources are likely to be stakeholders in a program - participants, other researchers, program staff, other community members, and so on.
Then we put all data in single framework & apply various statistical tools to find out the dynamic on the market.
During the analysis stage, feedback from the stakeholder groups would be compared to determine areas of agreement as well as areas of divergence