

Key Insights
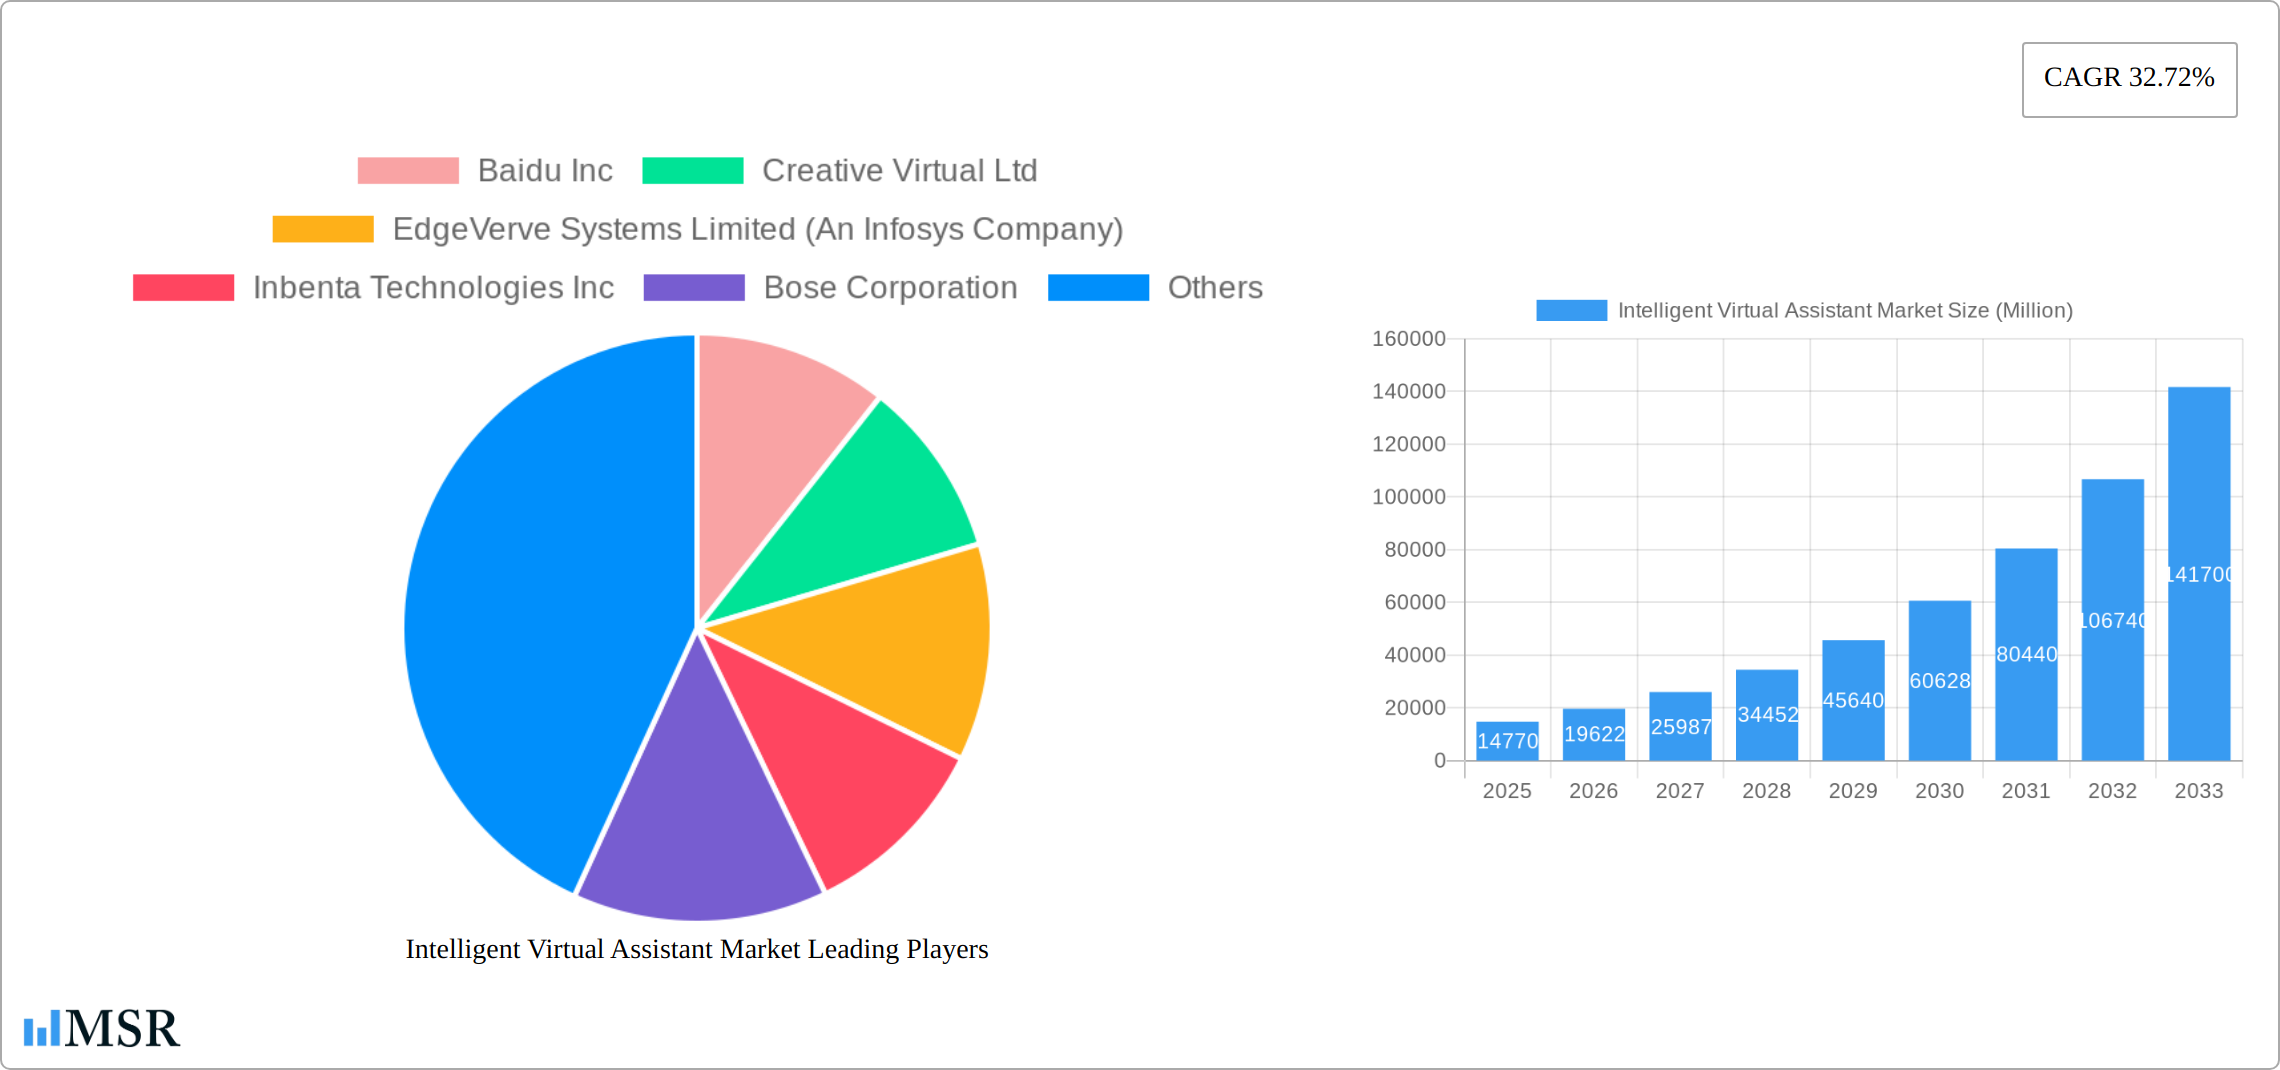
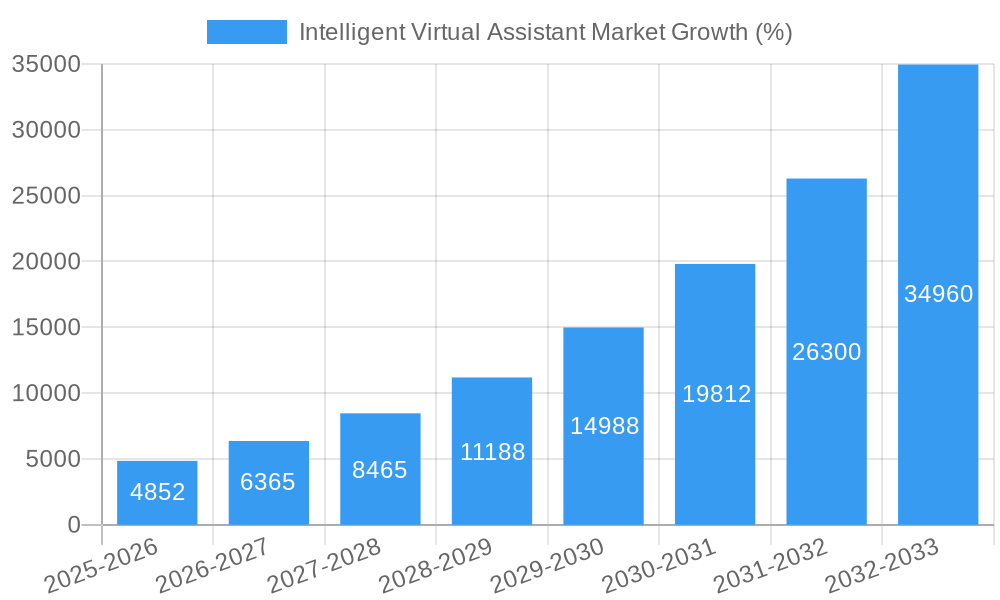
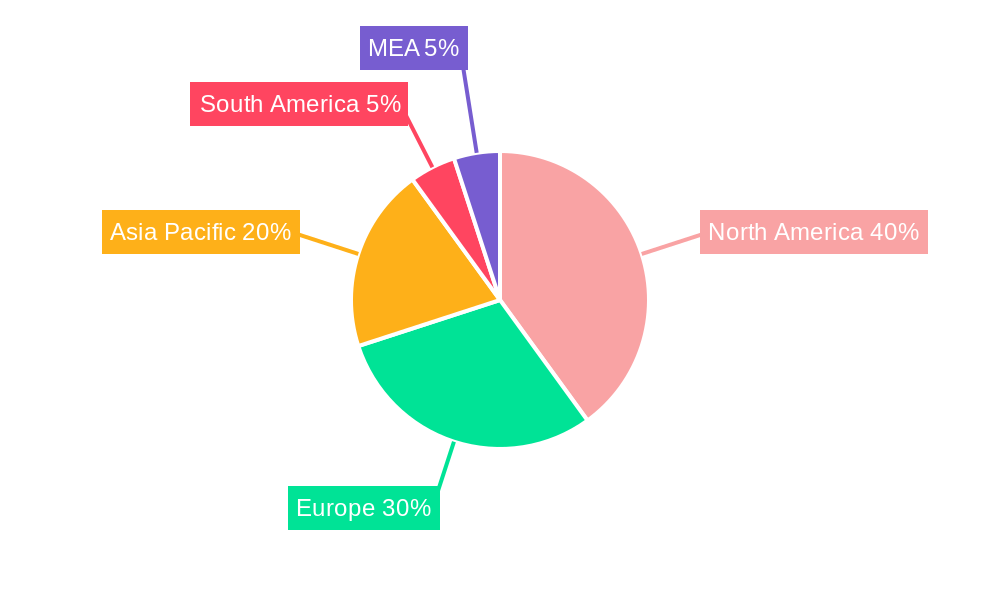
The Intelligent Virtual Assistant (IVA) market is experiencing explosive growth, projected to reach \$14.77 billion in 2025 and exhibiting a remarkable Compound Annual Growth Rate (CAGR) of 32.72%. This robust expansion is fueled by several key drivers. The increasing adoption of chatbots across various industries, from customer service to e-commerce, is a major contributor. Furthermore, the rising popularity of smart speakers in homes and businesses is significantly boosting demand for IVA technology. The seamless integration of text-to-text, text-to-speech, and automatic speech recognition functionalities further enhances user experience and drives market penetration. While data security concerns and the need for sophisticated natural language processing capabilities present some restraints, the overall market trajectory remains strongly positive. The diverse range of IVA applications across sectors like healthcare, finance, and retail, coupled with continuous technological advancements, promises substantial future growth. North America currently holds a significant market share, driven by early adoption and robust technological infrastructure, but the Asia-Pacific region is projected to witness the fastest growth in the coming years, fueled by increasing smartphone penetration and rising disposable incomes.
The competitive landscape is characterized by a mix of established tech giants like Google, Amazon, and IBM, alongside innovative startups specializing in IVA solutions. Key players are focusing on developing advanced AI capabilities, such as improved contextual understanding and personalized interactions, to enhance the value proposition of their offerings. Strategic partnerships and acquisitions are also becoming increasingly common as companies seek to expand their reach and enhance their technological capabilities. The market segmentation, encompassing chatbots, smart speakers, and diverse user interfaces, underscores the versatility and broad applicability of IVA technology. Future growth will likely be influenced by the development of more sophisticated AI models, advancements in natural language processing, and increased focus on data privacy and security. This will shape the evolution of IVAs towards more human-like and contextually aware interactions, further expanding market opportunities.
Intelligent Virtual Assistant Market Report: 2019-2033
This comprehensive report provides an in-depth analysis of the Intelligent Virtual Assistant (IVA) market, encompassing its current state, future trajectory, and key players. Covering the period from 2019 to 2033, with a focus on 2025, this report offers invaluable insights for businesses, investors, and researchers seeking to understand and capitalize on this rapidly evolving market. The global Intelligent Virtual Assistant market is projected to reach xx Million by 2033, exhibiting a significant CAGR.
Intelligent Virtual Assistant Market Market Concentration & Dynamics
The Intelligent Virtual Assistant market exhibits a moderately concentrated landscape, with several major players holding significant market share. However, the presence of numerous smaller, innovative companies indicates a dynamic and competitive environment. Market share data reveals that Amazon, Google, and Apple collectively account for approximately xx% of the market in 2025, while other significant players like IBM, Baidu, and Microsoft hold substantial individual shares. The innovation ecosystem is vibrant, fueled by advancements in AI, NLP, and machine learning. Regulatory frameworks concerning data privacy and security are evolving, influencing market practices. Substitute products, such as traditional customer service methods, are facing increased competition. End-user trends reveal a growing preference for seamless, personalized interactions, driving demand for sophisticated IVA solutions. M&A activity within the sector is moderately high, with approximately xx deals recorded in the last five years, primarily focused on acquiring smaller technology companies with specialized capabilities.
- Market Concentration: Moderately concentrated, dominated by a few major players.
- Innovation Ecosystem: Highly dynamic, driven by AI and NLP advancements.
- Regulatory Frameworks: Evolving, impacting data privacy and security.
- Substitute Products: Facing increased competition from IVA solutions.
- End-User Trends: Demand for personalized and seamless interactions.
- M&A Activity: Moderate level of mergers and acquisitions.
Intelligent Virtual Assistant Market Industry Insights & Trends
The Intelligent Virtual Assistant market is experiencing robust growth, driven by the increasing adoption of AI-powered solutions across various sectors. The market size reached xx Million in 2024 and is projected to reach xx Million by 2025, exhibiting a CAGR of xx% during the forecast period (2025-2033). This growth is propelled by several factors: the rising need for automation in customer service, the increasing demand for personalized user experiences, and the proliferation of smart devices. Technological disruptions, such as advancements in natural language processing (NLP) and machine learning (ML), are further enhancing the capabilities of IVAs, making them more intelligent and efficient. Evolving consumer behaviors, marked by a preference for convenient and readily available digital assistance, are significantly boosting market adoption. The convergence of these factors is shaping the future of the IVA market, promising continued expansion and innovation.
Key Markets & Segments Leading Intelligent Virtual Assistant Market
The Intelligent Virtual Assistant market is witnessing strong growth across various segments. Geographically, North America currently holds the largest market share, driven by high technological adoption rates and robust digital infrastructure. However, the Asia-Pacific region is expected to show substantial growth in the coming years due to rapid economic expansion and increasing smartphone penetration.
By End-User:
- Chatbots: Dominate the market, fueled by widespread adoption in customer service.
- Smart Speakers: Show significant growth potential, driven by increasing smart home adoption.
By Product:
- Chatbots: Leading segment, offering versatile applications across industries.
- Smart Speakers: Growing rapidly, leveraging voice-activated interfaces.
By User Interface:
- Text-to-Text: Remains a significant segment, offering simple and efficient interaction.
- Text-to-Speech & Automatic Speech Recognition: Exhibit strong growth due to enhanced user experience and accessibility.
Drivers:
- Economic growth in emerging markets fuels demand for advanced technologies.
- Expansion of high-speed internet infrastructure supports IVA adoption.
- Growing demand for personalized customer service across industries.
Intelligent Virtual Assistant Market Product Developments
Recent years have witnessed significant advancements in IVA technology, characterized by improvements in natural language understanding, context awareness, and personalization. The integration of machine learning algorithms is enabling IVAs to learn from user interactions, continuously improving their performance and accuracy. This has led to the development of more sophisticated IVAs capable of handling complex tasks and providing more natural and engaging user experiences. Such innovations are creating a competitive edge for companies offering advanced IVA solutions.
Challenges in the Intelligent Virtual Assistant Market Market
Several challenges hinder the growth of the Intelligent Virtual Assistant market. Regulatory hurdles related to data privacy and security, particularly concerning the handling of sensitive consumer information, pose significant challenges for IVA providers. Supply chain disruptions, especially related to the sourcing of essential components, can impact production and delivery timelines. Intense competition among established players and new entrants creates price pressure and necessitates continuous innovation to maintain a competitive edge. These factors collectively influence market growth and profitability.
Forces Driving Intelligent Virtual Assistant Market Growth
The Intelligent Virtual Assistant market is propelled by several key factors. Technological advancements, particularly in AI, NLP, and machine learning, are continuously enhancing IVA capabilities and functionalities. The increasing demand for cost-effective customer service solutions across diverse industries fuels market expansion. Favorable regulatory environments in certain regions, promoting technological innovation and data privacy, stimulate growth. The convergence of these factors creates a robust environment for sustainable market growth.
Challenges in the Intelligent Virtual Assistant Market Market (Long-Term Growth Catalysts)
Long-term growth in the Intelligent Virtual Assistant market hinges on several factors. Strategic partnerships between IVA providers and industry leaders can unlock new opportunities and accelerate market penetration. Continuous innovation in IVA technology, such as the development of more human-like interactions and broader functionalities, will be essential for sustained growth. Expanding into new markets and targeting previously untapped customer segments offer significant potential.
Emerging Opportunities in Intelligent Virtual Assistant Market
Emerging opportunities lie in expanding IVA applications to new sectors, such as healthcare, education, and finance, where personalized assistance can significantly improve efficiency and user experience. The integration of IVA technology with other emerging technologies, such as the Internet of Things (IoT) and augmented reality (AR), presents exciting possibilities. The growing demand for multilingual support and personalized experiences presents further growth avenues.
Leading Players in the Intelligent Virtual Assistant Market Sector
- Baidu Inc
- Creative Virtual Ltd
- EdgeVerve Systems Limited (An Infosys Company)
- Inbenta Technologies Inc
- Bose Corporation
- Kore ai Inc
- Harman-Kardon Inc
- IBM Corporation
- SMOOCH ai
- Google LLC (Alphabet Inc)
- Ipsoft Inc
- Sonos Inc
- Xiaomi Inc
- Avaamo Inc
- Amazon com Inc
- Serviceaide Inc
- Alibaba Group
- Apple Inc
Key Milestones in Intelligent Virtual Assistant Market Industry
- February 2022: IBM and TD Securities partnered to launch an AI-powered virtual assistant, enhancing customer experience in the TD Precious Metals digital shop. This collaboration demonstrated the increasing adoption of IVAs in the financial sector.
- May 2022: Sonos announced the development of its own voice assistant, Sonos Voice, indicating growing competition and innovation in the smart speaker market. This highlights the expansion of IVA capabilities beyond customer service.
Strategic Outlook for Intelligent Virtual Assistant Market Market
The Intelligent Virtual Assistant market is poised for substantial growth, driven by technological advancements, increased demand across diverse sectors, and strategic partnerships. Companies focusing on innovative solutions, personalized user experiences, and robust data security will be well-positioned to capitalize on the expanding market opportunities. The future holds immense potential for IVAs to revolutionize how humans interact with technology and businesses across numerous industries.
Intelligent Virtual Assistant Market Segmentation
-
1. Product
- 1.1. Chatbots
- 1.2. Smart Speakers
-
2. User Interface
- 2.1. Text-to-Text
- 2.2. Text-to-Speech
- 2.3. Automatic Speech Recognition
-
3. End-User
-
3.1. Chatbots
- 3.1.1. Retail
- 3.1.2. BFSI
- 3.1.3. Healthcare
- 3.1.4. Telecom
- 3.1.5. Travel and Hospitality
- 3.1.6. Other End-User Industries
-
3.2. Smart Speakers
- 3.2.1. Personal
- 3.2.2. Commercial
-
3.1. Chatbots
Intelligent Virtual Assistant Market Segmentation By Geography
-
1. North America
- 1.1. United States
- 1.2. Canada
-
2. Europe
- 2.1. Germany
- 2.2. United Kingdom
- 2.3. France
- 2.4. Spain
- 2.5. Rest of Europe
-
3. Asia Pacific
- 3.1. China
- 3.2. Japan
- 3.3. India
- 3.4. Rest of Asia Pacific
-
4. Latin America
- 4.1. Brazil
- 4.2. Argentina
- 4.3. Rest of Latin America
-
5. Middle East and Africa
- 5.1. UAE
- 5.2. Saudi Arabia
- 5.3. South Africa
- 5.4. Rest of Middle East and Africa
Intelligent Virtual Assistant Market REPORT HIGHLIGHTS
| Aspects | Details |
|---|---|
| Study Period | 2019-2033 |
| Base Year | 2024 |
| Estimated Year | 2025 |
| Forecast Period | 2025-2033 |
| Historical Period | 2019-2024 |
| Growth Rate | CAGR of 32.72% from 2019-2033 |
| Segmentation |
|
Table of Contents
- 1. Introduction
- 1.1. Research Scope
- 1.2. Market Segmentation
- 1.3. Research Methodology
- 1.4. Definitions and Assumptions
- 2. Executive Summary
- 2.1. Introduction
- 3. Market Dynamics
- 3.1. Introduction
- 3.2. Market Drivers
- 3.2.1. Increasing Focus to Improve Customer Experience across Professional Services; Smart Speakers to Drive the Market Growth
- 3.3. Market Restrains
- 3.3.1. Increasing Preference for Live Person Interaction
- 3.4. Market Trends
- 3.4.1. Smart Speakers to Drive the Market Growth
- 4. Market Factor Analysis
- 4.1. Porters Five Forces
- 4.2. Supply/Value Chain
- 4.3. PESTEL analysis
- 4.4. Market Entropy
- 4.5. Patent/Trademark Analysis
- 5. Global Intelligent Virtual Assistant Market Analysis, Insights and Forecast, 2019-2031
- 5.1. Market Analysis, Insights and Forecast - by Product
- 5.1.1. Chatbots
- 5.1.2. Smart Speakers
- 5.2. Market Analysis, Insights and Forecast - by User Interface
- 5.2.1. Text-to-Text
- 5.2.2. Text-to-Speech
- 5.2.3. Automatic Speech Recognition
- 5.3. Market Analysis, Insights and Forecast - by End-User
- 5.3.1. Chatbots
- 5.3.1.1. Retail
- 5.3.1.2. BFSI
- 5.3.1.3. Healthcare
- 5.3.1.4. Telecom
- 5.3.1.5. Travel and Hospitality
- 5.3.1.6. Other End-User Industries
- 5.3.2. Smart Speakers
- 5.3.2.1. Personal
- 5.3.2.2. Commercial
- 5.3.1. Chatbots
- 5.4. Market Analysis, Insights and Forecast - by Region
- 5.4.1. North America
- 5.4.2. Europe
- 5.4.3. Asia Pacific
- 5.4.4. Latin America
- 5.4.5. Middle East and Africa
- 5.1. Market Analysis, Insights and Forecast - by Product
- 6. North America Intelligent Virtual Assistant Market Analysis, Insights and Forecast, 2019-2031
- 6.1. Market Analysis, Insights and Forecast - by Product
- 6.1.1. Chatbots
- 6.1.2. Smart Speakers
- 6.2. Market Analysis, Insights and Forecast - by User Interface
- 6.2.1. Text-to-Text
- 6.2.2. Text-to-Speech
- 6.2.3. Automatic Speech Recognition
- 6.3. Market Analysis, Insights and Forecast - by End-User
- 6.3.1. Chatbots
- 6.3.1.1. Retail
- 6.3.1.2. BFSI
- 6.3.1.3. Healthcare
- 6.3.1.4. Telecom
- 6.3.1.5. Travel and Hospitality
- 6.3.1.6. Other End-User Industries
- 6.3.2. Smart Speakers
- 6.3.2.1. Personal
- 6.3.2.2. Commercial
- 6.3.1. Chatbots
- 6.1. Market Analysis, Insights and Forecast - by Product
- 7. Europe Intelligent Virtual Assistant Market Analysis, Insights and Forecast, 2019-2031
- 7.1. Market Analysis, Insights and Forecast - by Product
- 7.1.1. Chatbots
- 7.1.2. Smart Speakers
- 7.2. Market Analysis, Insights and Forecast - by User Interface
- 7.2.1. Text-to-Text
- 7.2.2. Text-to-Speech
- 7.2.3. Automatic Speech Recognition
- 7.3. Market Analysis, Insights and Forecast - by End-User
- 7.3.1. Chatbots
- 7.3.1.1. Retail
- 7.3.1.2. BFSI
- 7.3.1.3. Healthcare
- 7.3.1.4. Telecom
- 7.3.1.5. Travel and Hospitality
- 7.3.1.6. Other End-User Industries
- 7.3.2. Smart Speakers
- 7.3.2.1. Personal
- 7.3.2.2. Commercial
- 7.3.1. Chatbots
- 7.1. Market Analysis, Insights and Forecast - by Product
- 8. Asia Pacific Intelligent Virtual Assistant Market Analysis, Insights and Forecast, 2019-2031
- 8.1. Market Analysis, Insights and Forecast - by Product
- 8.1.1. Chatbots
- 8.1.2. Smart Speakers
- 8.2. Market Analysis, Insights and Forecast - by User Interface
- 8.2.1. Text-to-Text
- 8.2.2. Text-to-Speech
- 8.2.3. Automatic Speech Recognition
- 8.3. Market Analysis, Insights and Forecast - by End-User
- 8.3.1. Chatbots
- 8.3.1.1. Retail
- 8.3.1.2. BFSI
- 8.3.1.3. Healthcare
- 8.3.1.4. Telecom
- 8.3.1.5. Travel and Hospitality
- 8.3.1.6. Other End-User Industries
- 8.3.2. Smart Speakers
- 8.3.2.1. Personal
- 8.3.2.2. Commercial
- 8.3.1. Chatbots
- 8.1. Market Analysis, Insights and Forecast - by Product
- 9. Latin America Intelligent Virtual Assistant Market Analysis, Insights and Forecast, 2019-2031
- 9.1. Market Analysis, Insights and Forecast - by Product
- 9.1.1. Chatbots
- 9.1.2. Smart Speakers
- 9.2. Market Analysis, Insights and Forecast - by User Interface
- 9.2.1. Text-to-Text
- 9.2.2. Text-to-Speech
- 9.2.3. Automatic Speech Recognition
- 9.3. Market Analysis, Insights and Forecast - by End-User
- 9.3.1. Chatbots
- 9.3.1.1. Retail
- 9.3.1.2. BFSI
- 9.3.1.3. Healthcare
- 9.3.1.4. Telecom
- 9.3.1.5. Travel and Hospitality
- 9.3.1.6. Other End-User Industries
- 9.3.2. Smart Speakers
- 9.3.2.1. Personal
- 9.3.2.2. Commercial
- 9.3.1. Chatbots
- 9.1. Market Analysis, Insights and Forecast - by Product
- 10. Middle East and Africa Intelligent Virtual Assistant Market Analysis, Insights and Forecast, 2019-2031
- 10.1. Market Analysis, Insights and Forecast - by Product
- 10.1.1. Chatbots
- 10.1.2. Smart Speakers
- 10.2. Market Analysis, Insights and Forecast - by User Interface
- 10.2.1. Text-to-Text
- 10.2.2. Text-to-Speech
- 10.2.3. Automatic Speech Recognition
- 10.3. Market Analysis, Insights and Forecast - by End-User
- 10.3.1. Chatbots
- 10.3.1.1. Retail
- 10.3.1.2. BFSI
- 10.3.1.3. Healthcare
- 10.3.1.4. Telecom
- 10.3.1.5. Travel and Hospitality
- 10.3.1.6. Other End-User Industries
- 10.3.2. Smart Speakers
- 10.3.2.1. Personal
- 10.3.2.2. Commercial
- 10.3.1. Chatbots
- 10.1. Market Analysis, Insights and Forecast - by Product
- 11. North America Intelligent Virtual Assistant Market Analysis, Insights and Forecast, 2019-2031
- 11.1. Market Analysis, Insights and Forecast - By Country/Sub-region
- 11.1.1 United States
- 11.1.2 Canada
- 11.1.3 Mexico
- 12. Europe Intelligent Virtual Assistant Market Analysis, Insights and Forecast, 2019-2031
- 12.1. Market Analysis, Insights and Forecast - By Country/Sub-region
- 12.1.1 Germany
- 12.1.2 United Kingdom
- 12.1.3 France
- 12.1.4 Spain
- 12.1.5 Italy
- 12.1.6 Spain
- 12.1.7 Belgium
- 12.1.8 Netherland
- 12.1.9 Nordics
- 12.1.10 Rest of Europe
- 13. Asia Pacific Intelligent Virtual Assistant Market Analysis, Insights and Forecast, 2019-2031
- 13.1. Market Analysis, Insights and Forecast - By Country/Sub-region
- 13.1.1 China
- 13.1.2 Japan
- 13.1.3 India
- 13.1.4 South Korea
- 13.1.5 Southeast Asia
- 13.1.6 Australia
- 13.1.7 Indonesia
- 13.1.8 Phillipes
- 13.1.9 Singapore
- 13.1.10 Thailandc
- 13.1.11 Rest of Asia Pacific
- 14. South America Intelligent Virtual Assistant Market Analysis, Insights and Forecast, 2019-2031
- 14.1. Market Analysis, Insights and Forecast - By Country/Sub-region
- 14.1.1 Brazil
- 14.1.2 Argentina
- 14.1.3 Peru
- 14.1.4 Chile
- 14.1.5 Colombia
- 14.1.6 Ecuador
- 14.1.7 Venezuela
- 14.1.8 Rest of South America
- 15. North America Intelligent Virtual Assistant Market Analysis, Insights and Forecast, 2019-2031
- 15.1. Market Analysis, Insights and Forecast - By Country/Sub-region
- 15.1.1 United States
- 15.1.2 Canada
- 15.1.3 Mexico
- 16. MEA Intelligent Virtual Assistant Market Analysis, Insights and Forecast, 2019-2031
- 16.1. Market Analysis, Insights and Forecast - By Country/Sub-region
- 16.1.1 United Arab Emirates
- 16.1.2 Saudi Arabia
- 16.1.3 South Africa
- 16.1.4 Rest of Middle East and Africa
- 17. Competitive Analysis
- 17.1. Global Market Share Analysis 2024
- 17.2. Company Profiles
- 17.2.1 Baidu Inc
- 17.2.1.1. Overview
- 17.2.1.2. Products
- 17.2.1.3. SWOT Analysis
- 17.2.1.4. Recent Developments
- 17.2.1.5. Financials (Based on Availability)
- 17.2.2 Creative Virtual Ltd
- 17.2.2.1. Overview
- 17.2.2.2. Products
- 17.2.2.3. SWOT Analysis
- 17.2.2.4. Recent Developments
- 17.2.2.5. Financials (Based on Availability)
- 17.2.3 EdgeVerve Systems Limited (An Infosys Company)
- 17.2.3.1. Overview
- 17.2.3.2. Products
- 17.2.3.3. SWOT Analysis
- 17.2.3.4. Recent Developments
- 17.2.3.5. Financials (Based on Availability)
- 17.2.4 Inbenta Technologies Inc
- 17.2.4.1. Overview
- 17.2.4.2. Products
- 17.2.4.3. SWOT Analysis
- 17.2.4.4. Recent Developments
- 17.2.4.5. Financials (Based on Availability)
- 17.2.5 Bose Corporation
- 17.2.5.1. Overview
- 17.2.5.2. Products
- 17.2.5.3. SWOT Analysis
- 17.2.5.4. Recent Developments
- 17.2.5.5. Financials (Based on Availability)
- 17.2.6 Kore ai Inc
- 17.2.6.1. Overview
- 17.2.6.2. Products
- 17.2.6.3. SWOT Analysis
- 17.2.6.4. Recent Developments
- 17.2.6.5. Financials (Based on Availability)
- 17.2.7 Harman-Kardon Inc
- 17.2.7.1. Overview
- 17.2.7.2. Products
- 17.2.7.3. SWOT Analysis
- 17.2.7.4. Recent Developments
- 17.2.7.5. Financials (Based on Availability)
- 17.2.8 IBM Corporation
- 17.2.8.1. Overview
- 17.2.8.2. Products
- 17.2.8.3. SWOT Analysis
- 17.2.8.4. Recent Developments
- 17.2.8.5. Financials (Based on Availability)
- 17.2.9 SMOOCH ai
- 17.2.9.1. Overview
- 17.2.9.2. Products
- 17.2.9.3. SWOT Analysis
- 17.2.9.4. Recent Developments
- 17.2.9.5. Financials (Based on Availability)
- 17.2.10 Google LLC (Alphabet Inc )
- 17.2.10.1. Overview
- 17.2.10.2. Products
- 17.2.10.3. SWOT Analysis
- 17.2.10.4. Recent Developments
- 17.2.10.5. Financials (Based on Availability)
- 17.2.11 Ipsoft Inc
- 17.2.11.1. Overview
- 17.2.11.2. Products
- 17.2.11.3. SWOT Analysis
- 17.2.11.4. Recent Developments
- 17.2.11.5. Financials (Based on Availability)
- 17.2.12 Sonos Inc
- 17.2.12.1. Overview
- 17.2.12.2. Products
- 17.2.12.3. SWOT Analysis
- 17.2.12.4. Recent Developments
- 17.2.12.5. Financials (Based on Availability)
- 17.2.13 Xiaomi Inc
- 17.2.13.1. Overview
- 17.2.13.2. Products
- 17.2.13.3. SWOT Analysis
- 17.2.13.4. Recent Developments
- 17.2.13.5. Financials (Based on Availability)
- 17.2.14 Avaamo Inc
- 17.2.14.1. Overview
- 17.2.14.2. Products
- 17.2.14.3. SWOT Analysis
- 17.2.14.4. Recent Developments
- 17.2.14.5. Financials (Based on Availability)
- 17.2.15 Amazon com Inc
- 17.2.15.1. Overview
- 17.2.15.2. Products
- 17.2.15.3. SWOT Analysis
- 17.2.15.4. Recent Developments
- 17.2.15.5. Financials (Based on Availability)
- 17.2.16 Serviceaide Inc
- 17.2.16.1. Overview
- 17.2.16.2. Products
- 17.2.16.3. SWOT Analysis
- 17.2.16.4. Recent Developments
- 17.2.16.5. Financials (Based on Availability)
- 17.2.17 Alibaba Group
- 17.2.17.1. Overview
- 17.2.17.2. Products
- 17.2.17.3. SWOT Analysis
- 17.2.17.4. Recent Developments
- 17.2.17.5. Financials (Based on Availability)
- 17.2.18 Apple Inc
- 17.2.18.1. Overview
- 17.2.18.2. Products
- 17.2.18.3. SWOT Analysis
- 17.2.18.4. Recent Developments
- 17.2.18.5. Financials (Based on Availability)
- 17.2.1 Baidu Inc
List of Figures
- Figure 1: Global Intelligent Virtual Assistant Market Revenue Breakdown (Million, %) by Region 2024 & 2032
- Figure 2: Global Intelligent Virtual Assistant Market Volume Breakdown (K Unit, %) by Region 2024 & 2032
- Figure 3: North America Intelligent Virtual Assistant Market Revenue (Million), by Country 2024 & 2032
- Figure 4: North America Intelligent Virtual Assistant Market Volume (K Unit), by Country 2024 & 2032
- Figure 5: North America Intelligent Virtual Assistant Market Revenue Share (%), by Country 2024 & 2032
- Figure 6: North America Intelligent Virtual Assistant Market Volume Share (%), by Country 2024 & 2032
- Figure 7: Europe Intelligent Virtual Assistant Market Revenue (Million), by Country 2024 & 2032
- Figure 8: Europe Intelligent Virtual Assistant Market Volume (K Unit), by Country 2024 & 2032
- Figure 9: Europe Intelligent Virtual Assistant Market Revenue Share (%), by Country 2024 & 2032
- Figure 10: Europe Intelligent Virtual Assistant Market Volume Share (%), by Country 2024 & 2032
- Figure 11: Asia Pacific Intelligent Virtual Assistant Market Revenue (Million), by Country 2024 & 2032
- Figure 12: Asia Pacific Intelligent Virtual Assistant Market Volume (K Unit), by Country 2024 & 2032
- Figure 13: Asia Pacific Intelligent Virtual Assistant Market Revenue Share (%), by Country 2024 & 2032
- Figure 14: Asia Pacific Intelligent Virtual Assistant Market Volume Share (%), by Country 2024 & 2032
- Figure 15: South America Intelligent Virtual Assistant Market Revenue (Million), by Country 2024 & 2032
- Figure 16: South America Intelligent Virtual Assistant Market Volume (K Unit), by Country 2024 & 2032
- Figure 17: South America Intelligent Virtual Assistant Market Revenue Share (%), by Country 2024 & 2032
- Figure 18: South America Intelligent Virtual Assistant Market Volume Share (%), by Country 2024 & 2032
- Figure 19: North America Intelligent Virtual Assistant Market Revenue (Million), by Country 2024 & 2032
- Figure 20: North America Intelligent Virtual Assistant Market Volume (K Unit), by Country 2024 & 2032
- Figure 21: North America Intelligent Virtual Assistant Market Revenue Share (%), by Country 2024 & 2032
- Figure 22: North America Intelligent Virtual Assistant Market Volume Share (%), by Country 2024 & 2032
- Figure 23: MEA Intelligent Virtual Assistant Market Revenue (Million), by Country 2024 & 2032
- Figure 24: MEA Intelligent Virtual Assistant Market Volume (K Unit), by Country 2024 & 2032
- Figure 25: MEA Intelligent Virtual Assistant Market Revenue Share (%), by Country 2024 & 2032
- Figure 26: MEA Intelligent Virtual Assistant Market Volume Share (%), by Country 2024 & 2032
- Figure 27: North America Intelligent Virtual Assistant Market Revenue (Million), by Product 2024 & 2032
- Figure 28: North America Intelligent Virtual Assistant Market Volume (K Unit), by Product 2024 & 2032
- Figure 29: North America Intelligent Virtual Assistant Market Revenue Share (%), by Product 2024 & 2032
- Figure 30: North America Intelligent Virtual Assistant Market Volume Share (%), by Product 2024 & 2032
- Figure 31: North America Intelligent Virtual Assistant Market Revenue (Million), by User Interface 2024 & 2032
- Figure 32: North America Intelligent Virtual Assistant Market Volume (K Unit), by User Interface 2024 & 2032
- Figure 33: North America Intelligent Virtual Assistant Market Revenue Share (%), by User Interface 2024 & 2032
- Figure 34: North America Intelligent Virtual Assistant Market Volume Share (%), by User Interface 2024 & 2032
- Figure 35: North America Intelligent Virtual Assistant Market Revenue (Million), by End-User 2024 & 2032
- Figure 36: North America Intelligent Virtual Assistant Market Volume (K Unit), by End-User 2024 & 2032
- Figure 37: North America Intelligent Virtual Assistant Market Revenue Share (%), by End-User 2024 & 2032
- Figure 38: North America Intelligent Virtual Assistant Market Volume Share (%), by End-User 2024 & 2032
- Figure 39: North America Intelligent Virtual Assistant Market Revenue (Million), by Country 2024 & 2032
- Figure 40: North America Intelligent Virtual Assistant Market Volume (K Unit), by Country 2024 & 2032
- Figure 41: North America Intelligent Virtual Assistant Market Revenue Share (%), by Country 2024 & 2032
- Figure 42: North America Intelligent Virtual Assistant Market Volume Share (%), by Country 2024 & 2032
- Figure 43: Europe Intelligent Virtual Assistant Market Revenue (Million), by Product 2024 & 2032
- Figure 44: Europe Intelligent Virtual Assistant Market Volume (K Unit), by Product 2024 & 2032
- Figure 45: Europe Intelligent Virtual Assistant Market Revenue Share (%), by Product 2024 & 2032
- Figure 46: Europe Intelligent Virtual Assistant Market Volume Share (%), by Product 2024 & 2032
- Figure 47: Europe Intelligent Virtual Assistant Market Revenue (Million), by User Interface 2024 & 2032
- Figure 48: Europe Intelligent Virtual Assistant Market Volume (K Unit), by User Interface 2024 & 2032
- Figure 49: Europe Intelligent Virtual Assistant Market Revenue Share (%), by User Interface 2024 & 2032
- Figure 50: Europe Intelligent Virtual Assistant Market Volume Share (%), by User Interface 2024 & 2032
- Figure 51: Europe Intelligent Virtual Assistant Market Revenue (Million), by End-User 2024 & 2032
- Figure 52: Europe Intelligent Virtual Assistant Market Volume (K Unit), by End-User 2024 & 2032
- Figure 53: Europe Intelligent Virtual Assistant Market Revenue Share (%), by End-User 2024 & 2032
- Figure 54: Europe Intelligent Virtual Assistant Market Volume Share (%), by End-User 2024 & 2032
- Figure 55: Europe Intelligent Virtual Assistant Market Revenue (Million), by Country 2024 & 2032
- Figure 56: Europe Intelligent Virtual Assistant Market Volume (K Unit), by Country 2024 & 2032
- Figure 57: Europe Intelligent Virtual Assistant Market Revenue Share (%), by Country 2024 & 2032
- Figure 58: Europe Intelligent Virtual Assistant Market Volume Share (%), by Country 2024 & 2032
- Figure 59: Asia Pacific Intelligent Virtual Assistant Market Revenue (Million), by Product 2024 & 2032
- Figure 60: Asia Pacific Intelligent Virtual Assistant Market Volume (K Unit), by Product 2024 & 2032
- Figure 61: Asia Pacific Intelligent Virtual Assistant Market Revenue Share (%), by Product 2024 & 2032
- Figure 62: Asia Pacific Intelligent Virtual Assistant Market Volume Share (%), by Product 2024 & 2032
- Figure 63: Asia Pacific Intelligent Virtual Assistant Market Revenue (Million), by User Interface 2024 & 2032
- Figure 64: Asia Pacific Intelligent Virtual Assistant Market Volume (K Unit), by User Interface 2024 & 2032
- Figure 65: Asia Pacific Intelligent Virtual Assistant Market Revenue Share (%), by User Interface 2024 & 2032
- Figure 66: Asia Pacific Intelligent Virtual Assistant Market Volume Share (%), by User Interface 2024 & 2032
- Figure 67: Asia Pacific Intelligent Virtual Assistant Market Revenue (Million), by End-User 2024 & 2032
- Figure 68: Asia Pacific Intelligent Virtual Assistant Market Volume (K Unit), by End-User 2024 & 2032
- Figure 69: Asia Pacific Intelligent Virtual Assistant Market Revenue Share (%), by End-User 2024 & 2032
- Figure 70: Asia Pacific Intelligent Virtual Assistant Market Volume Share (%), by End-User 2024 & 2032
- Figure 71: Asia Pacific Intelligent Virtual Assistant Market Revenue (Million), by Country 2024 & 2032
- Figure 72: Asia Pacific Intelligent Virtual Assistant Market Volume (K Unit), by Country 2024 & 2032
- Figure 73: Asia Pacific Intelligent Virtual Assistant Market Revenue Share (%), by Country 2024 & 2032
- Figure 74: Asia Pacific Intelligent Virtual Assistant Market Volume Share (%), by Country 2024 & 2032
- Figure 75: Latin America Intelligent Virtual Assistant Market Revenue (Million), by Product 2024 & 2032
- Figure 76: Latin America Intelligent Virtual Assistant Market Volume (K Unit), by Product 2024 & 2032
- Figure 77: Latin America Intelligent Virtual Assistant Market Revenue Share (%), by Product 2024 & 2032
- Figure 78: Latin America Intelligent Virtual Assistant Market Volume Share (%), by Product 2024 & 2032
- Figure 79: Latin America Intelligent Virtual Assistant Market Revenue (Million), by User Interface 2024 & 2032
- Figure 80: Latin America Intelligent Virtual Assistant Market Volume (K Unit), by User Interface 2024 & 2032
- Figure 81: Latin America Intelligent Virtual Assistant Market Revenue Share (%), by User Interface 2024 & 2032
- Figure 82: Latin America Intelligent Virtual Assistant Market Volume Share (%), by User Interface 2024 & 2032
- Figure 83: Latin America Intelligent Virtual Assistant Market Revenue (Million), by End-User 2024 & 2032
- Figure 84: Latin America Intelligent Virtual Assistant Market Volume (K Unit), by End-User 2024 & 2032
- Figure 85: Latin America Intelligent Virtual Assistant Market Revenue Share (%), by End-User 2024 & 2032
- Figure 86: Latin America Intelligent Virtual Assistant Market Volume Share (%), by End-User 2024 & 2032
- Figure 87: Latin America Intelligent Virtual Assistant Market Revenue (Million), by Country 2024 & 2032
- Figure 88: Latin America Intelligent Virtual Assistant Market Volume (K Unit), by Country 2024 & 2032
- Figure 89: Latin America Intelligent Virtual Assistant Market Revenue Share (%), by Country 2024 & 2032
- Figure 90: Latin America Intelligent Virtual Assistant Market Volume Share (%), by Country 2024 & 2032
- Figure 91: Middle East and Africa Intelligent Virtual Assistant Market Revenue (Million), by Product 2024 & 2032
- Figure 92: Middle East and Africa Intelligent Virtual Assistant Market Volume (K Unit), by Product 2024 & 2032
- Figure 93: Middle East and Africa Intelligent Virtual Assistant Market Revenue Share (%), by Product 2024 & 2032
- Figure 94: Middle East and Africa Intelligent Virtual Assistant Market Volume Share (%), by Product 2024 & 2032
- Figure 95: Middle East and Africa Intelligent Virtual Assistant Market Revenue (Million), by User Interface 2024 & 2032
- Figure 96: Middle East and Africa Intelligent Virtual Assistant Market Volume (K Unit), by User Interface 2024 & 2032
- Figure 97: Middle East and Africa Intelligent Virtual Assistant Market Revenue Share (%), by User Interface 2024 & 2032
- Figure 98: Middle East and Africa Intelligent Virtual Assistant Market Volume Share (%), by User Interface 2024 & 2032
- Figure 99: Middle East and Africa Intelligent Virtual Assistant Market Revenue (Million), by End-User 2024 & 2032
- Figure 100: Middle East and Africa Intelligent Virtual Assistant Market Volume (K Unit), by End-User 2024 & 2032
- Figure 101: Middle East and Africa Intelligent Virtual Assistant Market Revenue Share (%), by End-User 2024 & 2032
- Figure 102: Middle East and Africa Intelligent Virtual Assistant Market Volume Share (%), by End-User 2024 & 2032
- Figure 103: Middle East and Africa Intelligent Virtual Assistant Market Revenue (Million), by Country 2024 & 2032
- Figure 104: Middle East and Africa Intelligent Virtual Assistant Market Volume (K Unit), by Country 2024 & 2032
- Figure 105: Middle East and Africa Intelligent Virtual Assistant Market Revenue Share (%), by Country 2024 & 2032
- Figure 106: Middle East and Africa Intelligent Virtual Assistant Market Volume Share (%), by Country 2024 & 2032
List of Tables
- Table 1: Global Intelligent Virtual Assistant Market Revenue Million Forecast, by Region 2019 & 2032
- Table 2: Global Intelligent Virtual Assistant Market Volume K Unit Forecast, by Region 2019 & 2032
- Table 3: Global Intelligent Virtual Assistant Market Revenue Million Forecast, by Product 2019 & 2032
- Table 4: Global Intelligent Virtual Assistant Market Volume K Unit Forecast, by Product 2019 & 2032
- Table 5: Global Intelligent Virtual Assistant Market Revenue Million Forecast, by User Interface 2019 & 2032
- Table 6: Global Intelligent Virtual Assistant Market Volume K Unit Forecast, by User Interface 2019 & 2032
- Table 7: Global Intelligent Virtual Assistant Market Revenue Million Forecast, by End-User 2019 & 2032
- Table 8: Global Intelligent Virtual Assistant Market Volume K Unit Forecast, by End-User 2019 & 2032
- Table 9: Global Intelligent Virtual Assistant Market Revenue Million Forecast, by Region 2019 & 2032
- Table 10: Global Intelligent Virtual Assistant Market Volume K Unit Forecast, by Region 2019 & 2032
- Table 11: Global Intelligent Virtual Assistant Market Revenue Million Forecast, by Country 2019 & 2032
- Table 12: Global Intelligent Virtual Assistant Market Volume K Unit Forecast, by Country 2019 & 2032
- Table 13: United States Intelligent Virtual Assistant Market Revenue (Million) Forecast, by Application 2019 & 2032
- Table 14: United States Intelligent Virtual Assistant Market Volume (K Unit) Forecast, by Application 2019 & 2032
- Table 15: Canada Intelligent Virtual Assistant Market Revenue (Million) Forecast, by Application 2019 & 2032
- Table 16: Canada Intelligent Virtual Assistant Market Volume (K Unit) Forecast, by Application 2019 & 2032
- Table 17: Mexico Intelligent Virtual Assistant Market Revenue (Million) Forecast, by Application 2019 & 2032
- Table 18: Mexico Intelligent Virtual Assistant Market Volume (K Unit) Forecast, by Application 2019 & 2032
- Table 19: Global Intelligent Virtual Assistant Market Revenue Million Forecast, by Country 2019 & 2032
- Table 20: Global Intelligent Virtual Assistant Market Volume K Unit Forecast, by Country 2019 & 2032
- Table 21: Germany Intelligent Virtual Assistant Market Revenue (Million) Forecast, by Application 2019 & 2032
- Table 22: Germany Intelligent Virtual Assistant Market Volume (K Unit) Forecast, by Application 2019 & 2032
- Table 23: United Kingdom Intelligent Virtual Assistant Market Revenue (Million) Forecast, by Application 2019 & 2032
- Table 24: United Kingdom Intelligent Virtual Assistant Market Volume (K Unit) Forecast, by Application 2019 & 2032
- Table 25: France Intelligent Virtual Assistant Market Revenue (Million) Forecast, by Application 2019 & 2032
- Table 26: France Intelligent Virtual Assistant Market Volume (K Unit) Forecast, by Application 2019 & 2032
- Table 27: Spain Intelligent Virtual Assistant Market Revenue (Million) Forecast, by Application 2019 & 2032
- Table 28: Spain Intelligent Virtual Assistant Market Volume (K Unit) Forecast, by Application 2019 & 2032
- Table 29: Italy Intelligent Virtual Assistant Market Revenue (Million) Forecast, by Application 2019 & 2032
- Table 30: Italy Intelligent Virtual Assistant Market Volume (K Unit) Forecast, by Application 2019 & 2032
- Table 31: Spain Intelligent Virtual Assistant Market Revenue (Million) Forecast, by Application 2019 & 2032
- Table 32: Spain Intelligent Virtual Assistant Market Volume (K Unit) Forecast, by Application 2019 & 2032
- Table 33: Belgium Intelligent Virtual Assistant Market Revenue (Million) Forecast, by Application 2019 & 2032
- Table 34: Belgium Intelligent Virtual Assistant Market Volume (K Unit) Forecast, by Application 2019 & 2032
- Table 35: Netherland Intelligent Virtual Assistant Market Revenue (Million) Forecast, by Application 2019 & 2032
- Table 36: Netherland Intelligent Virtual Assistant Market Volume (K Unit) Forecast, by Application 2019 & 2032
- Table 37: Nordics Intelligent Virtual Assistant Market Revenue (Million) Forecast, by Application 2019 & 2032
- Table 38: Nordics Intelligent Virtual Assistant Market Volume (K Unit) Forecast, by Application 2019 & 2032
- Table 39: Rest of Europe Intelligent Virtual Assistant Market Revenue (Million) Forecast, by Application 2019 & 2032
- Table 40: Rest of Europe Intelligent Virtual Assistant Market Volume (K Unit) Forecast, by Application 2019 & 2032
- Table 41: Global Intelligent Virtual Assistant Market Revenue Million Forecast, by Country 2019 & 2032
- Table 42: Global Intelligent Virtual Assistant Market Volume K Unit Forecast, by Country 2019 & 2032
- Table 43: China Intelligent Virtual Assistant Market Revenue (Million) Forecast, by Application 2019 & 2032
- Table 44: China Intelligent Virtual Assistant Market Volume (K Unit) Forecast, by Application 2019 & 2032
- Table 45: Japan Intelligent Virtual Assistant Market Revenue (Million) Forecast, by Application 2019 & 2032
- Table 46: Japan Intelligent Virtual Assistant Market Volume (K Unit) Forecast, by Application 2019 & 2032
- Table 47: India Intelligent Virtual Assistant Market Revenue (Million) Forecast, by Application 2019 & 2032
- Table 48: India Intelligent Virtual Assistant Market Volume (K Unit) Forecast, by Application 2019 & 2032
- Table 49: South Korea Intelligent Virtual Assistant Market Revenue (Million) Forecast, by Application 2019 & 2032
- Table 50: South Korea Intelligent Virtual Assistant Market Volume (K Unit) Forecast, by Application 2019 & 2032
- Table 51: Southeast Asia Intelligent Virtual Assistant Market Revenue (Million) Forecast, by Application 2019 & 2032
- Table 52: Southeast Asia Intelligent Virtual Assistant Market Volume (K Unit) Forecast, by Application 2019 & 2032
- Table 53: Australia Intelligent Virtual Assistant Market Revenue (Million) Forecast, by Application 2019 & 2032
- Table 54: Australia Intelligent Virtual Assistant Market Volume (K Unit) Forecast, by Application 2019 & 2032
- Table 55: Indonesia Intelligent Virtual Assistant Market Revenue (Million) Forecast, by Application 2019 & 2032
- Table 56: Indonesia Intelligent Virtual Assistant Market Volume (K Unit) Forecast, by Application 2019 & 2032
- Table 57: Phillipes Intelligent Virtual Assistant Market Revenue (Million) Forecast, by Application 2019 & 2032
- Table 58: Phillipes Intelligent Virtual Assistant Market Volume (K Unit) Forecast, by Application 2019 & 2032
- Table 59: Singapore Intelligent Virtual Assistant Market Revenue (Million) Forecast, by Application 2019 & 2032
- Table 60: Singapore Intelligent Virtual Assistant Market Volume (K Unit) Forecast, by Application 2019 & 2032
- Table 61: Thailandc Intelligent Virtual Assistant Market Revenue (Million) Forecast, by Application 2019 & 2032
- Table 62: Thailandc Intelligent Virtual Assistant Market Volume (K Unit) Forecast, by Application 2019 & 2032
- Table 63: Rest of Asia Pacific Intelligent Virtual Assistant Market Revenue (Million) Forecast, by Application 2019 & 2032
- Table 64: Rest of Asia Pacific Intelligent Virtual Assistant Market Volume (K Unit) Forecast, by Application 2019 & 2032
- Table 65: Global Intelligent Virtual Assistant Market Revenue Million Forecast, by Country 2019 & 2032
- Table 66: Global Intelligent Virtual Assistant Market Volume K Unit Forecast, by Country 2019 & 2032
- Table 67: Brazil Intelligent Virtual Assistant Market Revenue (Million) Forecast, by Application 2019 & 2032
- Table 68: Brazil Intelligent Virtual Assistant Market Volume (K Unit) Forecast, by Application 2019 & 2032
- Table 69: Argentina Intelligent Virtual Assistant Market Revenue (Million) Forecast, by Application 2019 & 2032
- Table 70: Argentina Intelligent Virtual Assistant Market Volume (K Unit) Forecast, by Application 2019 & 2032
- Table 71: Peru Intelligent Virtual Assistant Market Revenue (Million) Forecast, by Application 2019 & 2032
- Table 72: Peru Intelligent Virtual Assistant Market Volume (K Unit) Forecast, by Application 2019 & 2032
- Table 73: Chile Intelligent Virtual Assistant Market Revenue (Million) Forecast, by Application 2019 & 2032
- Table 74: Chile Intelligent Virtual Assistant Market Volume (K Unit) Forecast, by Application 2019 & 2032
- Table 75: Colombia Intelligent Virtual Assistant Market Revenue (Million) Forecast, by Application 2019 & 2032
- Table 76: Colombia Intelligent Virtual Assistant Market Volume (K Unit) Forecast, by Application 2019 & 2032
- Table 77: Ecuador Intelligent Virtual Assistant Market Revenue (Million) Forecast, by Application 2019 & 2032
- Table 78: Ecuador Intelligent Virtual Assistant Market Volume (K Unit) Forecast, by Application 2019 & 2032
- Table 79: Venezuela Intelligent Virtual Assistant Market Revenue (Million) Forecast, by Application 2019 & 2032
- Table 80: Venezuela Intelligent Virtual Assistant Market Volume (K Unit) Forecast, by Application 2019 & 2032
- Table 81: Rest of South America Intelligent Virtual Assistant Market Revenue (Million) Forecast, by Application 2019 & 2032
- Table 82: Rest of South America Intelligent Virtual Assistant Market Volume (K Unit) Forecast, by Application 2019 & 2032
- Table 83: Global Intelligent Virtual Assistant Market Revenue Million Forecast, by Country 2019 & 2032
- Table 84: Global Intelligent Virtual Assistant Market Volume K Unit Forecast, by Country 2019 & 2032
- Table 85: United States Intelligent Virtual Assistant Market Revenue (Million) Forecast, by Application 2019 & 2032
- Table 86: United States Intelligent Virtual Assistant Market Volume (K Unit) Forecast, by Application 2019 & 2032
- Table 87: Canada Intelligent Virtual Assistant Market Revenue (Million) Forecast, by Application 2019 & 2032
- Table 88: Canada Intelligent Virtual Assistant Market Volume (K Unit) Forecast, by Application 2019 & 2032
- Table 89: Mexico Intelligent Virtual Assistant Market Revenue (Million) Forecast, by Application 2019 & 2032
- Table 90: Mexico Intelligent Virtual Assistant Market Volume (K Unit) Forecast, by Application 2019 & 2032
- Table 91: Global Intelligent Virtual Assistant Market Revenue Million Forecast, by Country 2019 & 2032
- Table 92: Global Intelligent Virtual Assistant Market Volume K Unit Forecast, by Country 2019 & 2032
- Table 93: United Arab Emirates Intelligent Virtual Assistant Market Revenue (Million) Forecast, by Application 2019 & 2032
- Table 94: United Arab Emirates Intelligent Virtual Assistant Market Volume (K Unit) Forecast, by Application 2019 & 2032
- Table 95: Saudi Arabia Intelligent Virtual Assistant Market Revenue (Million) Forecast, by Application 2019 & 2032
- Table 96: Saudi Arabia Intelligent Virtual Assistant Market Volume (K Unit) Forecast, by Application 2019 & 2032
- Table 97: South Africa Intelligent Virtual Assistant Market Revenue (Million) Forecast, by Application 2019 & 2032
- Table 98: South Africa Intelligent Virtual Assistant Market Volume (K Unit) Forecast, by Application 2019 & 2032
- Table 99: Rest of Middle East and Africa Intelligent Virtual Assistant Market Revenue (Million) Forecast, by Application 2019 & 2032
- Table 100: Rest of Middle East and Africa Intelligent Virtual Assistant Market Volume (K Unit) Forecast, by Application 2019 & 2032
- Table 101: Global Intelligent Virtual Assistant Market Revenue Million Forecast, by Product 2019 & 2032
- Table 102: Global Intelligent Virtual Assistant Market Volume K Unit Forecast, by Product 2019 & 2032
- Table 103: Global Intelligent Virtual Assistant Market Revenue Million Forecast, by User Interface 2019 & 2032
- Table 104: Global Intelligent Virtual Assistant Market Volume K Unit Forecast, by User Interface 2019 & 2032
- Table 105: Global Intelligent Virtual Assistant Market Revenue Million Forecast, by End-User 2019 & 2032
- Table 106: Global Intelligent Virtual Assistant Market Volume K Unit Forecast, by End-User 2019 & 2032
- Table 107: Global Intelligent Virtual Assistant Market Revenue Million Forecast, by Country 2019 & 2032
- Table 108: Global Intelligent Virtual Assistant Market Volume K Unit Forecast, by Country 2019 & 2032
- Table 109: United States Intelligent Virtual Assistant Market Revenue (Million) Forecast, by Application 2019 & 2032
- Table 110: United States Intelligent Virtual Assistant Market Volume (K Unit) Forecast, by Application 2019 & 2032
- Table 111: Canada Intelligent Virtual Assistant Market Revenue (Million) Forecast, by Application 2019 & 2032
- Table 112: Canada Intelligent Virtual Assistant Market Volume (K Unit) Forecast, by Application 2019 & 2032
- Table 113: Global Intelligent Virtual Assistant Market Revenue Million Forecast, by Product 2019 & 2032
- Table 114: Global Intelligent Virtual Assistant Market Volume K Unit Forecast, by Product 2019 & 2032
- Table 115: Global Intelligent Virtual Assistant Market Revenue Million Forecast, by User Interface 2019 & 2032
- Table 116: Global Intelligent Virtual Assistant Market Volume K Unit Forecast, by User Interface 2019 & 2032
- Table 117: Global Intelligent Virtual Assistant Market Revenue Million Forecast, by End-User 2019 & 2032
- Table 118: Global Intelligent Virtual Assistant Market Volume K Unit Forecast, by End-User 2019 & 2032
- Table 119: Global Intelligent Virtual Assistant Market Revenue Million Forecast, by Country 2019 & 2032
- Table 120: Global Intelligent Virtual Assistant Market Volume K Unit Forecast, by Country 2019 & 2032
- Table 121: Germany Intelligent Virtual Assistant Market Revenue (Million) Forecast, by Application 2019 & 2032
- Table 122: Germany Intelligent Virtual Assistant Market Volume (K Unit) Forecast, by Application 2019 & 2032
- Table 123: United Kingdom Intelligent Virtual Assistant Market Revenue (Million) Forecast, by Application 2019 & 2032
- Table 124: United Kingdom Intelligent Virtual Assistant Market Volume (K Unit) Forecast, by Application 2019 & 2032
- Table 125: France Intelligent Virtual Assistant Market Revenue (Million) Forecast, by Application 2019 & 2032
- Table 126: France Intelligent Virtual Assistant Market Volume (K Unit) Forecast, by Application 2019 & 2032
- Table 127: Spain Intelligent Virtual Assistant Market Revenue (Million) Forecast, by Application 2019 & 2032
- Table 128: Spain Intelligent Virtual Assistant Market Volume (K Unit) Forecast, by Application 2019 & 2032
- Table 129: Rest of Europe Intelligent Virtual Assistant Market Revenue (Million) Forecast, by Application 2019 & 2032
- Table 130: Rest of Europe Intelligent Virtual Assistant Market Volume (K Unit) Forecast, by Application 2019 & 2032
- Table 131: Global Intelligent Virtual Assistant Market Revenue Million Forecast, by Product 2019 & 2032
- Table 132: Global Intelligent Virtual Assistant Market Volume K Unit Forecast, by Product 2019 & 2032
- Table 133: Global Intelligent Virtual Assistant Market Revenue Million Forecast, by User Interface 2019 & 2032
- Table 134: Global Intelligent Virtual Assistant Market Volume K Unit Forecast, by User Interface 2019 & 2032
- Table 135: Global Intelligent Virtual Assistant Market Revenue Million Forecast, by End-User 2019 & 2032
- Table 136: Global Intelligent Virtual Assistant Market Volume K Unit Forecast, by End-User 2019 & 2032
- Table 137: Global Intelligent Virtual Assistant Market Revenue Million Forecast, by Country 2019 & 2032
- Table 138: Global Intelligent Virtual Assistant Market Volume K Unit Forecast, by Country 2019 & 2032
- Table 139: China Intelligent Virtual Assistant Market Revenue (Million) Forecast, by Application 2019 & 2032
- Table 140: China Intelligent Virtual Assistant Market Volume (K Unit) Forecast, by Application 2019 & 2032
- Table 141: Japan Intelligent Virtual Assistant Market Revenue (Million) Forecast, by Application 2019 & 2032
- Table 142: Japan Intelligent Virtual Assistant Market Volume (K Unit) Forecast, by Application 2019 & 2032
- Table 143: India Intelligent Virtual Assistant Market Revenue (Million) Forecast, by Application 2019 & 2032
- Table 144: India Intelligent Virtual Assistant Market Volume (K Unit) Forecast, by Application 2019 & 2032
- Table 145: Rest of Asia Pacific Intelligent Virtual Assistant Market Revenue (Million) Forecast, by Application 2019 & 2032
- Table 146: Rest of Asia Pacific Intelligent Virtual Assistant Market Volume (K Unit) Forecast, by Application 2019 & 2032
- Table 147: Global Intelligent Virtual Assistant Market Revenue Million Forecast, by Product 2019 & 2032
- Table 148: Global Intelligent Virtual Assistant Market Volume K Unit Forecast, by Product 2019 & 2032
- Table 149: Global Intelligent Virtual Assistant Market Revenue Million Forecast, by User Interface 2019 & 2032
- Table 150: Global Intelligent Virtual Assistant Market Volume K Unit Forecast, by User Interface 2019 & 2032
- Table 151: Global Intelligent Virtual Assistant Market Revenue Million Forecast, by End-User 2019 & 2032
- Table 152: Global Intelligent Virtual Assistant Market Volume K Unit Forecast, by End-User 2019 & 2032
- Table 153: Global Intelligent Virtual Assistant Market Revenue Million Forecast, by Country 2019 & 2032
- Table 154: Global Intelligent Virtual Assistant Market Volume K Unit Forecast, by Country 2019 & 2032
- Table 155: Brazil Intelligent Virtual Assistant Market Revenue (Million) Forecast, by Application 2019 & 2032
- Table 156: Brazil Intelligent Virtual Assistant Market Volume (K Unit) Forecast, by Application 2019 & 2032
- Table 157: Argentina Intelligent Virtual Assistant Market Revenue (Million) Forecast, by Application 2019 & 2032
- Table 158: Argentina Intelligent Virtual Assistant Market Volume (K Unit) Forecast, by Application 2019 & 2032
- Table 159: Rest of Latin America Intelligent Virtual Assistant Market Revenue (Million) Forecast, by Application 2019 & 2032
- Table 160: Rest of Latin America Intelligent Virtual Assistant Market Volume (K Unit) Forecast, by Application 2019 & 2032
- Table 161: Global Intelligent Virtual Assistant Market Revenue Million Forecast, by Product 2019 & 2032
- Table 162: Global Intelligent Virtual Assistant Market Volume K Unit Forecast, by Product 2019 & 2032
- Table 163: Global Intelligent Virtual Assistant Market Revenue Million Forecast, by User Interface 2019 & 2032
- Table 164: Global Intelligent Virtual Assistant Market Volume K Unit Forecast, by User Interface 2019 & 2032
- Table 165: Global Intelligent Virtual Assistant Market Revenue Million Forecast, by End-User 2019 & 2032
- Table 166: Global Intelligent Virtual Assistant Market Volume K Unit Forecast, by End-User 2019 & 2032
- Table 167: Global Intelligent Virtual Assistant Market Revenue Million Forecast, by Country 2019 & 2032
- Table 168: Global Intelligent Virtual Assistant Market Volume K Unit Forecast, by Country 2019 & 2032
- Table 169: UAE Intelligent Virtual Assistant Market Revenue (Million) Forecast, by Application 2019 & 2032
- Table 170: UAE Intelligent Virtual Assistant Market Volume (K Unit) Forecast, by Application 2019 & 2032
- Table 171: Saudi Arabia Intelligent Virtual Assistant Market Revenue (Million) Forecast, by Application 2019 & 2032
- Table 172: Saudi Arabia Intelligent Virtual Assistant Market Volume (K Unit) Forecast, by Application 2019 & 2032
- Table 173: South Africa Intelligent Virtual Assistant Market Revenue (Million) Forecast, by Application 2019 & 2032
- Table 174: South Africa Intelligent Virtual Assistant Market Volume (K Unit) Forecast, by Application 2019 & 2032
- Table 175: Rest of Middle East and Africa Intelligent Virtual Assistant Market Revenue (Million) Forecast, by Application 2019 & 2032
- Table 176: Rest of Middle East and Africa Intelligent Virtual Assistant Market Volume (K Unit) Forecast, by Application 2019 & 2032
Frequently Asked Questions
1. What is the projected Compound Annual Growth Rate (CAGR) of the Intelligent Virtual Assistant Market?
The projected CAGR is approximately 32.72%.
2. Which companies are prominent players in the Intelligent Virtual Assistant Market?
Key companies in the market include Baidu Inc, Creative Virtual Ltd, EdgeVerve Systems Limited (An Infosys Company), Inbenta Technologies Inc, Bose Corporation, Kore ai Inc, Harman-Kardon Inc, IBM Corporation, SMOOCH ai, Google LLC (Alphabet Inc ), Ipsoft Inc, Sonos Inc, Xiaomi Inc, Avaamo Inc, Amazon com Inc, Serviceaide Inc, Alibaba Group, Apple Inc.
3. What are the main segments of the Intelligent Virtual Assistant Market?
The market segments include Product, User Interface, End-User.
4. Can you provide details about the market size?
The market size is estimated to be USD 14.77 Million as of 2022.
5. What are some drivers contributing to market growth?
Increasing Focus to Improve Customer Experience across Professional Services; Smart Speakers to Drive the Market Growth.
6. What are the notable trends driving market growth?
Smart Speakers to Drive the Market Growth.
7. Are there any restraints impacting market growth?
Increasing Preference for Live Person Interaction.
8. Can you provide examples of recent developments in the market?
February 2022: IBM and TD Securities collaborated to create an AI-powered virtual assistant powered by IBM Watson Assistant that can assist consumers with inquiries on the TD Precious Metals digital shop, including frequently asked questions, to help simplify the purchasing experience.
9. What pricing options are available for accessing the report?
Pricing options include single-user, multi-user, and enterprise licenses priced at USD 4750, USD 5250, and USD 8750 respectively.
10. Is the market size provided in terms of value or volume?
The market size is provided in terms of value, measured in Million and volume, measured in K Unit.
11. Are there any specific market keywords associated with the report?
Yes, the market keyword associated with the report is "Intelligent Virtual Assistant Market," which aids in identifying and referencing the specific market segment covered.
12. How do I determine which pricing option suits my needs best?
The pricing options vary based on user requirements and access needs. Individual users may opt for single-user licenses, while businesses requiring broader access may choose multi-user or enterprise licenses for cost-effective access to the report.
13. Are there any additional resources or data provided in the Intelligent Virtual Assistant Market report?
While the report offers comprehensive insights, it's advisable to review the specific contents or supplementary materials provided to ascertain if additional resources or data are available.
14. How can I stay updated on further developments or reports in the Intelligent Virtual Assistant Market?
To stay informed about further developments, trends, and reports in the Intelligent Virtual Assistant Market, consider subscribing to industry newsletters, following relevant companies and organizations, or regularly checking reputable industry news sources and publications.
Methodology
Step 1 - Identification of Relevant Samples Size from Population Database


Step 2 - Approaches for Defining Global Market Size (Value, Volume* & Price*)

Note*: In applicable scenarios
Step 3 - Data Sources
Primary Research
- Web Analytics
- Survey Reports
- Research Institute
- Latest Research Reports
- Opinion Leaders
Secondary Research
- Annual Reports
- White Paper
- Latest Press Release
- Industry Association
- Paid Database
- Investor Presentations

Step 4 - Data Triangulation
Involves using different sources of information in order to increase the validity of a study
These sources are likely to be stakeholders in a program - participants, other researchers, program staff, other community members, and so on.
Then we put all data in single framework & apply various statistical tools to find out the dynamic on the market.
During the analysis stage, feedback from the stakeholder groups would be compared to determine areas of agreement as well as areas of divergence
