

Key Insights
The global medical X-ray equipment and imaging software market is experiencing robust growth, driven by several key factors. Technological advancements, such as the development of advanced imaging techniques like digital radiography and computed tomography (CT) scans offering higher resolution and faster processing times, are significantly boosting market expansion. The increasing prevalence of chronic diseases requiring frequent imaging for diagnosis and monitoring, coupled with a rising geriatric population susceptible to age-related ailments, further fuels market demand. Furthermore, the expanding healthcare infrastructure in developing economies and the increasing adoption of minimally invasive surgical procedures, which often rely on real-time X-ray imaging, contribute to market growth. Government initiatives promoting healthcare infrastructure development and improving access to diagnostic imaging services in underserved regions are also positively impacting market dynamics.
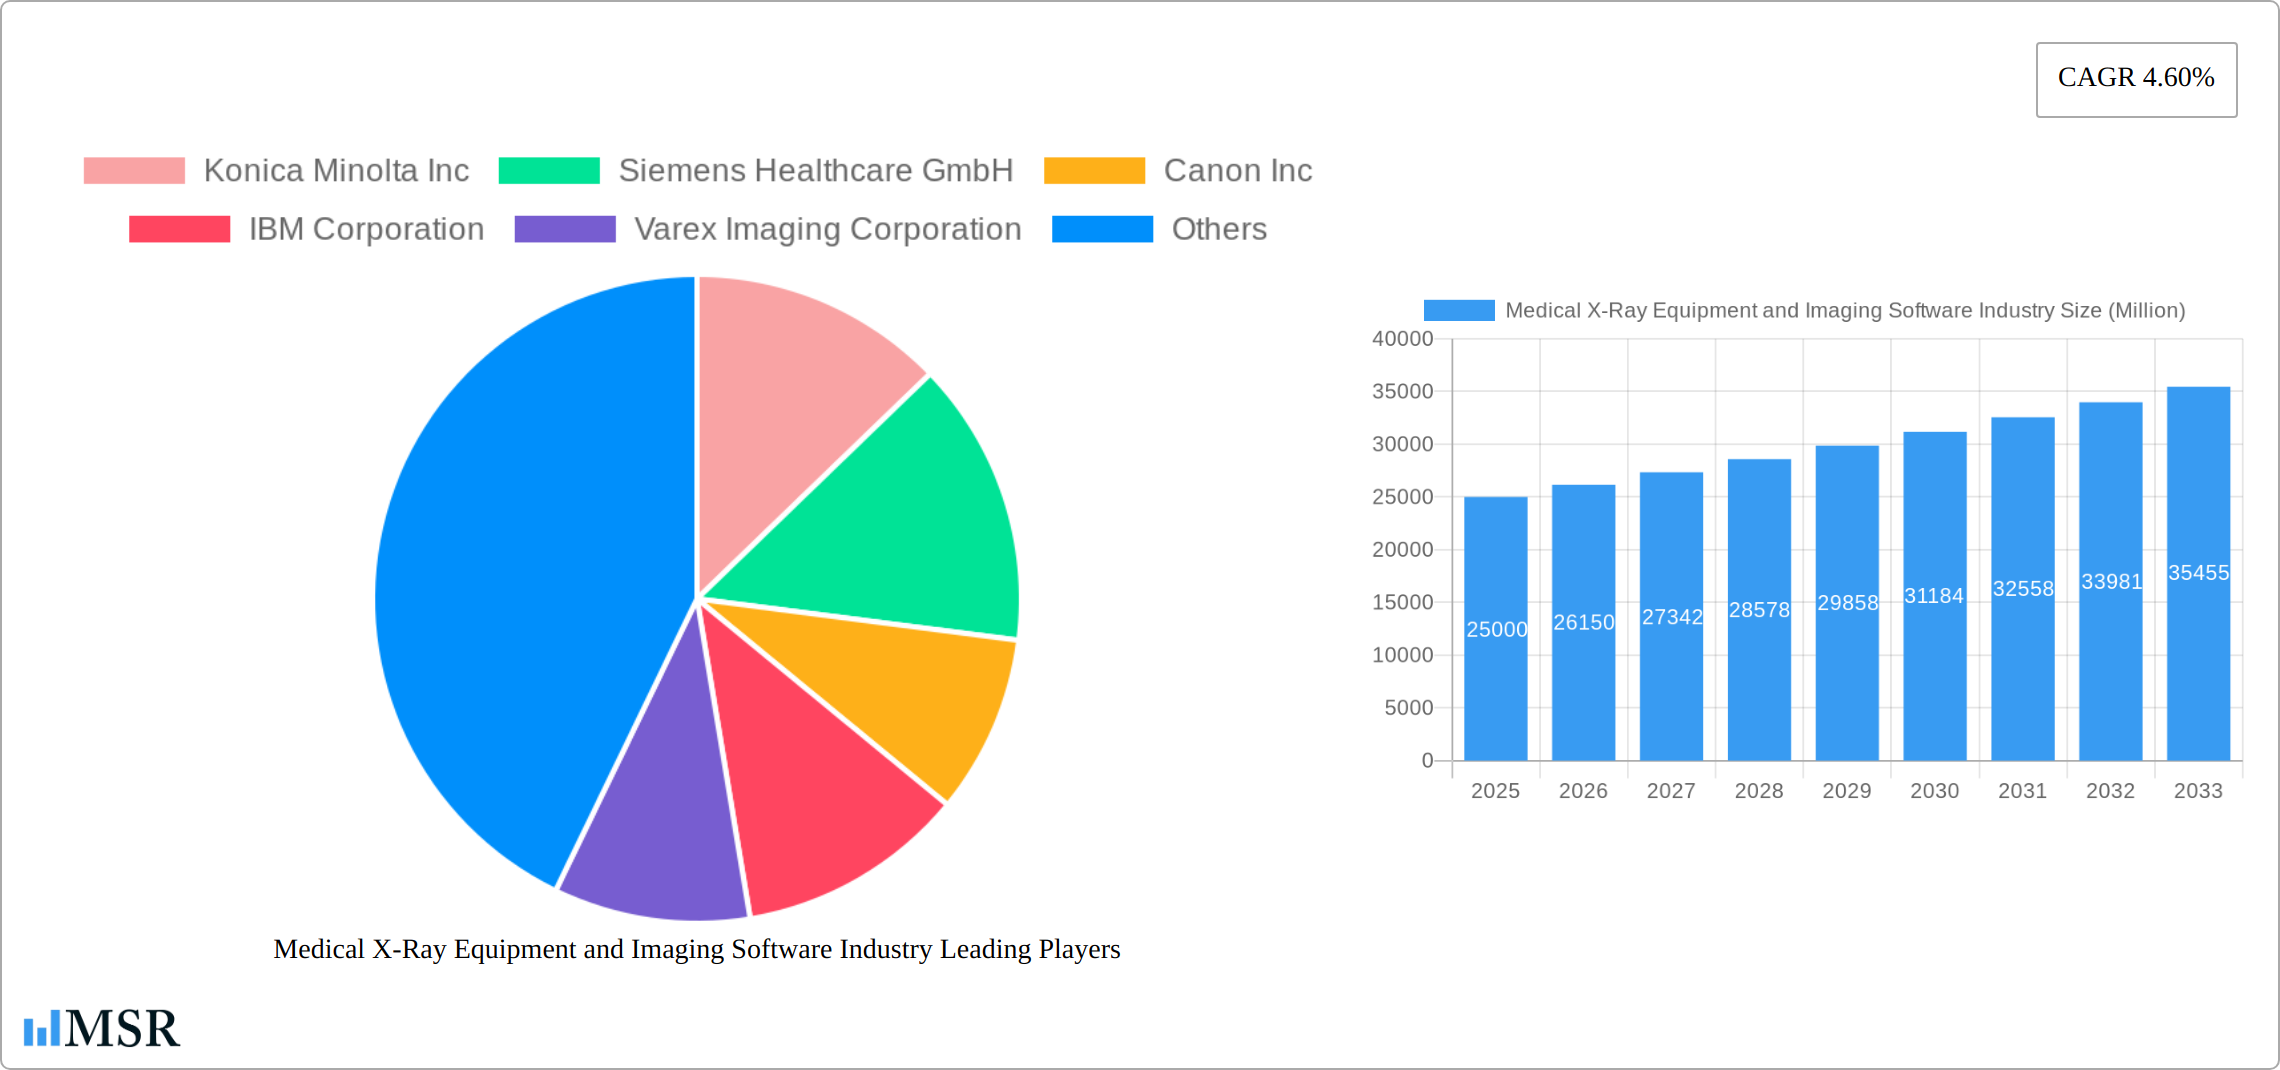
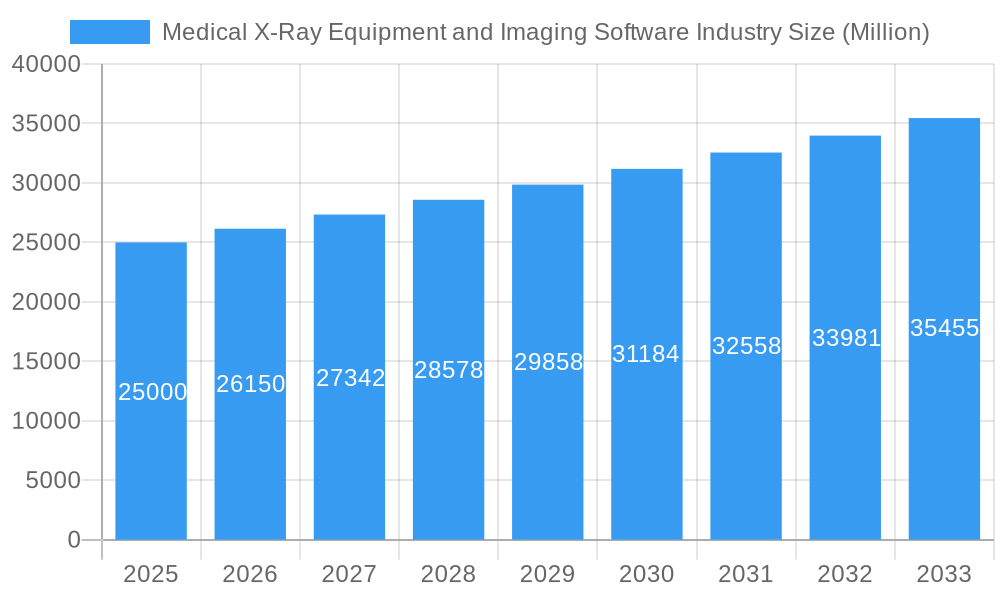
Medical X-Ray Equipment and Imaging Software Industry Market Size (In Billion)
Despite the positive growth trajectory, certain restraints exist. The high cost of advanced X-ray equipment and the need for specialized personnel to operate and interpret images create barriers to entry for smaller healthcare providers. Stringent regulatory approvals and compliance requirements for medical devices also pose challenges for market players. However, these challenges are being addressed through innovative financing models, tele-radiology services which broaden access to specialists, and the development of more user-friendly and cost-effective equipment, ensuring the market’s continued expansion. The market segmentation reveals a significant contribution from hospitals and diagnostic centers, with a growing demand for 3-Dimensional imaging and software solutions enhancing image analysis and workflow efficiency. Leading companies like GE Healthcare, Siemens Healthineers, and Fujifilm are investing heavily in R&D and strategic partnerships to maintain their competitive edge in this rapidly evolving landscape. The North American and European markets currently hold a significant market share, but the Asia-Pacific region is exhibiting considerable growth potential, driven by increasing healthcare spending and expanding healthcare infrastructure.
Medical X-Ray Equipment and Imaging Software Industry Company Market Share
Medical X-Ray Equipment and Imaging Software Industry Market Report: 2019-2033
This comprehensive report provides a detailed analysis of the Medical X-Ray Equipment and Imaging Software industry, offering invaluable insights for stakeholders seeking to navigate this dynamic market. The report covers the period 2019-2033, with a focus on the forecast period 2025-2033 (Base Year: 2025, Estimated Year: 2025). The global market size is projected to reach xx Million by 2033, exhibiting a CAGR of xx% during the forecast period. This report is crucial for understanding market trends, competitive dynamics, and future growth opportunities.
Medical X-Ray Equipment and Imaging Software Industry Market Concentration & Dynamics
The medical X-ray equipment and imaging software market exhibits a moderately concentrated landscape, with a few major players holding significant market share. Key players like GE Healthcare, Siemens Healthineers, and Fujifilm collectively account for approximately xx% of the global market. However, the presence of numerous smaller, specialized companies fosters a competitive environment. Innovation is driven by continuous advancements in imaging technology, including AI-powered image analysis and 3D/4D imaging capabilities. Regulatory frameworks, such as those set by the FDA and other global health agencies, heavily influence product development and market access. Substitute products, while limited, include alternative imaging modalities like ultrasound and MRI, which pose a degree of competitive pressure. End-user trends show a growing preference for integrated solutions offering improved workflow efficiency and cost-effectiveness. M&A activity in the sector has been moderate in recent years, with xx major deals recorded between 2019 and 2024. This activity reflects strategic efforts to expand market reach and enhance technological capabilities.
- Market Share: Top 3 players hold approximately xx%
- M&A Deal Count (2019-2024): xx
- Key Growth Drivers: Technological advancements, increasing prevalence of chronic diseases, rising demand for advanced diagnostics.
- Key Challenges: Stringent regulatory approvals, high capital expenditure for equipment.
Medical X-Ray Equipment and Imaging Software Industry Industry Insights & Trends
The medical X-ray equipment and imaging software market is experiencing robust growth, driven by several key factors. The aging global population and increasing prevalence of chronic diseases, such as cancer and cardiovascular conditions, are creating a surge in demand for diagnostic imaging services. Technological advancements, such as the introduction of AI-powered image analysis tools and improved 3D/4D imaging capabilities, are enhancing diagnostic accuracy and efficiency. The shift towards value-based healthcare is driving the adoption of cost-effective and efficient solutions. The market is witnessing a transition from traditional film-based systems to digital X-ray systems, boosting market growth. The integration of imaging software with hospital information systems (HIS) and electronic health records (EHRs) is streamlining workflows and improving operational efficiency. Moreover, expanding healthcare infrastructure in developing economies is creating new growth avenues. The market size was valued at xx Million in 2024 and is projected to reach xx Million by 2033, with a CAGR of xx%. Consumer behavior reflects a growing preference for advanced, technologically superior systems, and a demand for faster, more accurate diagnostic results.
Key Markets & Segments Leading Medical X-Ray Equipment and Imaging Software Industry
The global medical X-ray equipment and imaging software market is experiencing robust growth, with North America currently leading the charge, closely followed by Europe and the dynamic Asia-Pacific region. This leadership is a direct result of several contributing factors:
- North America: Characterized by substantial healthcare expenditure, a highly developed medical infrastructure, and a keen early adoption rate for cutting-edge technologies, this region sets a high standard for diagnostic imaging.
- Europe: Boasting mature and well-funded healthcare systems, a strong commitment to research and development, and a significant and growing elderly demographic that requires advanced medical care, Europe is a vital market.
- Asia-Pacific: This region is a hotbed of rapid development, with expanding healthcare infrastructure, rising disposable incomes, and an increasing incidence of chronic diseases driving demand for sophisticated diagnostic solutions.
Segment Analysis:
- By Type: The equipment segment currently commands the largest market share, propelled by an unceasing demand for sophisticated diagnostic imaging systems. The software segment, however, is experiencing exponential growth, largely driven by the widespread adoption of AI-powered image analysis tools and the increasing reliance on flexible, scalable cloud-based solutions.
- By Technology: Computed Tomography (CT) systems remain the dominant technology, distinguished by their unparalleled image quality and comprehensive diagnostic capabilities. Radiography/Mammography systems continue to hold a substantial market share due to their established widespread use and critical role in early detection.
- By End-user: Hospitals represent the largest end-user segment, leveraging these technologies for a broad spectrum of patient care. Diagnostic imaging centers follow closely, while the research centers segment is showing promising growth, fueled by intensified research activities in medical imaging and its applications.
Key Growth Drivers:
- Robust Economic Growth: An escalating healthcare expenditure across both developed and emerging economies is a primary catalyst.
- Pioneering Technological Advancements: Innovations such as AI-powered image analysis, advanced 3D/4D imaging capabilities, and enhanced visualization tools are revolutionizing diagnostics.
- Strategic Infrastructure Development: The continuous expansion of healthcare infrastructure, particularly in burgeoning emerging markets, is creating new avenues for market penetration.
- Supportive Regulatory Frameworks: Favorable government policies and initiatives that actively promote healthcare advancements and technological integration are providing a strong tailwind for the industry.
Medical X-Ray Equipment and Imaging Software Industry Product Developments
The landscape of medical X-ray equipment and imaging software is continually shaped by groundbreaking product innovations. Manufacturers are intensely focused on enhancing image quality, streamlining clinical workflows, and prioritizing user-friendliness. Key advancements include the seamless integration of AI for sophisticated image analysis, the automation of image processing tasks, and the robust adoption of cloud-based solutions for secure image storage and efficient sharing. The development of increasingly compact and portable X-ray systems is revolutionizing accessibility, particularly in remote or underserved areas and for point-of-care diagnostics. These technological leaps are not only improving diagnostic accuracy and reducing radiation exposure but also contributing to better patient outcomes, thereby solidifying a competitive advantage for forward-thinking manufacturers.
Challenges in the Medical X-Ray Equipment and Imaging Software Industry Market
Sustaining long-term growth in the medical X-ray equipment and imaging software industry hinges on overcoming several key challenges. While technological innovation remains a primary engine, strategic partnerships between visionary equipment manufacturers and pioneering software developers are crucial for synergistic progress. Expanding into new and often underserved markets requires careful planning and resource allocation. The development of more compact and inherently portable X-ray systems is essential to democratize healthcare access, especially in remote or resource-limited settings. Furthermore, continuous innovation in radiation dose reduction techniques is paramount, not only to enhance patient safety but also to elevate the overall value proposition of these critical diagnostic tools and ensure their ethical and sustainable deployment.
Forces Driving Medical X-Ray Equipment and Imaging Software Industry Growth
The medical X-ray equipment and imaging software industry is propelled forward by a confluence of powerful growth drivers. Foremost among these are continuous technological advancements, particularly in the realm of AI-driven image analysis, which are dramatically elevating diagnostic precision and operational efficiency. The escalating global prevalence of chronic diseases is creating an unyielding demand for advanced diagnostic imaging services. Government-led initiatives focused on bolstering healthcare infrastructure, including substantial investments in state-of-the-art medical equipment, are significantly fueling market expansion. Moreover, a growing societal and healthcare provider emphasis on preventive care and early disease detection is fostering a greater demand for accessible and cost-effective diagnostic tools, further stimulating industry growth.
Challenges in the Medical X-Ray Equipment and Imaging Software Industry Market
Sustaining long-term growth in the medical X-ray equipment and imaging software industry hinges on overcoming several key challenges. While technological innovation remains a primary engine, strategic partnerships between visionary equipment manufacturers and pioneering software developers are crucial for synergistic progress. Expanding into new and often underserved markets requires careful planning and resource allocation. The development of more compact and inherently portable X-ray systems is essential to democratize healthcare access, especially in remote or resource-limited settings. Furthermore, continuous innovation in radiation dose reduction techniques is paramount, not only to enhance patient safety but also to elevate the overall value proposition of these critical diagnostic tools and ensure their ethical and sustainable deployment.
Emerging Opportunities in Medical X-Ray Equipment and Imaging Software Industry
Emerging opportunities lie in the development and adoption of AI-powered image analysis tools and cloud-based imaging platforms. The increasing demand for tele-radiology services offers significant potential for expansion. Integration of X-ray systems with other imaging modalities, such as ultrasound and MRI, creates synergistic opportunities for holistic diagnostic solutions. Finally, exploring new applications of X-ray technology in various medical fields can open new market segments.
Leading Players in the Medical X-Ray Equipment and Imaging Software Industry Sector
- Konica Minolta Inc
- Siemens Healthcare GmbH
- Canon Inc
- IBM Corporation
- Varex Imaging Corporation
- Hitachi Ltd
- Shimazdu Corporation
- Hologic Inc
- Koninklijke Philips NV
- GE Healthcare Inc
- Carestream Health Inc
- Fujifilm Holdings Corporation
Key Milestones in Medical X-Ray Equipment and Imaging Software Industry Industry
- July 2023: Shimadzu Corporation showcased its commitment to advanced mobile imaging with the launch of the MobileDaRt Evolution MX8 version k type mobile X-ray system. This innovative system features Dynamic Digital Radiography (DDR) functionality, enabling high-speed moving image displays from a series of static captures, thereby significantly enhancing diagnostic capabilities for real-time assessment.
- May 2023: Carestream Health addressed market needs for accessible high-performance imaging by introducing the DRX-Rise Mobile X-ray System. This system delivers high-end imaging performance, enhanced ease of use, and improved productivity, all at a competitive price point, making advanced mobile radiography more attainable for a wider range of healthcare facilities.
Strategic Outlook for Medical X-Ray Equipment and Imaging Software Industry Market
The future of the medical X-ray equipment and imaging software market looks bright, driven by continued technological innovation, increasing healthcare expenditure, and a growing global population. Strategic partnerships and collaborations between manufacturers and healthcare providers will play a crucial role in driving market growth. The focus on developing cost-effective and accessible solutions will be crucial in expanding market penetration in developing economies. Companies that successfully integrate AI and cloud technologies into their offerings will be well-positioned to capitalize on future opportunities.
Medical X-Ray Equipment and Imaging Software Industry Segmentation
-
1. Type
- 1.1. Equipment
- 1.2. Software
-
2. Technology
- 2.1. Radiography/Mammography
- 2.2. Computed Tomography
- 2.3. Fluoroscopy/Angiography
-
3. Image Type
- 3.1. 2-Dimensional
- 3.2. 3-Dimensional
-
4. End-user
- 4.1. Hospitals
- 4.2. Diagnostic Centers
- 4.3. Research Centers
Medical X-Ray Equipment and Imaging Software Industry Segmentation By Geography
- 1. North America
- 2. Europe
- 3. Asia
- 4. Australia and New Zealand
- 5. Middle East and Africa
- 6. Latin America
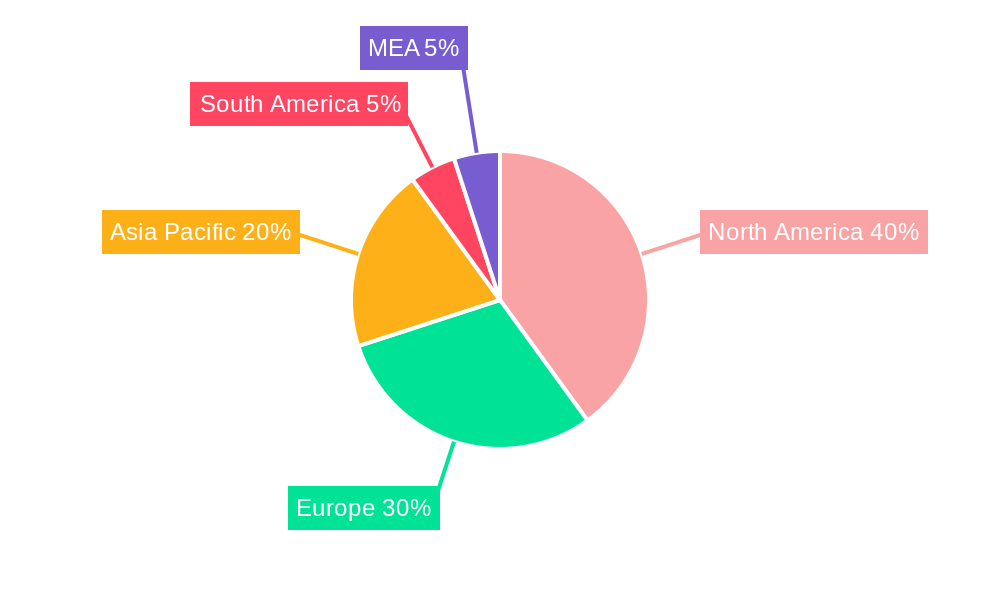
Medical X-Ray Equipment and Imaging Software Industry Regional Market Share
Geographic Coverage of Medical X-Ray Equipment and Imaging Software Industry
Medical X-Ray Equipment and Imaging Software Industry REPORT HIGHLIGHTS
| Aspects | Details |
|---|---|
| Study Period | 2020-2034 |
| Base Year | 2025 |
| Estimated Year | 2026 |
| Forecast Period | 2026-2034 |
| Historical Period | 2020-2025 |
| Growth Rate | CAGR of 4.60% from 2020-2034 |
| Segmentation |
|
Table of Contents
- 1. Introduction
- 1.1. Research Scope
- 1.2. Market Segmentation
- 1.3. Research Objective
- 1.4. Definitions and Assumptions
- 2. Executive Summary
- 2.1. Market Snapshot
- 3. Market Dynamics
- 3.1. Market Drivers
- 3.2. Market Restrains
- 3.3. Market Trends
- 3.4. Market Opportunities
- 4. Market Factor Analysis
- 4.1. Porters Five Forces
- 4.1.1. Bargaining Power of Suppliers
- 4.1.2. Bargaining Power of Buyers
- 4.1.3. Threat of New Entrants
- 4.1.4. Threat of Substitutes
- 4.1.5. Competitive Rivalry
- 4.2. PESTEL analysis
- 4.3. BCG Analysis
- 4.3.1. Stars (High Growth, High Market Share)
- 4.3.2. Cash Cows (Low Growth, High Market Share)
- 4.3.3. Question Mark (High Growth, Low Market Share)
- 4.3.4. Dogs (Low Growth, Low Market Share)
- 4.4. Ansoff Matrix Analysis
- 4.5. Supply Chain Analysis
- 4.6. Regulatory Landscape
- 4.7. Current Market Potential and Opportunity Assessment (TAM–SAM–SOM Framework)
- 4.8. MSR Analyst Note
- 4.1. Porters Five Forces
- 5. Market Analysis, Insights and Forecast 2021-2033
- 5.1. Market Analysis, Insights and Forecast - by Type
- 5.1.1. Equipment
- 5.1.2. Software
- 5.2. Market Analysis, Insights and Forecast - by Technology
- 5.2.1. Radiography/Mammography
- 5.2.2. Computed Tomography
- 5.2.3. Fluoroscopy/Angiography
- 5.3. Market Analysis, Insights and Forecast - by Image Type
- 5.3.1. 2-Dimensional
- 5.3.2. 3-Dimensional
- 5.4. Market Analysis, Insights and Forecast - by End-user
- 5.4.1. Hospitals
- 5.4.2. Diagnostic Centers
- 5.4.3. Research Centers
- 5.5. Market Analysis, Insights and Forecast - by Region
- 5.5.1. North America
- 5.5.2. Europe
- 5.5.3. Asia
- 5.5.4. Australia and New Zealand
- 5.5.5. Middle East and Africa
- 5.5.6. Latin America
- 5.1. Market Analysis, Insights and Forecast - by Type
- 6. Global Medical X-Ray Equipment and Imaging Software Industry Analysis, Insights and Forecast, 2021-2033
- 6.1. Market Analysis, Insights and Forecast - by Type
- 6.1.1. Equipment
- 6.1.2. Software
- 6.2. Market Analysis, Insights and Forecast - by Technology
- 6.2.1. Radiography/Mammography
- 6.2.2. Computed Tomography
- 6.2.3. Fluoroscopy/Angiography
- 6.3. Market Analysis, Insights and Forecast - by Image Type
- 6.3.1. 2-Dimensional
- 6.3.2. 3-Dimensional
- 6.4. Market Analysis, Insights and Forecast - by End-user
- 6.4.1. Hospitals
- 6.4.2. Diagnostic Centers
- 6.4.3. Research Centers
- 6.1. Market Analysis, Insights and Forecast - by Type
- 7. North America Medical X-Ray Equipment and Imaging Software Industry Analysis, Insights and Forecast, 2020-2032
- 7.1. Market Analysis, Insights and Forecast - by Type
- 7.1.1. Equipment
- 7.1.2. Software
- 7.2. Market Analysis, Insights and Forecast - by Technology
- 7.2.1. Radiography/Mammography
- 7.2.2. Computed Tomography
- 7.2.3. Fluoroscopy/Angiography
- 7.3. Market Analysis, Insights and Forecast - by Image Type
- 7.3.1. 2-Dimensional
- 7.3.2. 3-Dimensional
- 7.4. Market Analysis, Insights and Forecast - by End-user
- 7.4.1. Hospitals
- 7.4.2. Diagnostic Centers
- 7.4.3. Research Centers
- 7.1. Market Analysis, Insights and Forecast - by Type
- 8. Europe Medical X-Ray Equipment and Imaging Software Industry Analysis, Insights and Forecast, 2020-2032
- 8.1. Market Analysis, Insights and Forecast - by Type
- 8.1.1. Equipment
- 8.1.2. Software
- 8.2. Market Analysis, Insights and Forecast - by Technology
- 8.2.1. Radiography/Mammography
- 8.2.2. Computed Tomography
- 8.2.3. Fluoroscopy/Angiography
- 8.3. Market Analysis, Insights and Forecast - by Image Type
- 8.3.1. 2-Dimensional
- 8.3.2. 3-Dimensional
- 8.4. Market Analysis, Insights and Forecast - by End-user
- 8.4.1. Hospitals
- 8.4.2. Diagnostic Centers
- 8.4.3. Research Centers
- 8.1. Market Analysis, Insights and Forecast - by Type
- 9. Asia Medical X-Ray Equipment and Imaging Software Industry Analysis, Insights and Forecast, 2020-2032
- 9.1. Market Analysis, Insights and Forecast - by Type
- 9.1.1. Equipment
- 9.1.2. Software
- 9.2. Market Analysis, Insights and Forecast - by Technology
- 9.2.1. Radiography/Mammography
- 9.2.2. Computed Tomography
- 9.2.3. Fluoroscopy/Angiography
- 9.3. Market Analysis, Insights and Forecast - by Image Type
- 9.3.1. 2-Dimensional
- 9.3.2. 3-Dimensional
- 9.4. Market Analysis, Insights and Forecast - by End-user
- 9.4.1. Hospitals
- 9.4.2. Diagnostic Centers
- 9.4.3. Research Centers
- 9.1. Market Analysis, Insights and Forecast - by Type
- 10. Australia and New Zealand Medical X-Ray Equipment and Imaging Software Industry Analysis, Insights and Forecast, 2020-2032
- 10.1. Market Analysis, Insights and Forecast - by Type
- 10.1.1. Equipment
- 10.1.2. Software
- 10.2. Market Analysis, Insights and Forecast - by Technology
- 10.2.1. Radiography/Mammography
- 10.2.2. Computed Tomography
- 10.2.3. Fluoroscopy/Angiography
- 10.3. Market Analysis, Insights and Forecast - by Image Type
- 10.3.1. 2-Dimensional
- 10.3.2. 3-Dimensional
- 10.4. Market Analysis, Insights and Forecast - by End-user
- 10.4.1. Hospitals
- 10.4.2. Diagnostic Centers
- 10.4.3. Research Centers
- 10.1. Market Analysis, Insights and Forecast - by Type
- 11. Middle East and Africa Medical X-Ray Equipment and Imaging Software Industry Analysis, Insights and Forecast, 2020-2032
- 11.1. Market Analysis, Insights and Forecast - by Type
- 11.1.1. Equipment
- 11.1.2. Software
- 11.2. Market Analysis, Insights and Forecast - by Technology
- 11.2.1. Radiography/Mammography
- 11.2.2. Computed Tomography
- 11.2.3. Fluoroscopy/Angiography
- 11.3. Market Analysis, Insights and Forecast - by Image Type
- 11.3.1. 2-Dimensional
- 11.3.2. 3-Dimensional
- 11.4. Market Analysis, Insights and Forecast - by End-user
- 11.4.1. Hospitals
- 11.4.2. Diagnostic Centers
- 11.4.3. Research Centers
- 11.1. Market Analysis, Insights and Forecast - by Type
- 12. Latin America Medical X-Ray Equipment and Imaging Software Industry Analysis, Insights and Forecast, 2020-2032
- 12.1. Market Analysis, Insights and Forecast - by Type
- 12.1.1. Equipment
- 12.1.2. Software
- 12.2. Market Analysis, Insights and Forecast - by Technology
- 12.2.1. Radiography/Mammography
- 12.2.2. Computed Tomography
- 12.2.3. Fluoroscopy/Angiography
- 12.3. Market Analysis, Insights and Forecast - by Image Type
- 12.3.1. 2-Dimensional
- 12.3.2. 3-Dimensional
- 12.4. Market Analysis, Insights and Forecast - by End-user
- 12.4.1. Hospitals
- 12.4.2. Diagnostic Centers
- 12.4.3. Research Centers
- 12.1. Market Analysis, Insights and Forecast - by Type
- 13. Competitive Analysis
- 13.1. Company Profiles
- 13.1.1 Konica Minolta Inc
- 13.1.1.1. Company Overview
- 13.1.1.2. Products
- 13.1.1.3. Company Financials
- 13.1.1.4. SWOT Analysis
- 13.1.2 Siemens Healthcare GmbH
- 13.1.2.1. Company Overview
- 13.1.2.2. Products
- 13.1.2.3. Company Financials
- 13.1.2.4. SWOT Analysis
- 13.1.3 Canon Inc
- 13.1.3.1. Company Overview
- 13.1.3.2. Products
- 13.1.3.3. Company Financials
- 13.1.3.4. SWOT Analysis
- 13.1.4 IBM Corporation
- 13.1.4.1. Company Overview
- 13.1.4.2. Products
- 13.1.4.3. Company Financials
- 13.1.4.4. SWOT Analysis
- 13.1.5 Varex Imaging Corporation
- 13.1.5.1. Company Overview
- 13.1.5.2. Products
- 13.1.5.3. Company Financials
- 13.1.5.4. SWOT Analysis
- 13.1.6 Hitachi Ltd
- 13.1.6.1. Company Overview
- 13.1.6.2. Products
- 13.1.6.3. Company Financials
- 13.1.6.4. SWOT Analysis
- 13.1.7 Shimazdu Corporation
- 13.1.7.1. Company Overview
- 13.1.7.2. Products
- 13.1.7.3. Company Financials
- 13.1.7.4. SWOT Analysis
- 13.1.8 Hologic Inc
- 13.1.8.1. Company Overview
- 13.1.8.2. Products
- 13.1.8.3. Company Financials
- 13.1.8.4. SWOT Analysis
- 13.1.9 Koninklijke Philips NV
- 13.1.9.1. Company Overview
- 13.1.9.2. Products
- 13.1.9.3. Company Financials
- 13.1.9.4. SWOT Analysis
- 13.1.10 GE Healthcare Inc
- 13.1.10.1. Company Overview
- 13.1.10.2. Products
- 13.1.10.3. Company Financials
- 13.1.10.4. SWOT Analysis
- 13.1.11 Carestream Health Inc
- 13.1.11.1. Company Overview
- 13.1.11.2. Products
- 13.1.11.3. Company Financials
- 13.1.11.4. SWOT Analysis
- 13.1.12 Fujifilm Holdings Corporation
- 13.1.12.1. Company Overview
- 13.1.12.2. Products
- 13.1.12.3. Company Financials
- 13.1.12.4. SWOT Analysis
- 13.1.1 Konica Minolta Inc
- 13.2. Market Entropy
- 13.2.1 Company's Key Areas Served
- 13.2.2 Recent Developments
- 13.3. Company Market Share Analysis 2025
- 13.3.1 Top 5 Companies Market Share Analysis
- 13.3.2 Top 3 Companies Market Share Analysis
- 13.4. List of Potential Customers
- 14. Research Methodology
List of Figures
- Figure 1: Global Medical X-Ray Equipment and Imaging Software Industry Revenue Breakdown (Million, %) by Region 2025 & 2033
- Figure 2: Global Medical X-Ray Equipment and Imaging Software Industry Volume Breakdown (K Unit, %) by Region 2025 & 2033
- Figure 3: North America Medical X-Ray Equipment and Imaging Software Industry Revenue (Million), by Type 2025 & 2033
- Figure 4: North America Medical X-Ray Equipment and Imaging Software Industry Volume (K Unit), by Type 2025 & 2033
- Figure 5: North America Medical X-Ray Equipment and Imaging Software Industry Revenue Share (%), by Type 2025 & 2033
- Figure 6: North America Medical X-Ray Equipment and Imaging Software Industry Volume Share (%), by Type 2025 & 2033
- Figure 7: North America Medical X-Ray Equipment and Imaging Software Industry Revenue (Million), by Technology 2025 & 2033
- Figure 8: North America Medical X-Ray Equipment and Imaging Software Industry Volume (K Unit), by Technology 2025 & 2033
- Figure 9: North America Medical X-Ray Equipment and Imaging Software Industry Revenue Share (%), by Technology 2025 & 2033
- Figure 10: North America Medical X-Ray Equipment and Imaging Software Industry Volume Share (%), by Technology 2025 & 2033
- Figure 11: North America Medical X-Ray Equipment and Imaging Software Industry Revenue (Million), by Image Type 2025 & 2033
- Figure 12: North America Medical X-Ray Equipment and Imaging Software Industry Volume (K Unit), by Image Type 2025 & 2033
- Figure 13: North America Medical X-Ray Equipment and Imaging Software Industry Revenue Share (%), by Image Type 2025 & 2033
- Figure 14: North America Medical X-Ray Equipment and Imaging Software Industry Volume Share (%), by Image Type 2025 & 2033
- Figure 15: North America Medical X-Ray Equipment and Imaging Software Industry Revenue (Million), by End-user 2025 & 2033
- Figure 16: North America Medical X-Ray Equipment and Imaging Software Industry Volume (K Unit), by End-user 2025 & 2033
- Figure 17: North America Medical X-Ray Equipment and Imaging Software Industry Revenue Share (%), by End-user 2025 & 2033
- Figure 18: North America Medical X-Ray Equipment and Imaging Software Industry Volume Share (%), by End-user 2025 & 2033
- Figure 19: North America Medical X-Ray Equipment and Imaging Software Industry Revenue (Million), by Country 2025 & 2033
- Figure 20: North America Medical X-Ray Equipment and Imaging Software Industry Volume (K Unit), by Country 2025 & 2033
- Figure 21: North America Medical X-Ray Equipment and Imaging Software Industry Revenue Share (%), by Country 2025 & 2033
- Figure 22: North America Medical X-Ray Equipment and Imaging Software Industry Volume Share (%), by Country 2025 & 2033
- Figure 23: Europe Medical X-Ray Equipment and Imaging Software Industry Revenue (Million), by Type 2025 & 2033
- Figure 24: Europe Medical X-Ray Equipment and Imaging Software Industry Volume (K Unit), by Type 2025 & 2033
- Figure 25: Europe Medical X-Ray Equipment and Imaging Software Industry Revenue Share (%), by Type 2025 & 2033
- Figure 26: Europe Medical X-Ray Equipment and Imaging Software Industry Volume Share (%), by Type 2025 & 2033
- Figure 27: Europe Medical X-Ray Equipment and Imaging Software Industry Revenue (Million), by Technology 2025 & 2033
- Figure 28: Europe Medical X-Ray Equipment and Imaging Software Industry Volume (K Unit), by Technology 2025 & 2033
- Figure 29: Europe Medical X-Ray Equipment and Imaging Software Industry Revenue Share (%), by Technology 2025 & 2033
- Figure 30: Europe Medical X-Ray Equipment and Imaging Software Industry Volume Share (%), by Technology 2025 & 2033
- Figure 31: Europe Medical X-Ray Equipment and Imaging Software Industry Revenue (Million), by Image Type 2025 & 2033
- Figure 32: Europe Medical X-Ray Equipment and Imaging Software Industry Volume (K Unit), by Image Type 2025 & 2033
- Figure 33: Europe Medical X-Ray Equipment and Imaging Software Industry Revenue Share (%), by Image Type 2025 & 2033
- Figure 34: Europe Medical X-Ray Equipment and Imaging Software Industry Volume Share (%), by Image Type 2025 & 2033
- Figure 35: Europe Medical X-Ray Equipment and Imaging Software Industry Revenue (Million), by End-user 2025 & 2033
- Figure 36: Europe Medical X-Ray Equipment and Imaging Software Industry Volume (K Unit), by End-user 2025 & 2033
- Figure 37: Europe Medical X-Ray Equipment and Imaging Software Industry Revenue Share (%), by End-user 2025 & 2033
- Figure 38: Europe Medical X-Ray Equipment and Imaging Software Industry Volume Share (%), by End-user 2025 & 2033
- Figure 39: Europe Medical X-Ray Equipment and Imaging Software Industry Revenue (Million), by Country 2025 & 2033
- Figure 40: Europe Medical X-Ray Equipment and Imaging Software Industry Volume (K Unit), by Country 2025 & 2033
- Figure 41: Europe Medical X-Ray Equipment and Imaging Software Industry Revenue Share (%), by Country 2025 & 2033
- Figure 42: Europe Medical X-Ray Equipment and Imaging Software Industry Volume Share (%), by Country 2025 & 2033
- Figure 43: Asia Medical X-Ray Equipment and Imaging Software Industry Revenue (Million), by Type 2025 & 2033
- Figure 44: Asia Medical X-Ray Equipment and Imaging Software Industry Volume (K Unit), by Type 2025 & 2033
- Figure 45: Asia Medical X-Ray Equipment and Imaging Software Industry Revenue Share (%), by Type 2025 & 2033
- Figure 46: Asia Medical X-Ray Equipment and Imaging Software Industry Volume Share (%), by Type 2025 & 2033
- Figure 47: Asia Medical X-Ray Equipment and Imaging Software Industry Revenue (Million), by Technology 2025 & 2033
- Figure 48: Asia Medical X-Ray Equipment and Imaging Software Industry Volume (K Unit), by Technology 2025 & 2033
- Figure 49: Asia Medical X-Ray Equipment and Imaging Software Industry Revenue Share (%), by Technology 2025 & 2033
- Figure 50: Asia Medical X-Ray Equipment and Imaging Software Industry Volume Share (%), by Technology 2025 & 2033
- Figure 51: Asia Medical X-Ray Equipment and Imaging Software Industry Revenue (Million), by Image Type 2025 & 2033
- Figure 52: Asia Medical X-Ray Equipment and Imaging Software Industry Volume (K Unit), by Image Type 2025 & 2033
- Figure 53: Asia Medical X-Ray Equipment and Imaging Software Industry Revenue Share (%), by Image Type 2025 & 2033
- Figure 54: Asia Medical X-Ray Equipment and Imaging Software Industry Volume Share (%), by Image Type 2025 & 2033
- Figure 55: Asia Medical X-Ray Equipment and Imaging Software Industry Revenue (Million), by End-user 2025 & 2033
- Figure 56: Asia Medical X-Ray Equipment and Imaging Software Industry Volume (K Unit), by End-user 2025 & 2033
- Figure 57: Asia Medical X-Ray Equipment and Imaging Software Industry Revenue Share (%), by End-user 2025 & 2033
- Figure 58: Asia Medical X-Ray Equipment and Imaging Software Industry Volume Share (%), by End-user 2025 & 2033
- Figure 59: Asia Medical X-Ray Equipment and Imaging Software Industry Revenue (Million), by Country 2025 & 2033
- Figure 60: Asia Medical X-Ray Equipment and Imaging Software Industry Volume (K Unit), by Country 2025 & 2033
- Figure 61: Asia Medical X-Ray Equipment and Imaging Software Industry Revenue Share (%), by Country 2025 & 2033
- Figure 62: Asia Medical X-Ray Equipment and Imaging Software Industry Volume Share (%), by Country 2025 & 2033
- Figure 63: Australia and New Zealand Medical X-Ray Equipment and Imaging Software Industry Revenue (Million), by Type 2025 & 2033
- Figure 64: Australia and New Zealand Medical X-Ray Equipment and Imaging Software Industry Volume (K Unit), by Type 2025 & 2033
- Figure 65: Australia and New Zealand Medical X-Ray Equipment and Imaging Software Industry Revenue Share (%), by Type 2025 & 2033
- Figure 66: Australia and New Zealand Medical X-Ray Equipment and Imaging Software Industry Volume Share (%), by Type 2025 & 2033
- Figure 67: Australia and New Zealand Medical X-Ray Equipment and Imaging Software Industry Revenue (Million), by Technology 2025 & 2033
- Figure 68: Australia and New Zealand Medical X-Ray Equipment and Imaging Software Industry Volume (K Unit), by Technology 2025 & 2033
- Figure 69: Australia and New Zealand Medical X-Ray Equipment and Imaging Software Industry Revenue Share (%), by Technology 2025 & 2033
- Figure 70: Australia and New Zealand Medical X-Ray Equipment and Imaging Software Industry Volume Share (%), by Technology 2025 & 2033
- Figure 71: Australia and New Zealand Medical X-Ray Equipment and Imaging Software Industry Revenue (Million), by Image Type 2025 & 2033
- Figure 72: Australia and New Zealand Medical X-Ray Equipment and Imaging Software Industry Volume (K Unit), by Image Type 2025 & 2033
- Figure 73: Australia and New Zealand Medical X-Ray Equipment and Imaging Software Industry Revenue Share (%), by Image Type 2025 & 2033
- Figure 74: Australia and New Zealand Medical X-Ray Equipment and Imaging Software Industry Volume Share (%), by Image Type 2025 & 2033
- Figure 75: Australia and New Zealand Medical X-Ray Equipment and Imaging Software Industry Revenue (Million), by End-user 2025 & 2033
- Figure 76: Australia and New Zealand Medical X-Ray Equipment and Imaging Software Industry Volume (K Unit), by End-user 2025 & 2033
- Figure 77: Australia and New Zealand Medical X-Ray Equipment and Imaging Software Industry Revenue Share (%), by End-user 2025 & 2033
- Figure 78: Australia and New Zealand Medical X-Ray Equipment and Imaging Software Industry Volume Share (%), by End-user 2025 & 2033
- Figure 79: Australia and New Zealand Medical X-Ray Equipment and Imaging Software Industry Revenue (Million), by Country 2025 & 2033
- Figure 80: Australia and New Zealand Medical X-Ray Equipment and Imaging Software Industry Volume (K Unit), by Country 2025 & 2033
- Figure 81: Australia and New Zealand Medical X-Ray Equipment and Imaging Software Industry Revenue Share (%), by Country 2025 & 2033
- Figure 82: Australia and New Zealand Medical X-Ray Equipment and Imaging Software Industry Volume Share (%), by Country 2025 & 2033
- Figure 83: Middle East and Africa Medical X-Ray Equipment and Imaging Software Industry Revenue (Million), by Type 2025 & 2033
- Figure 84: Middle East and Africa Medical X-Ray Equipment and Imaging Software Industry Volume (K Unit), by Type 2025 & 2033
- Figure 85: Middle East and Africa Medical X-Ray Equipment and Imaging Software Industry Revenue Share (%), by Type 2025 & 2033
- Figure 86: Middle East and Africa Medical X-Ray Equipment and Imaging Software Industry Volume Share (%), by Type 2025 & 2033
- Figure 87: Middle East and Africa Medical X-Ray Equipment and Imaging Software Industry Revenue (Million), by Technology 2025 & 2033
- Figure 88: Middle East and Africa Medical X-Ray Equipment and Imaging Software Industry Volume (K Unit), by Technology 2025 & 2033
- Figure 89: Middle East and Africa Medical X-Ray Equipment and Imaging Software Industry Revenue Share (%), by Technology 2025 & 2033
- Figure 90: Middle East and Africa Medical X-Ray Equipment and Imaging Software Industry Volume Share (%), by Technology 2025 & 2033
- Figure 91: Middle East and Africa Medical X-Ray Equipment and Imaging Software Industry Revenue (Million), by Image Type 2025 & 2033
- Figure 92: Middle East and Africa Medical X-Ray Equipment and Imaging Software Industry Volume (K Unit), by Image Type 2025 & 2033
- Figure 93: Middle East and Africa Medical X-Ray Equipment and Imaging Software Industry Revenue Share (%), by Image Type 2025 & 2033
- Figure 94: Middle East and Africa Medical X-Ray Equipment and Imaging Software Industry Volume Share (%), by Image Type 2025 & 2033
- Figure 95: Middle East and Africa Medical X-Ray Equipment and Imaging Software Industry Revenue (Million), by End-user 2025 & 2033
- Figure 96: Middle East and Africa Medical X-Ray Equipment and Imaging Software Industry Volume (K Unit), by End-user 2025 & 2033
- Figure 97: Middle East and Africa Medical X-Ray Equipment and Imaging Software Industry Revenue Share (%), by End-user 2025 & 2033
- Figure 98: Middle East and Africa Medical X-Ray Equipment and Imaging Software Industry Volume Share (%), by End-user 2025 & 2033
- Figure 99: Middle East and Africa Medical X-Ray Equipment and Imaging Software Industry Revenue (Million), by Country 2025 & 2033
- Figure 100: Middle East and Africa Medical X-Ray Equipment and Imaging Software Industry Volume (K Unit), by Country 2025 & 2033
- Figure 101: Middle East and Africa Medical X-Ray Equipment and Imaging Software Industry Revenue Share (%), by Country 2025 & 2033
- Figure 102: Middle East and Africa Medical X-Ray Equipment and Imaging Software Industry Volume Share (%), by Country 2025 & 2033
- Figure 103: Latin America Medical X-Ray Equipment and Imaging Software Industry Revenue (Million), by Type 2025 & 2033
- Figure 104: Latin America Medical X-Ray Equipment and Imaging Software Industry Volume (K Unit), by Type 2025 & 2033
- Figure 105: Latin America Medical X-Ray Equipment and Imaging Software Industry Revenue Share (%), by Type 2025 & 2033
- Figure 106: Latin America Medical X-Ray Equipment and Imaging Software Industry Volume Share (%), by Type 2025 & 2033
- Figure 107: Latin America Medical X-Ray Equipment and Imaging Software Industry Revenue (Million), by Technology 2025 & 2033
- Figure 108: Latin America Medical X-Ray Equipment and Imaging Software Industry Volume (K Unit), by Technology 2025 & 2033
- Figure 109: Latin America Medical X-Ray Equipment and Imaging Software Industry Revenue Share (%), by Technology 2025 & 2033
- Figure 110: Latin America Medical X-Ray Equipment and Imaging Software Industry Volume Share (%), by Technology 2025 & 2033
- Figure 111: Latin America Medical X-Ray Equipment and Imaging Software Industry Revenue (Million), by Image Type 2025 & 2033
- Figure 112: Latin America Medical X-Ray Equipment and Imaging Software Industry Volume (K Unit), by Image Type 2025 & 2033
- Figure 113: Latin America Medical X-Ray Equipment and Imaging Software Industry Revenue Share (%), by Image Type 2025 & 2033
- Figure 114: Latin America Medical X-Ray Equipment and Imaging Software Industry Volume Share (%), by Image Type 2025 & 2033
- Figure 115: Latin America Medical X-Ray Equipment and Imaging Software Industry Revenue (Million), by End-user 2025 & 2033
- Figure 116: Latin America Medical X-Ray Equipment and Imaging Software Industry Volume (K Unit), by End-user 2025 & 2033
- Figure 117: Latin America Medical X-Ray Equipment and Imaging Software Industry Revenue Share (%), by End-user 2025 & 2033
- Figure 118: Latin America Medical X-Ray Equipment and Imaging Software Industry Volume Share (%), by End-user 2025 & 2033
- Figure 119: Latin America Medical X-Ray Equipment and Imaging Software Industry Revenue (Million), by Country 2025 & 2033
- Figure 120: Latin America Medical X-Ray Equipment and Imaging Software Industry Volume (K Unit), by Country 2025 & 2033
- Figure 121: Latin America Medical X-Ray Equipment and Imaging Software Industry Revenue Share (%), by Country 2025 & 2033
- Figure 122: Latin America Medical X-Ray Equipment and Imaging Software Industry Volume Share (%), by Country 2025 & 2033
List of Tables
- Table 1: Global Medical X-Ray Equipment and Imaging Software Industry Revenue Million Forecast, by Type 2020 & 2033
- Table 2: Global Medical X-Ray Equipment and Imaging Software Industry Volume K Unit Forecast, by Type 2020 & 2033
- Table 3: Global Medical X-Ray Equipment and Imaging Software Industry Revenue Million Forecast, by Technology 2020 & 2033
- Table 4: Global Medical X-Ray Equipment and Imaging Software Industry Volume K Unit Forecast, by Technology 2020 & 2033
- Table 5: Global Medical X-Ray Equipment and Imaging Software Industry Revenue Million Forecast, by Image Type 2020 & 2033
- Table 6: Global Medical X-Ray Equipment and Imaging Software Industry Volume K Unit Forecast, by Image Type 2020 & 2033
- Table 7: Global Medical X-Ray Equipment and Imaging Software Industry Revenue Million Forecast, by End-user 2020 & 2033
- Table 8: Global Medical X-Ray Equipment and Imaging Software Industry Volume K Unit Forecast, by End-user 2020 & 2033
- Table 9: Global Medical X-Ray Equipment and Imaging Software Industry Revenue Million Forecast, by Region 2020 & 2033
- Table 10: Global Medical X-Ray Equipment and Imaging Software Industry Volume K Unit Forecast, by Region 2020 & 2033
- Table 11: Global Medical X-Ray Equipment and Imaging Software Industry Revenue Million Forecast, by Type 2020 & 2033
- Table 12: Global Medical X-Ray Equipment and Imaging Software Industry Volume K Unit Forecast, by Type 2020 & 2033
- Table 13: Global Medical X-Ray Equipment and Imaging Software Industry Revenue Million Forecast, by Technology 2020 & 2033
- Table 14: Global Medical X-Ray Equipment and Imaging Software Industry Volume K Unit Forecast, by Technology 2020 & 2033
- Table 15: Global Medical X-Ray Equipment and Imaging Software Industry Revenue Million Forecast, by Image Type 2020 & 2033
- Table 16: Global Medical X-Ray Equipment and Imaging Software Industry Volume K Unit Forecast, by Image Type 2020 & 2033
- Table 17: Global Medical X-Ray Equipment and Imaging Software Industry Revenue Million Forecast, by End-user 2020 & 2033
- Table 18: Global Medical X-Ray Equipment and Imaging Software Industry Volume K Unit Forecast, by End-user 2020 & 2033
- Table 19: Global Medical X-Ray Equipment and Imaging Software Industry Revenue Million Forecast, by Country 2020 & 2033
- Table 20: Global Medical X-Ray Equipment and Imaging Software Industry Volume K Unit Forecast, by Country 2020 & 2033
- Table 21: Global Medical X-Ray Equipment and Imaging Software Industry Revenue Million Forecast, by Type 2020 & 2033
- Table 22: Global Medical X-Ray Equipment and Imaging Software Industry Volume K Unit Forecast, by Type 2020 & 2033
- Table 23: Global Medical X-Ray Equipment and Imaging Software Industry Revenue Million Forecast, by Technology 2020 & 2033
- Table 24: Global Medical X-Ray Equipment and Imaging Software Industry Volume K Unit Forecast, by Technology 2020 & 2033
- Table 25: Global Medical X-Ray Equipment and Imaging Software Industry Revenue Million Forecast, by Image Type 2020 & 2033
- Table 26: Global Medical X-Ray Equipment and Imaging Software Industry Volume K Unit Forecast, by Image Type 2020 & 2033
- Table 27: Global Medical X-Ray Equipment and Imaging Software Industry Revenue Million Forecast, by End-user 2020 & 2033
- Table 28: Global Medical X-Ray Equipment and Imaging Software Industry Volume K Unit Forecast, by End-user 2020 & 2033
- Table 29: Global Medical X-Ray Equipment and Imaging Software Industry Revenue Million Forecast, by Country 2020 & 2033
- Table 30: Global Medical X-Ray Equipment and Imaging Software Industry Volume K Unit Forecast, by Country 2020 & 2033
- Table 31: Global Medical X-Ray Equipment and Imaging Software Industry Revenue Million Forecast, by Type 2020 & 2033
- Table 32: Global Medical X-Ray Equipment and Imaging Software Industry Volume K Unit Forecast, by Type 2020 & 2033
- Table 33: Global Medical X-Ray Equipment and Imaging Software Industry Revenue Million Forecast, by Technology 2020 & 2033
- Table 34: Global Medical X-Ray Equipment and Imaging Software Industry Volume K Unit Forecast, by Technology 2020 & 2033
- Table 35: Global Medical X-Ray Equipment and Imaging Software Industry Revenue Million Forecast, by Image Type 2020 & 2033
- Table 36: Global Medical X-Ray Equipment and Imaging Software Industry Volume K Unit Forecast, by Image Type 2020 & 2033
- Table 37: Global Medical X-Ray Equipment and Imaging Software Industry Revenue Million Forecast, by End-user 2020 & 2033
- Table 38: Global Medical X-Ray Equipment and Imaging Software Industry Volume K Unit Forecast, by End-user 2020 & 2033
- Table 39: Global Medical X-Ray Equipment and Imaging Software Industry Revenue Million Forecast, by Country 2020 & 2033
- Table 40: Global Medical X-Ray Equipment and Imaging Software Industry Volume K Unit Forecast, by Country 2020 & 2033
- Table 41: Global Medical X-Ray Equipment and Imaging Software Industry Revenue Million Forecast, by Type 2020 & 2033
- Table 42: Global Medical X-Ray Equipment and Imaging Software Industry Volume K Unit Forecast, by Type 2020 & 2033
- Table 43: Global Medical X-Ray Equipment and Imaging Software Industry Revenue Million Forecast, by Technology 2020 & 2033
- Table 44: Global Medical X-Ray Equipment and Imaging Software Industry Volume K Unit Forecast, by Technology 2020 & 2033
- Table 45: Global Medical X-Ray Equipment and Imaging Software Industry Revenue Million Forecast, by Image Type 2020 & 2033
- Table 46: Global Medical X-Ray Equipment and Imaging Software Industry Volume K Unit Forecast, by Image Type 2020 & 2033
- Table 47: Global Medical X-Ray Equipment and Imaging Software Industry Revenue Million Forecast, by End-user 2020 & 2033
- Table 48: Global Medical X-Ray Equipment and Imaging Software Industry Volume K Unit Forecast, by End-user 2020 & 2033
- Table 49: Global Medical X-Ray Equipment and Imaging Software Industry Revenue Million Forecast, by Country 2020 & 2033
- Table 50: Global Medical X-Ray Equipment and Imaging Software Industry Volume K Unit Forecast, by Country 2020 & 2033
- Table 51: Global Medical X-Ray Equipment and Imaging Software Industry Revenue Million Forecast, by Type 2020 & 2033
- Table 52: Global Medical X-Ray Equipment and Imaging Software Industry Volume K Unit Forecast, by Type 2020 & 2033
- Table 53: Global Medical X-Ray Equipment and Imaging Software Industry Revenue Million Forecast, by Technology 2020 & 2033
- Table 54: Global Medical X-Ray Equipment and Imaging Software Industry Volume K Unit Forecast, by Technology 2020 & 2033
- Table 55: Global Medical X-Ray Equipment and Imaging Software Industry Revenue Million Forecast, by Image Type 2020 & 2033
- Table 56: Global Medical X-Ray Equipment and Imaging Software Industry Volume K Unit Forecast, by Image Type 2020 & 2033
- Table 57: Global Medical X-Ray Equipment and Imaging Software Industry Revenue Million Forecast, by End-user 2020 & 2033
- Table 58: Global Medical X-Ray Equipment and Imaging Software Industry Volume K Unit Forecast, by End-user 2020 & 2033
- Table 59: Global Medical X-Ray Equipment and Imaging Software Industry Revenue Million Forecast, by Country 2020 & 2033
- Table 60: Global Medical X-Ray Equipment and Imaging Software Industry Volume K Unit Forecast, by Country 2020 & 2033
- Table 61: Global Medical X-Ray Equipment and Imaging Software Industry Revenue Million Forecast, by Type 2020 & 2033
- Table 62: Global Medical X-Ray Equipment and Imaging Software Industry Volume K Unit Forecast, by Type 2020 & 2033
- Table 63: Global Medical X-Ray Equipment and Imaging Software Industry Revenue Million Forecast, by Technology 2020 & 2033
- Table 64: Global Medical X-Ray Equipment and Imaging Software Industry Volume K Unit Forecast, by Technology 2020 & 2033
- Table 65: Global Medical X-Ray Equipment and Imaging Software Industry Revenue Million Forecast, by Image Type 2020 & 2033
- Table 66: Global Medical X-Ray Equipment and Imaging Software Industry Volume K Unit Forecast, by Image Type 2020 & 2033
- Table 67: Global Medical X-Ray Equipment and Imaging Software Industry Revenue Million Forecast, by End-user 2020 & 2033
- Table 68: Global Medical X-Ray Equipment and Imaging Software Industry Volume K Unit Forecast, by End-user 2020 & 2033
- Table 69: Global Medical X-Ray Equipment and Imaging Software Industry Revenue Million Forecast, by Country 2020 & 2033
- Table 70: Global Medical X-Ray Equipment and Imaging Software Industry Volume K Unit Forecast, by Country 2020 & 2033
Frequently Asked Questions
1. What is the projected Compound Annual Growth Rate (CAGR) of the Medical X-Ray Equipment and Imaging Software Industry?
The projected CAGR is approximately 4.60%.
2. Which companies are prominent players in the Medical X-Ray Equipment and Imaging Software Industry?
Key companies in the market include Konica Minolta Inc, Siemens Healthcare GmbH, Canon Inc, IBM Corporation, Varex Imaging Corporation, Hitachi Ltd, Shimazdu Corporation, Hologic Inc , Koninklijke Philips NV, GE Healthcare Inc, Carestream Health Inc, Fujifilm Holdings Corporation.
3. What are the main segments of the Medical X-Ray Equipment and Imaging Software Industry?
The market segments include Type, Technology, Image Type, End-user.
4. Can you provide details about the market size?
The market size is estimated to be USD XX Million as of 2022.
5. What are some drivers contributing to market growth?
Increasing Incidences of Diseases and Growing Geriatric Population; Rising Investments in Healthcare Industry and Favorable Government Initiatives.
6. What are the notable trends driving market growth?
Diagnostic Centers Majorly Drive the Market Demand.
7. Are there any restraints impacting market growth?
Stringent Regulations and Validator Guidelines; Security Issues Associated with the Software.
8. Can you provide examples of recent developments in the market?
July 2023 - Shimadzu Corporation announced the release of a new mobile X-ray system known as MobileDaRt Evolution MX8 version k type, which is equipped with serial radiography functionality known as Dynamic Digital Radiography (DDR). It displays a series of static images captured at high speed as a moving image.
9. What pricing options are available for accessing the report?
Pricing options include single-user, multi-user, and enterprise licenses priced at USD 4750, USD 5250, and USD 8750 respectively.
10. Is the market size provided in terms of value or volume?
The market size is provided in terms of value, measured in Million and volume, measured in K Unit.
11. Are there any specific market keywords associated with the report?
Yes, the market keyword associated with the report is "Medical X-Ray Equipment and Imaging Software Industry," which aids in identifying and referencing the specific market segment covered.
12. How do I determine which pricing option suits my needs best?
The pricing options vary based on user requirements and access needs. Individual users may opt for single-user licenses, while businesses requiring broader access may choose multi-user or enterprise licenses for cost-effective access to the report.
13. Are there any additional resources or data provided in the Medical X-Ray Equipment and Imaging Software Industry report?
While the report offers comprehensive insights, it's advisable to review the specific contents or supplementary materials provided to ascertain if additional resources or data are available.
14. How can I stay updated on further developments or reports in the Medical X-Ray Equipment and Imaging Software Industry?
To stay informed about further developments, trends, and reports in the Medical X-Ray Equipment and Imaging Software Industry, consider subscribing to industry newsletters, following relevant companies and organizations, or regularly checking reputable industry news sources and publications.
Methodology
Step 1 - Identification of Relevant Samples Size from Population Database


Step 2 - Approaches for Defining Global Market Size (Value, Volume* & Price*)

Note*: In applicable scenarios
Step 3 - Data Sources
Primary Research
- Web Analytics
- Survey Reports
- Research Institute
- Latest Research Reports
- Opinion Leaders
Secondary Research
- Annual Reports
- White Paper
- Latest Press Release
- Industry Association
- Paid Database
- Investor Presentations

Step 4 - Data Triangulation
Involves using different sources of information in order to increase the validity of a study
These sources are likely to be stakeholders in a program - participants, other researchers, program staff, other community members, and so on.
Then we put all data in single framework & apply various statistical tools to find out the dynamic on the market.
During the analysis stage, feedback from the stakeholder groups would be compared to determine areas of agreement as well as areas of divergence