

Key Insights
The Netherlands payments industry is projected to achieve a Compound Annual Growth Rate (CAGR) of 5.09%. This dynamic market is fueled by accelerated digitalization and expanding e-commerce adoption. With a projected market size of 1.47 billion for the base year 2025, key growth drivers include the increasing prevalence of mobile payment solutions, robust online shopping penetration, and supportive government initiatives for digital financial services. The industry is segmented by payment modes (Point of Sale and online sales) and end-user industries (Retail, Entertainment, Healthcare, Hospitality, and others), with online retail and POS transactions dominating market share. Major international and domestic players, including Visa, Mastercard, PayPal, Adyen, ABN AMRO, and De Volksbank, are actively competing through innovation and strategic alliances. The Netherlands' strong financial infrastructure and high internet penetration are significant enablers of this sector's growth.
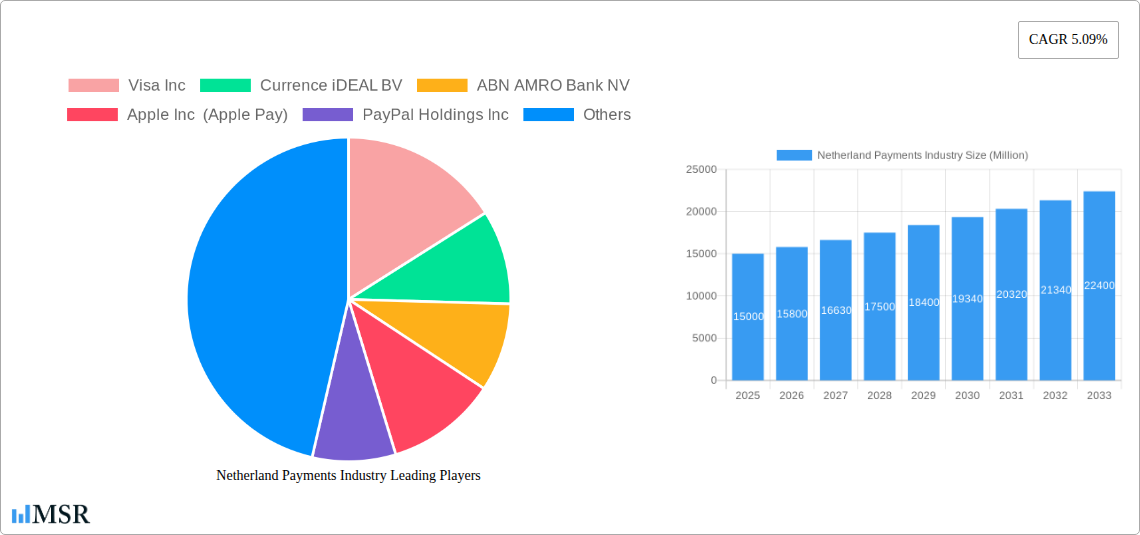
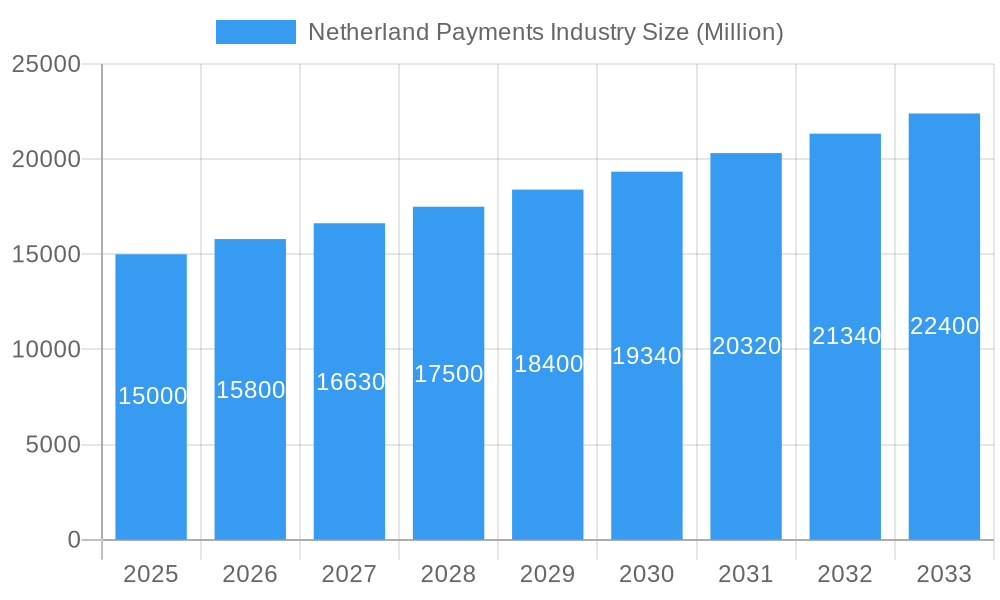
Netherland Payments Industry Market Size (In Billion)
The competitive landscape features a blend of established global payment providers and prominent Dutch banks, all vying for market dominance via technological advancements and strategic collaborations. Evolving consumer preferences and regulatory shifts are further influencing the industry's trajectory. While potential challenges such as cybersecurity threats and stringent data privacy regulations persist, the overall market outlook is highly positive, driven by continuous technological progress and a growing demand for secure, seamless payment experiences. This presents substantial opportunities for fintech innovators and established enterprises to capitalize on the thriving Dutch payments market. Future expansion will be contingent on maintaining consumer confidence, navigating the evolving regulatory framework, and consistently delivering secure, convenient payment methods aligned with changing customer expectations.
Netherland Payments Industry Company Market Share
Netherlands Payments Industry: 2019-2033 Market Report
This comprehensive report provides an in-depth analysis of the Netherlands payments industry, offering invaluable insights for stakeholders across the value chain. From market concentration and technological advancements to emerging opportunities and key players, this report paints a vivid picture of the industry's past, present, and future, covering the period from 2019 to 2033. The report uses 2025 as the base and estimated year, with a forecast period spanning 2025-2033 and a historical period covering 2019-2024. Key segments analyzed include Point of Sale, Online Sale, Retail, Entertainment, Healthcare, Hospitality, and other key sectors. Leading companies like Visa Inc, Currence iDEAL BV, ABN AMRO Bank NV, Apple Inc (Apple Pay), PayPal Holdings Inc, Google LLC (Google Pay), American Express Company, Mastercard Inc, De Volksbank, and Adyen are extensively profiled. The report is meticulously researched and presents actionable data-driven insights. The total market size in 2025 is estimated at xx Million.
Netherland Payments Industry Market Concentration & Dynamics
The Netherlands payments industry exhibits a moderately concentrated market structure, with a few dominant players alongside a thriving ecosystem of smaller fintech companies. iDEAL, a domestic payment system, holds a significant market share, particularly in online transactions. However, the increasing penetration of international players like Visa and Mastercard is fostering competition. The industry is characterized by a robust regulatory framework, aiming to balance innovation with consumer protection. The presence of substitute products, such as cash and other digital wallets, influences market dynamics. End-user trends favor digital payments, particularly mobile payments and contactless transactions, driven by increasing smartphone adoption and changing consumer preferences. The industry has witnessed significant M&A activity in recent years.
- Market Share: iDEAL: xx%; Visa: xx%; Mastercard: xx%; Others: xx%.
- M&A Deal Count (2019-2024): xx deals
Netherland Payments Industry Industry Insights & Trends
The Netherlands payments market is experiencing robust growth, driven by several factors. The increasing adoption of e-commerce and the shift towards digital payments contribute significantly to market expansion. Technological advancements like mobile wallets, contactless payments, and open banking solutions are reshaping the landscape, creating new opportunities and disrupting traditional payment methods. Consumer behavior is increasingly favoring convenience and security, pushing demand for faster, more secure payment options. The market is expected to maintain a healthy Compound Annual Growth Rate (CAGR) of xx% during the forecast period (2025-2033), reaching an estimated value of xx Million by 2033. The total market size in 2025 is estimated at xx Million.
Key Markets & Segments Leading Netherland Payments Industry
The online sales segment demonstrates the strongest growth within the Netherlands payments market, fueled by the booming e-commerce sector. The retail end-user industry remains the largest segment, accounting for a substantial portion of total transaction volume.
Drivers for Online Sales Growth:
- Rapid growth of e-commerce.
- Increased smartphone penetration.
- Improved internet infrastructure.
Drivers for Retail Segment Dominance:
- Large and established retail sector.
- High consumer spending.
- Wide acceptance of various payment methods.
Dominance Analysis: The online sales segment’s dominance is attributed to the rapid expansion of e-commerce in the Netherlands. This trend is reinforced by strong consumer adoption of online shopping and a robust digital infrastructure. While the retail sector retains a substantial market share due to its scale and established presence, the online segment is expected to continue outpacing retail growth in the coming years.
Netherland Payments Industry Product Developments
Recent product innovations include the rise of mobile wallets (Apple Pay, Google Pay), the expansion of open banking solutions, and the integration of biometric authentication features for enhanced security. These advancements are improving the user experience, enhancing security, and providing businesses with greater efficiency in processing payments. The competitive edge lies in offering faster, more secure, and user-friendly payment solutions that cater to evolving consumer preferences.
Challenges in the Netherland Payments Industry Market
The Netherlands payments industry faces challenges such as maintaining robust cybersecurity measures to protect against fraud and data breaches. The increasing complexity of regulatory compliance adds operational costs. Intense competition from both established players and emerging fintechs presents a significant hurdle for market participants. These challenges have resulted in an estimated xx Million loss in revenue for the industry in 2024.
Forces Driving Netherland Payments Industry Growth
Technological advancements, including mobile payments and open banking, are major growth catalysts. Favorable economic conditions and supportive government policies promoting digitalization contribute to expansion. The increasing adoption of online shopping and the growing preference for cashless transactions further propel market growth.
Long-Term Growth Catalysts in the Netherland Payments Industry
Long-term growth will be driven by continuous innovation in payment technologies, strategic partnerships between established players and fintechs, and expansion into new markets. The increasing adoption of innovative payment solutions such as buy now, pay later (BNPL) services will also contribute significantly to growth.
Emerging Opportunities in Netherland Payments Industry
Emerging opportunities include the expanding use of embedded finance, the growing importance of data analytics for personalized payment experiences, and the potential of blockchain technology to enhance security and transparency. Further opportunities exist in serving underserved segments and expanding into cross-border payments.
Leading Players in the Netherland Payments Industry Sector
- Visa Inc
- Currence iDEAL BV
- ABN AMRO Bank NV
- Apple Inc (Apple Pay)
- PayPal Holdings Inc
- Google LLC (Google Pay)
- American Express Company
- Mastercard Inc
- De Volksbank
- Adyen
Key Milestones in Netherland Payments Industry Industry
- May 2022: Klarna launches Virtual Shopping, enhancing online retail experience.
- May 2022: DECTA partners with Zimpler to enable A2A payments across Europe, including the Netherlands.
- May 2022: BigCommerce names Mollie as a Preferred Technology Partner, boosting Mollie's presence in the Netherlands.
- March 2022: Visa acquires Tink, strengthening its open banking capabilities.
Strategic Outlook for Netherland Payments Industry Market
The Netherlands payments industry is poised for continued growth, fueled by technological innovation, evolving consumer preferences, and supportive regulatory environments. Strategic opportunities exist for players to leverage emerging technologies, expand into new market segments, and forge strategic alliances to enhance their market position and capture a greater share of the expanding market. The market's future trajectory indicates significant potential for both established players and emerging fintechs to thrive in the coming decade.
Netherland Payments Industry Segmentation
-
1. Mode of Payment
-
1.1. Point of Sale
- 1.1.1. Card Pay
- 1.1.2. Digital Wallet (includes Mobile Wallets)
- 1.1.3. Cash
- 1.1.4. Other Points of Sale
-
1.2. Online Sale
- 1.2.1. Other
-
1.1. Point of Sale
-
2. End-user Industry
- 2.1. Retail
- 2.2. Entertainment
- 2.3. Healthcare
- 2.4. Hospitality
- 2.5. Other End-user Industries
Netherland Payments Industry Segmentation By Geography
-
1. North America
- 1.1. United States
- 1.2. Canada
- 1.3. Mexico
-
2. South America
- 2.1. Brazil
- 2.2. Argentina
- 2.3. Rest of South America
-
3. Europe
- 3.1. United Kingdom
- 3.2. Germany
- 3.3. France
- 3.4. Italy
- 3.5. Spain
- 3.6. Russia
- 3.7. Benelux
- 3.8. Nordics
- 3.9. Rest of Europe
-
4. Middle East & Africa
- 4.1. Turkey
- 4.2. Israel
- 4.3. GCC
- 4.4. North Africa
- 4.5. South Africa
- 4.6. Rest of Middle East & Africa
-
5. Asia Pacific
- 5.1. China
- 5.2. India
- 5.3. Japan
- 5.4. South Korea
- 5.5. ASEAN
- 5.6. Oceania
- 5.7. Rest of Asia Pacific
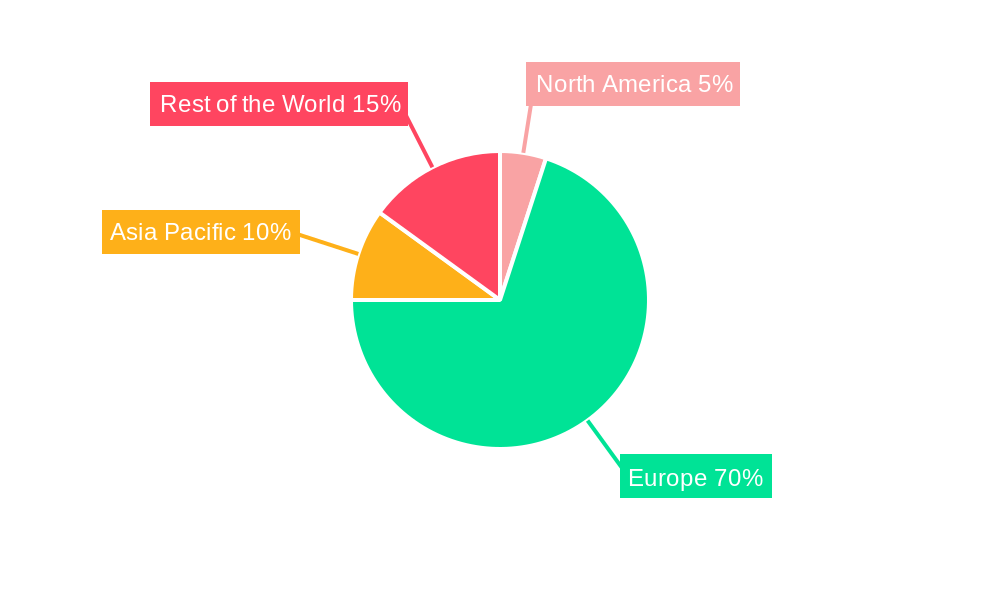
Netherland Payments Industry Regional Market Share
Geographic Coverage of Netherland Payments Industry
Netherland Payments Industry REPORT HIGHLIGHTS
| Aspects | Details |
|---|---|
| Study Period | 2020-2034 |
| Base Year | 2025 |
| Estimated Year | 2026 |
| Forecast Period | 2026-2034 |
| Historical Period | 2020-2025 |
| Growth Rate | CAGR of 5.09% from 2020-2034 |
| Segmentation |
|
Table of Contents
- 1. Introduction
- 1.1. Research Scope
- 1.2. Market Segmentation
- 1.3. Research Objective
- 1.4. Definitions and Assumptions
- 2. Executive Summary
- 2.1. Market Snapshot
- 3. Market Dynamics
- 3.1. Market Drivers
- 3.2. Market Restrains
- 3.3. Market Trends
- 3.4. Market Opportunities
- 4. Market Factor Analysis
- 4.1. Porters Five Forces
- 4.1.1. Bargaining Power of Suppliers
- 4.1.2. Bargaining Power of Buyers
- 4.1.3. Threat of New Entrants
- 4.1.4. Threat of Substitutes
- 4.1.5. Competitive Rivalry
- 4.2. PESTEL analysis
- 4.3. BCG Analysis
- 4.3.1. Stars (High Growth, High Market Share)
- 4.3.2. Cash Cows (Low Growth, High Market Share)
- 4.3.3. Question Mark (High Growth, Low Market Share)
- 4.3.4. Dogs (Low Growth, Low Market Share)
- 4.4. Ansoff Matrix Analysis
- 4.5. Supply Chain Analysis
- 4.6. Regulatory Landscape
- 4.7. Current Market Potential and Opportunity Assessment (TAM–SAM–SOM Framework)
- 4.8. MSR Analyst Note
- 4.1. Porters Five Forces
- 5. Market Analysis, Insights and Forecast 2021-2033
- 5.1. Market Analysis, Insights and Forecast - by Mode of Payment
- 5.1.1. Point of Sale
- 5.1.1.1. Card Pay
- 5.1.1.2. Digital Wallet (includes Mobile Wallets)
- 5.1.1.3. Cash
- 5.1.1.4. Other Points of Sale
- 5.1.2. Online Sale
- 5.1.2.1. Other
- 5.1.1. Point of Sale
- 5.2. Market Analysis, Insights and Forecast - by End-user Industry
- 5.2.1. Retail
- 5.2.2. Entertainment
- 5.2.3. Healthcare
- 5.2.4. Hospitality
- 5.2.5. Other End-user Industries
- 5.3. Market Analysis, Insights and Forecast - by Region
- 5.3.1. North America
- 5.3.2. South America
- 5.3.3. Europe
- 5.3.4. Middle East & Africa
- 5.3.5. Asia Pacific
- 5.1. Market Analysis, Insights and Forecast - by Mode of Payment
- 6. Global Netherland Payments Industry Analysis, Insights and Forecast, 2021-2033
- 6.1. Market Analysis, Insights and Forecast - by Mode of Payment
- 6.1.1. Point of Sale
- 6.1.1.1. Card Pay
- 6.1.1.2. Digital Wallet (includes Mobile Wallets)
- 6.1.1.3. Cash
- 6.1.1.4. Other Points of Sale
- 6.1.2. Online Sale
- 6.1.2.1. Other
- 6.1.1. Point of Sale
- 6.2. Market Analysis, Insights and Forecast - by End-user Industry
- 6.2.1. Retail
- 6.2.2. Entertainment
- 6.2.3. Healthcare
- 6.2.4. Hospitality
- 6.2.5. Other End-user Industries
- 6.1. Market Analysis, Insights and Forecast - by Mode of Payment
- 7. North America Netherland Payments Industry Analysis, Insights and Forecast, 2020-2032
- 7.1. Market Analysis, Insights and Forecast - by Mode of Payment
- 7.1.1. Point of Sale
- 7.1.1.1. Card Pay
- 7.1.1.2. Digital Wallet (includes Mobile Wallets)
- 7.1.1.3. Cash
- 7.1.1.4. Other Points of Sale
- 7.1.2. Online Sale
- 7.1.2.1. Other
- 7.1.1. Point of Sale
- 7.2. Market Analysis, Insights and Forecast - by End-user Industry
- 7.2.1. Retail
- 7.2.2. Entertainment
- 7.2.3. Healthcare
- 7.2.4. Hospitality
- 7.2.5. Other End-user Industries
- 7.1. Market Analysis, Insights and Forecast - by Mode of Payment
- 8. South America Netherland Payments Industry Analysis, Insights and Forecast, 2020-2032
- 8.1. Market Analysis, Insights and Forecast - by Mode of Payment
- 8.1.1. Point of Sale
- 8.1.1.1. Card Pay
- 8.1.1.2. Digital Wallet (includes Mobile Wallets)
- 8.1.1.3. Cash
- 8.1.1.4. Other Points of Sale
- 8.1.2. Online Sale
- 8.1.2.1. Other
- 8.1.1. Point of Sale
- 8.2. Market Analysis, Insights and Forecast - by End-user Industry
- 8.2.1. Retail
- 8.2.2. Entertainment
- 8.2.3. Healthcare
- 8.2.4. Hospitality
- 8.2.5. Other End-user Industries
- 8.1. Market Analysis, Insights and Forecast - by Mode of Payment
- 9. Europe Netherland Payments Industry Analysis, Insights and Forecast, 2020-2032
- 9.1. Market Analysis, Insights and Forecast - by Mode of Payment
- 9.1.1. Point of Sale
- 9.1.1.1. Card Pay
- 9.1.1.2. Digital Wallet (includes Mobile Wallets)
- 9.1.1.3. Cash
- 9.1.1.4. Other Points of Sale
- 9.1.2. Online Sale
- 9.1.2.1. Other
- 9.1.1. Point of Sale
- 9.2. Market Analysis, Insights and Forecast - by End-user Industry
- 9.2.1. Retail
- 9.2.2. Entertainment
- 9.2.3. Healthcare
- 9.2.4. Hospitality
- 9.2.5. Other End-user Industries
- 9.1. Market Analysis, Insights and Forecast - by Mode of Payment
- 10. Middle East & Africa Netherland Payments Industry Analysis, Insights and Forecast, 2020-2032
- 10.1. Market Analysis, Insights and Forecast - by Mode of Payment
- 10.1.1. Point of Sale
- 10.1.1.1. Card Pay
- 10.1.1.2. Digital Wallet (includes Mobile Wallets)
- 10.1.1.3. Cash
- 10.1.1.4. Other Points of Sale
- 10.1.2. Online Sale
- 10.1.2.1. Other
- 10.1.1. Point of Sale
- 10.2. Market Analysis, Insights and Forecast - by End-user Industry
- 10.2.1. Retail
- 10.2.2. Entertainment
- 10.2.3. Healthcare
- 10.2.4. Hospitality
- 10.2.5. Other End-user Industries
- 10.1. Market Analysis, Insights and Forecast - by Mode of Payment
- 11. Asia Pacific Netherland Payments Industry Analysis, Insights and Forecast, 2020-2032
- 11.1. Market Analysis, Insights and Forecast - by Mode of Payment
- 11.1.1. Point of Sale
- 11.1.1.1. Card Pay
- 11.1.1.2. Digital Wallet (includes Mobile Wallets)
- 11.1.1.3. Cash
- 11.1.1.4. Other Points of Sale
- 11.1.2. Online Sale
- 11.1.2.1. Other
- 11.1.1. Point of Sale
- 11.2. Market Analysis, Insights and Forecast - by End-user Industry
- 11.2.1. Retail
- 11.2.2. Entertainment
- 11.2.3. Healthcare
- 11.2.4. Hospitality
- 11.2.5. Other End-user Industries
- 11.1. Market Analysis, Insights and Forecast - by Mode of Payment
- 12. Competitive Analysis
- 12.1. Company Profiles
- 12.1.1 Visa Inc
- 12.1.1.1. Company Overview
- 12.1.1.2. Products
- 12.1.1.3. Company Financials
- 12.1.1.4. SWOT Analysis
- 12.1.2 Currence iDEAL BV
- 12.1.2.1. Company Overview
- 12.1.2.2. Products
- 12.1.2.3. Company Financials
- 12.1.2.4. SWOT Analysis
- 12.1.3 ABN AMRO Bank NV
- 12.1.3.1. Company Overview
- 12.1.3.2. Products
- 12.1.3.3. Company Financials
- 12.1.3.4. SWOT Analysis
- 12.1.4 Apple Inc (Apple Pay)
- 12.1.4.1. Company Overview
- 12.1.4.2. Products
- 12.1.4.3. Company Financials
- 12.1.4.4. SWOT Analysis
- 12.1.5 PayPal Holdings Inc
- 12.1.5.1. Company Overview
- 12.1.5.2. Products
- 12.1.5.3. Company Financials
- 12.1.5.4. SWOT Analysis
- 12.1.6 Google LLC (Google Pay)
- 12.1.6.1. Company Overview
- 12.1.6.2. Products
- 12.1.6.3. Company Financials
- 12.1.6.4. SWOT Analysis
- 12.1.7 American Express Company
- 12.1.7.1. Company Overview
- 12.1.7.2. Products
- 12.1.7.3. Company Financials
- 12.1.7.4. SWOT Analysis
- 12.1.8 Mastercard Inc
- 12.1.8.1. Company Overview
- 12.1.8.2. Products
- 12.1.8.3. Company Financials
- 12.1.8.4. SWOT Analysis
- 12.1.9 De Volksbank
- 12.1.9.1. Company Overview
- 12.1.9.2. Products
- 12.1.9.3. Company Financials
- 12.1.9.4. SWOT Analysis
- 12.1.10 Adyen
- 12.1.10.1. Company Overview
- 12.1.10.2. Products
- 12.1.10.3. Company Financials
- 12.1.10.4. SWOT Analysis
- 12.1.1 Visa Inc
- 12.2. Market Entropy
- 12.2.1 Company's Key Areas Served
- 12.2.2 Recent Developments
- 12.3. Company Market Share Analysis 2025
- 12.3.1 Top 5 Companies Market Share Analysis
- 12.3.2 Top 3 Companies Market Share Analysis
- 12.4. List of Potential Customers
- 13. Research Methodology
List of Figures
- Figure 1: Global Netherland Payments Industry Revenue Breakdown (billion, %) by Region 2025 & 2033
- Figure 2: North America Netherland Payments Industry Revenue (billion), by Mode of Payment 2025 & 2033
- Figure 3: North America Netherland Payments Industry Revenue Share (%), by Mode of Payment 2025 & 2033
- Figure 4: North America Netherland Payments Industry Revenue (billion), by End-user Industry 2025 & 2033
- Figure 5: North America Netherland Payments Industry Revenue Share (%), by End-user Industry 2025 & 2033
- Figure 6: North America Netherland Payments Industry Revenue (billion), by Country 2025 & 2033
- Figure 7: North America Netherland Payments Industry Revenue Share (%), by Country 2025 & 2033
- Figure 8: South America Netherland Payments Industry Revenue (billion), by Mode of Payment 2025 & 2033
- Figure 9: South America Netherland Payments Industry Revenue Share (%), by Mode of Payment 2025 & 2033
- Figure 10: South America Netherland Payments Industry Revenue (billion), by End-user Industry 2025 & 2033
- Figure 11: South America Netherland Payments Industry Revenue Share (%), by End-user Industry 2025 & 2033
- Figure 12: South America Netherland Payments Industry Revenue (billion), by Country 2025 & 2033
- Figure 13: South America Netherland Payments Industry Revenue Share (%), by Country 2025 & 2033
- Figure 14: Europe Netherland Payments Industry Revenue (billion), by Mode of Payment 2025 & 2033
- Figure 15: Europe Netherland Payments Industry Revenue Share (%), by Mode of Payment 2025 & 2033
- Figure 16: Europe Netherland Payments Industry Revenue (billion), by End-user Industry 2025 & 2033
- Figure 17: Europe Netherland Payments Industry Revenue Share (%), by End-user Industry 2025 & 2033
- Figure 18: Europe Netherland Payments Industry Revenue (billion), by Country 2025 & 2033
- Figure 19: Europe Netherland Payments Industry Revenue Share (%), by Country 2025 & 2033
- Figure 20: Middle East & Africa Netherland Payments Industry Revenue (billion), by Mode of Payment 2025 & 2033
- Figure 21: Middle East & Africa Netherland Payments Industry Revenue Share (%), by Mode of Payment 2025 & 2033
- Figure 22: Middle East & Africa Netherland Payments Industry Revenue (billion), by End-user Industry 2025 & 2033
- Figure 23: Middle East & Africa Netherland Payments Industry Revenue Share (%), by End-user Industry 2025 & 2033
- Figure 24: Middle East & Africa Netherland Payments Industry Revenue (billion), by Country 2025 & 2033
- Figure 25: Middle East & Africa Netherland Payments Industry Revenue Share (%), by Country 2025 & 2033
- Figure 26: Asia Pacific Netherland Payments Industry Revenue (billion), by Mode of Payment 2025 & 2033
- Figure 27: Asia Pacific Netherland Payments Industry Revenue Share (%), by Mode of Payment 2025 & 2033
- Figure 28: Asia Pacific Netherland Payments Industry Revenue (billion), by End-user Industry 2025 & 2033
- Figure 29: Asia Pacific Netherland Payments Industry Revenue Share (%), by End-user Industry 2025 & 2033
- Figure 30: Asia Pacific Netherland Payments Industry Revenue (billion), by Country 2025 & 2033
- Figure 31: Asia Pacific Netherland Payments Industry Revenue Share (%), by Country 2025 & 2033
List of Tables
- Table 1: Global Netherland Payments Industry Revenue billion Forecast, by Mode of Payment 2020 & 2033
- Table 2: Global Netherland Payments Industry Revenue billion Forecast, by End-user Industry 2020 & 2033
- Table 3: Global Netherland Payments Industry Revenue billion Forecast, by Region 2020 & 2033
- Table 4: Global Netherland Payments Industry Revenue billion Forecast, by Mode of Payment 2020 & 2033
- Table 5: Global Netherland Payments Industry Revenue billion Forecast, by End-user Industry 2020 & 2033
- Table 6: Global Netherland Payments Industry Revenue billion Forecast, by Country 2020 & 2033
- Table 7: United States Netherland Payments Industry Revenue (billion) Forecast, by Application 2020 & 2033
- Table 8: Canada Netherland Payments Industry Revenue (billion) Forecast, by Application 2020 & 2033
- Table 9: Mexico Netherland Payments Industry Revenue (billion) Forecast, by Application 2020 & 2033
- Table 10: Global Netherland Payments Industry Revenue billion Forecast, by Mode of Payment 2020 & 2033
- Table 11: Global Netherland Payments Industry Revenue billion Forecast, by End-user Industry 2020 & 2033
- Table 12: Global Netherland Payments Industry Revenue billion Forecast, by Country 2020 & 2033
- Table 13: Brazil Netherland Payments Industry Revenue (billion) Forecast, by Application 2020 & 2033
- Table 14: Argentina Netherland Payments Industry Revenue (billion) Forecast, by Application 2020 & 2033
- Table 15: Rest of South America Netherland Payments Industry Revenue (billion) Forecast, by Application 2020 & 2033
- Table 16: Global Netherland Payments Industry Revenue billion Forecast, by Mode of Payment 2020 & 2033
- Table 17: Global Netherland Payments Industry Revenue billion Forecast, by End-user Industry 2020 & 2033
- Table 18: Global Netherland Payments Industry Revenue billion Forecast, by Country 2020 & 2033
- Table 19: United Kingdom Netherland Payments Industry Revenue (billion) Forecast, by Application 2020 & 2033
- Table 20: Germany Netherland Payments Industry Revenue (billion) Forecast, by Application 2020 & 2033
- Table 21: France Netherland Payments Industry Revenue (billion) Forecast, by Application 2020 & 2033
- Table 22: Italy Netherland Payments Industry Revenue (billion) Forecast, by Application 2020 & 2033
- Table 23: Spain Netherland Payments Industry Revenue (billion) Forecast, by Application 2020 & 2033
- Table 24: Russia Netherland Payments Industry Revenue (billion) Forecast, by Application 2020 & 2033
- Table 25: Benelux Netherland Payments Industry Revenue (billion) Forecast, by Application 2020 & 2033
- Table 26: Nordics Netherland Payments Industry Revenue (billion) Forecast, by Application 2020 & 2033
- Table 27: Rest of Europe Netherland Payments Industry Revenue (billion) Forecast, by Application 2020 & 2033
- Table 28: Global Netherland Payments Industry Revenue billion Forecast, by Mode of Payment 2020 & 2033
- Table 29: Global Netherland Payments Industry Revenue billion Forecast, by End-user Industry 2020 & 2033
- Table 30: Global Netherland Payments Industry Revenue billion Forecast, by Country 2020 & 2033
- Table 31: Turkey Netherland Payments Industry Revenue (billion) Forecast, by Application 2020 & 2033
- Table 32: Israel Netherland Payments Industry Revenue (billion) Forecast, by Application 2020 & 2033
- Table 33: GCC Netherland Payments Industry Revenue (billion) Forecast, by Application 2020 & 2033
- Table 34: North Africa Netherland Payments Industry Revenue (billion) Forecast, by Application 2020 & 2033
- Table 35: South Africa Netherland Payments Industry Revenue (billion) Forecast, by Application 2020 & 2033
- Table 36: Rest of Middle East & Africa Netherland Payments Industry Revenue (billion) Forecast, by Application 2020 & 2033
- Table 37: Global Netherland Payments Industry Revenue billion Forecast, by Mode of Payment 2020 & 2033
- Table 38: Global Netherland Payments Industry Revenue billion Forecast, by End-user Industry 2020 & 2033
- Table 39: Global Netherland Payments Industry Revenue billion Forecast, by Country 2020 & 2033
- Table 40: China Netherland Payments Industry Revenue (billion) Forecast, by Application 2020 & 2033
- Table 41: India Netherland Payments Industry Revenue (billion) Forecast, by Application 2020 & 2033
- Table 42: Japan Netherland Payments Industry Revenue (billion) Forecast, by Application 2020 & 2033
- Table 43: South Korea Netherland Payments Industry Revenue (billion) Forecast, by Application 2020 & 2033
- Table 44: ASEAN Netherland Payments Industry Revenue (billion) Forecast, by Application 2020 & 2033
- Table 45: Oceania Netherland Payments Industry Revenue (billion) Forecast, by Application 2020 & 2033
- Table 46: Rest of Asia Pacific Netherland Payments Industry Revenue (billion) Forecast, by Application 2020 & 2033
Frequently Asked Questions
1. What is the projected Compound Annual Growth Rate (CAGR) of the Netherland Payments Industry?
The projected CAGR is approximately 5.09%.
2. Which companies are prominent players in the Netherland Payments Industry?
Key companies in the market include Visa Inc, Currence iDEAL BV, ABN AMRO Bank NV, Apple Inc (Apple Pay), PayPal Holdings Inc, Google LLC (Google Pay), American Express Company, Mastercard Inc, De Volksbank, Adyen.
3. What are the main segments of the Netherland Payments Industry?
The market segments include Mode of Payment, End-user Industry.
4. Can you provide details about the market size?
The market size is estimated to be USD 1.47 billion as of 2022.
5. What are some drivers contributing to market growth?
Adoption of digital payments; Increasing need to eliminate physical money transactions in order to reduce money-related fraud; Increased use of Smartphones with High-Speed Network Connectivity and Different Digital Payment Platforms.
6. What are the notable trends driving market growth?
Rising users of Digital Payments in Online Sale.
7. Are there any restraints impacting market growth?
High Initial Setup Costs.
8. Can you provide examples of recent developments in the market?
May 2022: Klarna, a leading global retail bank, payments provider, and shopping service provider, announced the launch of its Virtual Shopping offering, which brings the best of in-store shopping to the online experience. Klarna's Virtual Shopping lets customers browse and buy online with confidence by connecting them directly with in-store experts via live chats and video calls to receive product advice and inspiration.
9. What pricing options are available for accessing the report?
Pricing options include single-user, multi-user, and enterprise licenses priced at USD 3800, USD 4500, and USD 5800 respectively.
10. Is the market size provided in terms of value or volume?
The market size is provided in terms of value, measured in billion.
11. Are there any specific market keywords associated with the report?
Yes, the market keyword associated with the report is "Netherland Payments Industry," which aids in identifying and referencing the specific market segment covered.
12. How do I determine which pricing option suits my needs best?
The pricing options vary based on user requirements and access needs. Individual users may opt for single-user licenses, while businesses requiring broader access may choose multi-user or enterprise licenses for cost-effective access to the report.
13. Are there any additional resources or data provided in the Netherland Payments Industry report?
While the report offers comprehensive insights, it's advisable to review the specific contents or supplementary materials provided to ascertain if additional resources or data are available.
14. How can I stay updated on further developments or reports in the Netherland Payments Industry?
To stay informed about further developments, trends, and reports in the Netherland Payments Industry, consider subscribing to industry newsletters, following relevant companies and organizations, or regularly checking reputable industry news sources and publications.
Methodology
Step 1 - Identification of Relevant Samples Size from Population Database


Step 2 - Approaches for Defining Global Market Size (Value, Volume* & Price*)

Note*: In applicable scenarios
Step 3 - Data Sources
Primary Research
- Web Analytics
- Survey Reports
- Research Institute
- Latest Research Reports
- Opinion Leaders
Secondary Research
- Annual Reports
- White Paper
- Latest Press Release
- Industry Association
- Paid Database
- Investor Presentations

Step 4 - Data Triangulation
Involves using different sources of information in order to increase the validity of a study
These sources are likely to be stakeholders in a program - participants, other researchers, program staff, other community members, and so on.
Then we put all data in single framework & apply various statistical tools to find out the dynamic on the market.
During the analysis stage, feedback from the stakeholder groups would be compared to determine areas of agreement as well as areas of divergence