

Key Insights
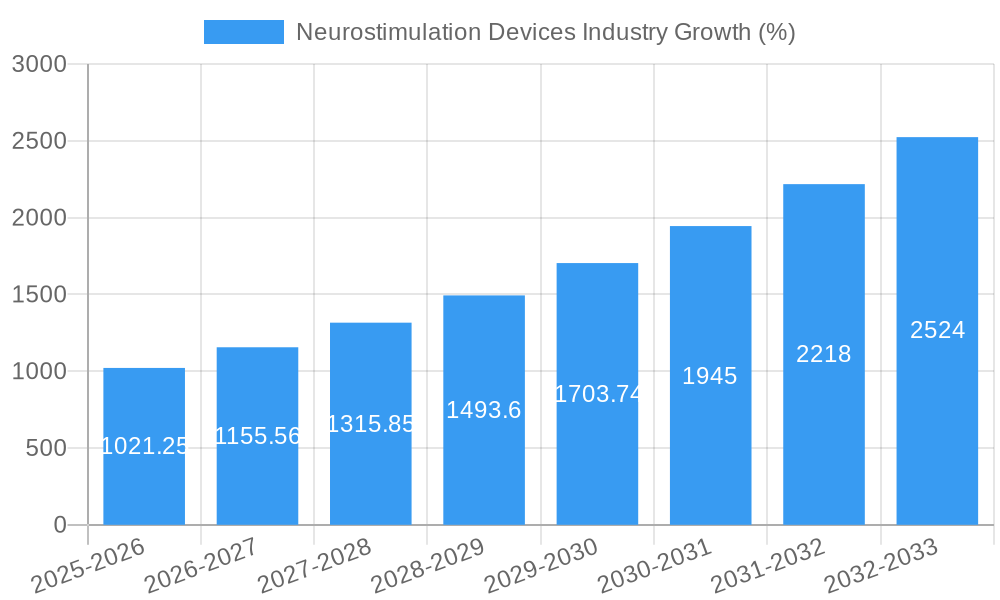
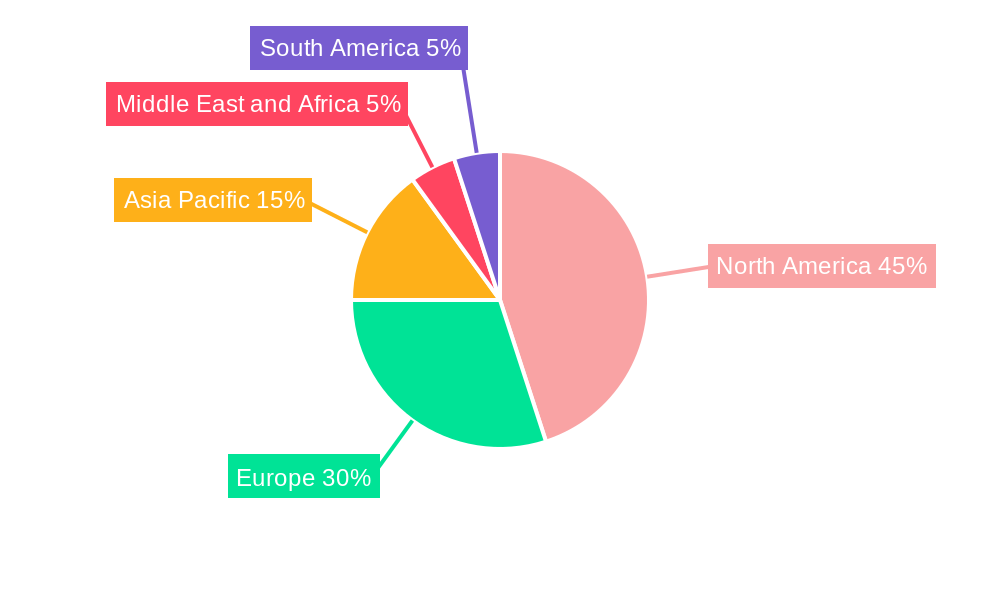
The neurostimulation devices market, valued at $8.21 billion in 2025, is projected to experience robust growth, driven by a compound annual growth rate (CAGR) of 12.50% from 2025 to 2033. This expansion is fueled by several key factors. Increasing prevalence of neurological disorders like Parkinson's disease, epilepsy, and chronic pain is a significant driver. Technological advancements leading to more sophisticated and minimally invasive devices, along with improved efficacy and safety profiles, are further boosting market adoption. Furthermore, a growing elderly population globally, predisposed to these conditions, contributes significantly to the market's expansion. The market is segmented by device type (implantable and external), application (Parkinson's disease, epilepsy, depression, dystonia, pain management, and others), and end-users (clinics, hospitals, and rehabilitation centers). The implantable devices segment currently holds a larger market share due to their efficacy in treating chronic conditions, but external devices are gaining traction due to their lower invasiveness and cost-effectiveness. North America and Europe are currently the dominant regions, but the Asia-Pacific region is expected to witness significant growth due to rising healthcare expenditure and increasing awareness of neurostimulation therapies. However, high costs associated with these devices and potential side effects pose challenges to market growth.
Competition within the neurostimulation devices market is intense, with key players such as Medtronic, Boston Scientific, Abbott, and Neuronetics continuously striving for innovation and market share. Strategic partnerships, acquisitions, and the development of novel therapies are key competitive strategies. The market is also witnessing a rise in minimally invasive procedures and personalized medicine approaches, enhancing patient outcomes and overall market growth. Future growth hinges on continued research and development, particularly in areas like closed-loop neurostimulation systems and improved targeting techniques to minimize side effects. Regulatory approvals and reimbursement policies also play a crucial role in shaping market dynamics. The projected growth trajectory suggests a promising future for this vital sector in healthcare, offering hope for improved quality of life for millions affected by neurological disorders.

Neurostimulation Devices Industry Report: 2019-2033
This comprehensive report provides an in-depth analysis of the Neurostimulation Devices market, projecting a robust growth trajectory fueled by technological advancements and rising prevalence of neurological disorders. The study period covers 2019-2033, with 2025 as the base and estimated year. This report is crucial for investors, manufacturers (including Neuronetics, Medtronic, NeuroPace Inc, Nevro Corp, Synapse Biomedical Inc, LivaNova PLC, Abbott, Curonix LLC, Boston Scientific Corporation, and Aleva Neurotherapeutics), and healthcare professionals seeking to understand the market dynamics and future opportunities within this rapidly evolving sector. The market is segmented by device type (implantable and external), application (Parkinson's Disease, Epilepsy, Depression, Dystonia, Pain Management, and other applications), and end-users (Clinics, Hospitals, and Rehabilitation Centers). The report forecasts a market value reaching xx Million by 2033.
Neurostimulation Devices Industry Market Concentration & Dynamics
The neurostimulation devices market exhibits moderate concentration, with a few key players holding significant market share. Medtronic and Boston Scientific Corporation, for example, command substantial portions of the market. However, the presence of several smaller, innovative companies fosters a dynamic competitive landscape. Innovation is crucial, driven by advancements in device technology, improved targeting capabilities, and minimally invasive surgical techniques. The regulatory framework, particularly FDA approvals in the US and equivalent bodies globally, significantly influences market access and product lifecycle. Substitute products, such as pharmaceutical treatments, pose a competitive threat, although neurostimulation offers advantages in specific applications. End-user trends reflect a growing preference for less invasive procedures and improved patient outcomes.
Market share distribution amongst the top players is estimated to be as follows (2025): Medtronic (25%), Boston Scientific (18%), Abbott (15%), Nevro Corp (10%), others (32%). The number of M&A deals within the industry averaged approximately xx per year during the historical period (2019-2024), indicating significant consolidation activity.
Neurostimulation Devices Industry Industry Insights & Trends
The global neurostimulation devices market is experiencing substantial growth, driven by a confluence of factors. The aging population, leading to increased prevalence of neurological disorders, is a primary driver. Technological advancements, including improved device design, miniaturization, and wireless capabilities, are enhancing efficacy and patient comfort. Furthermore, rising healthcare expenditure and increased awareness of neurostimulation therapies are boosting market expansion. The market size was estimated at xx Million in 2025 and is projected to reach xx Million by 2033, exhibiting a CAGR of xx%. Consumer behaviors are shifting towards a preference for personalized medicine and minimally invasive procedures, fueling demand for advanced neurostimulation technologies. The market is also witnessing an increasing adoption of rechargeable devices over traditional battery-powered devices. Technological disruptions, particularly in areas like closed-loop systems and AI-driven personalization, are expected to further reshape the market landscape.
Key Markets & Segments Leading Neurostimulation Devices Industry
The North American market currently dominates the global neurostimulation devices industry, driven by high healthcare expenditure, advanced healthcare infrastructure, and a large patient population. Within the application segments, Pain Management currently holds the largest market share, followed by Epilepsy and Parkinson's Disease. Implantable devices constitute the larger portion of the market compared to external devices, reflecting a preference for long-term therapeutic benefits. Hospitals and specialized clinics are the major end-users, due to their infrastructure and expertise.
- Dominant Region: North America
- Dominant Application: Pain Management
- Dominant Device Type: Implantable Devices
- Dominant End-User: Hospitals
Drivers for growth in key regions and segments:
- North America: High healthcare spending, advanced medical infrastructure, and prevalence of neurological disorders.
- Pain Management: Growing prevalence of chronic pain conditions, limited effectiveness of alternative treatments.
- Implantable Devices: Longer duration of therapy, improved efficacy compared to external devices.
- Hospitals: Well-equipped facilities, experienced medical staff.
Neurostimulation Devices Industry Product Developments
Recent years have witnessed significant innovations in neurostimulation devices, including the development of more targeted and personalized therapies. Advancements in materials science have resulted in smaller, more biocompatible devices. Closed-loop systems, utilizing real-time feedback to adjust stimulation parameters, are gaining traction. This, coupled with advancements in diagnostic imaging techniques and sophisticated algorithms for stimulation parameter optimization, offers improved patient outcomes and increased safety. Competitive advantage is gained through superior device design, improved clinical outcomes, and strong intellectual property portfolios.
Challenges in the Neurostimulation Devices Industry Market
The neurostimulation devices market faces several challenges. Stringent regulatory pathways for approval can lead to extended timelines and increased costs. Supply chain disruptions, particularly related to specialized components, can affect production and availability. Furthermore, intense competition amongst established and emerging players necessitates continuous innovation and efficient cost management. The reimbursement landscape and pricing pressures in various healthcare systems represent a significant financial constraint.
Forces Driving Neurostimulation Devices Industry Growth
The neurostimulation devices industry benefits from several key growth drivers. Technological advancements, such as closed-loop systems and personalized therapies, are significantly improving efficacy and safety. Favorable reimbursement policies in many countries are increasing market access. The rising prevalence of neurological disorders amongst the aging population is creating a consistently expanding patient base. Further, ongoing research and development efforts constantly introduce innovative solutions, expanding the range of treatable conditions.
Long-Term Growth Catalysts in Neurostimulation Devices Industry
Long-term growth will be fueled by continuous innovation in device design, leading to smaller, more comfortable, and more targeted stimulation. Strategic partnerships between device manufacturers and pharmaceutical companies will facilitate combined therapeutic approaches. Expansion into emerging markets, particularly in Asia and Latin America, presents significant opportunities.
Emerging Opportunities in Neurostimulation Devices Industry
Emerging opportunities lie in the development of novel stimulation targets and the application of neurostimulation to new therapeutic areas. The integration of artificial intelligence and machine learning algorithms is poised to further enhance personalization and treatment efficacy. Wireless and minimally invasive approaches will increase adoption rates by lowering the risk and discomfort of surgery. The growing demand for home-based therapies offers potential for new device designs and service models.
Leading Players in the Neurostimulation Devices Industry Sector
- Neuronetics
- Medtronic
- NeuroPace Inc
- Nevro Corp
- Synapse Biomedical Inc
- LivaNova PLC
- Abbott
- Curonix LLC
- Boston Scientific Corporation
- Aleva Neurotherapeutics
Key Milestones in Neurostimulation Devices Industry Industry
- May 2023: Abbott received FDA approval for its spinal cord stimulation (SCS) systems for treating chronic non-surgical back pain. This significantly expands the addressable market for Abbott's SCS products.
- January 2023: Axonics, Inc. received FDA approval for its fourth-generation rechargeable sacral neuromodulation system, improving treatment options for patients.
Strategic Outlook for Neurostimulation Devices Industry Market
The future of the neurostimulation devices market appears bright. Continued technological innovation, expanding indications, and growing market penetration in emerging economies will fuel significant growth. Strategic acquisitions, partnerships, and a focus on personalized therapies will shape the competitive landscape. Companies with robust R&D pipelines and a strong focus on patient outcomes are well-positioned to capitalize on the market's long-term potential.
Neurostimulation Devices Industry Segmentation
-
1. Device Type
-
1.1. Implantable Devices
- 1.1.1. Spinal Cord Stimulators
- 1.1.2. Deep Brain Stimulators
- 1.1.3. Sacral Nerve Stimulators
- 1.1.4. Vagus Nerve Stimulators
- 1.1.5. Gastric Electric Stimulators
- 1.1.6. Other Device Types
-
1.2. External Devices
- 1.2.1. Transcranial Magnetic Stimulation (TMS)
- 1.2.2. Transcutaneous Electrical Nerve Stimulation (TENS)
- 1.2.3. Other External Devices
-
1.1. Implantable Devices
-
2. Application
- 2.1. Parkinson's Disease
- 2.2. Epilepsy
- 2.3. Depression
- 2.4. Dystonia
- 2.5. Pain Management
- 2.6. Other Applications
-
3. End-Users
- 3.1. Clinics
- 3.2. Hospitals
- 3.3. Rehabilitation Centers
Neurostimulation Devices Industry Segmentation By Geography
-
1. North America
- 1.1. United States
- 1.2. Canada
- 1.3. Mexico
-
2. Europe
- 2.1. Germany
- 2.2. United Kingdom
- 2.3. France
- 2.4. Italy
- 2.5. Spain
- 2.6. Rest of Europe
-
3. Asia Pacific
- 3.1. China
- 3.2. Japan
- 3.3. India
- 3.4. Australia
- 3.5. South Korea
- 3.6. Rest of Asia Pacific
-
4. Middle East and Africa
- 4.1. GCC
- 4.2. South Africa
- 4.3. Rest of Middle East and Africa
-
5. South America
- 5.1. Brazil
- 5.2. Argentina
- 5.3. Rest of South America
Neurostimulation Devices Industry REPORT HIGHLIGHTS
| Aspects | Details |
|---|---|
| Study Period | 2019-2033 |
| Base Year | 2024 |
| Estimated Year | 2025 |
| Forecast Period | 2025-2033 |
| Historical Period | 2019-2024 |
| Growth Rate | CAGR of 12.50% from 2019-2033 |
| Segmentation |
|
Table of Contents
- 1. Introduction
- 1.1. Research Scope
- 1.2. Market Segmentation
- 1.3. Research Methodology
- 1.4. Definitions and Assumptions
- 2. Executive Summary
- 2.1. Introduction
- 3. Market Dynamics
- 3.1. Introduction
- 3.2. Market Drivers
- 3.2.1. Rise in Prevalence of Neurological Disorders; Technological Advancements in Neurostimulation Devices
- 3.3. Market Restrains
- 3.3.1. Complications Associated with Neurostimulation Devices; Stringent Device Approval Regulations
- 3.4. Market Trends
- 3.4.1. Spinal Cord Stimulator is Expected to Dominate the Market During the Forecast Period
- 4. Market Factor Analysis
- 4.1. Porters Five Forces
- 4.2. Supply/Value Chain
- 4.3. PESTEL analysis
- 4.4. Market Entropy
- 4.5. Patent/Trademark Analysis
- 5. Global Neurostimulation Devices Industry Analysis, Insights and Forecast, 2019-2031
- 5.1. Market Analysis, Insights and Forecast - by Device Type
- 5.1.1. Implantable Devices
- 5.1.1.1. Spinal Cord Stimulators
- 5.1.1.2. Deep Brain Stimulators
- 5.1.1.3. Sacral Nerve Stimulators
- 5.1.1.4. Vagus Nerve Stimulators
- 5.1.1.5. Gastric Electric Stimulators
- 5.1.1.6. Other Device Types
- 5.1.2. External Devices
- 5.1.2.1. Transcranial Magnetic Stimulation (TMS)
- 5.1.2.2. Transcutaneous Electrical Nerve Stimulation (TENS)
- 5.1.2.3. Other External Devices
- 5.1.1. Implantable Devices
- 5.2. Market Analysis, Insights and Forecast - by Application
- 5.2.1. Parkinson's Disease
- 5.2.2. Epilepsy
- 5.2.3. Depression
- 5.2.4. Dystonia
- 5.2.5. Pain Management
- 5.2.6. Other Applications
- 5.3. Market Analysis, Insights and Forecast - by End-Users
- 5.3.1. Clinics
- 5.3.2. Hospitals
- 5.3.3. Rehabilitation Centers
- 5.4. Market Analysis, Insights and Forecast - by Region
- 5.4.1. North America
- 5.4.2. Europe
- 5.4.3. Asia Pacific
- 5.4.4. Middle East and Africa
- 5.4.5. South America
- 5.1. Market Analysis, Insights and Forecast - by Device Type
- 6. North America Neurostimulation Devices Industry Analysis, Insights and Forecast, 2019-2031
- 6.1. Market Analysis, Insights and Forecast - by Device Type
- 6.1.1. Implantable Devices
- 6.1.1.1. Spinal Cord Stimulators
- 6.1.1.2. Deep Brain Stimulators
- 6.1.1.3. Sacral Nerve Stimulators
- 6.1.1.4. Vagus Nerve Stimulators
- 6.1.1.5. Gastric Electric Stimulators
- 6.1.1.6. Other Device Types
- 6.1.2. External Devices
- 6.1.2.1. Transcranial Magnetic Stimulation (TMS)
- 6.1.2.2. Transcutaneous Electrical Nerve Stimulation (TENS)
- 6.1.2.3. Other External Devices
- 6.1.1. Implantable Devices
- 6.2. Market Analysis, Insights and Forecast - by Application
- 6.2.1. Parkinson's Disease
- 6.2.2. Epilepsy
- 6.2.3. Depression
- 6.2.4. Dystonia
- 6.2.5. Pain Management
- 6.2.6. Other Applications
- 6.3. Market Analysis, Insights and Forecast - by End-Users
- 6.3.1. Clinics
- 6.3.2. Hospitals
- 6.3.3. Rehabilitation Centers
- 6.1. Market Analysis, Insights and Forecast - by Device Type
- 7. Europe Neurostimulation Devices Industry Analysis, Insights and Forecast, 2019-2031
- 7.1. Market Analysis, Insights and Forecast - by Device Type
- 7.1.1. Implantable Devices
- 7.1.1.1. Spinal Cord Stimulators
- 7.1.1.2. Deep Brain Stimulators
- 7.1.1.3. Sacral Nerve Stimulators
- 7.1.1.4. Vagus Nerve Stimulators
- 7.1.1.5. Gastric Electric Stimulators
- 7.1.1.6. Other Device Types
- 7.1.2. External Devices
- 7.1.2.1. Transcranial Magnetic Stimulation (TMS)
- 7.1.2.2. Transcutaneous Electrical Nerve Stimulation (TENS)
- 7.1.2.3. Other External Devices
- 7.1.1. Implantable Devices
- 7.2. Market Analysis, Insights and Forecast - by Application
- 7.2.1. Parkinson's Disease
- 7.2.2. Epilepsy
- 7.2.3. Depression
- 7.2.4. Dystonia
- 7.2.5. Pain Management
- 7.2.6. Other Applications
- 7.3. Market Analysis, Insights and Forecast - by End-Users
- 7.3.1. Clinics
- 7.3.2. Hospitals
- 7.3.3. Rehabilitation Centers
- 7.1. Market Analysis, Insights and Forecast - by Device Type
- 8. Asia Pacific Neurostimulation Devices Industry Analysis, Insights and Forecast, 2019-2031
- 8.1. Market Analysis, Insights and Forecast - by Device Type
- 8.1.1. Implantable Devices
- 8.1.1.1. Spinal Cord Stimulators
- 8.1.1.2. Deep Brain Stimulators
- 8.1.1.3. Sacral Nerve Stimulators
- 8.1.1.4. Vagus Nerve Stimulators
- 8.1.1.5. Gastric Electric Stimulators
- 8.1.1.6. Other Device Types
- 8.1.2. External Devices
- 8.1.2.1. Transcranial Magnetic Stimulation (TMS)
- 8.1.2.2. Transcutaneous Electrical Nerve Stimulation (TENS)
- 8.1.2.3. Other External Devices
- 8.1.1. Implantable Devices
- 8.2. Market Analysis, Insights and Forecast - by Application
- 8.2.1. Parkinson's Disease
- 8.2.2. Epilepsy
- 8.2.3. Depression
- 8.2.4. Dystonia
- 8.2.5. Pain Management
- 8.2.6. Other Applications
- 8.3. Market Analysis, Insights and Forecast - by End-Users
- 8.3.1. Clinics
- 8.3.2. Hospitals
- 8.3.3. Rehabilitation Centers
- 8.1. Market Analysis, Insights and Forecast - by Device Type
- 9. Middle East and Africa Neurostimulation Devices Industry Analysis, Insights and Forecast, 2019-2031
- 9.1. Market Analysis, Insights and Forecast - by Device Type
- 9.1.1. Implantable Devices
- 9.1.1.1. Spinal Cord Stimulators
- 9.1.1.2. Deep Brain Stimulators
- 9.1.1.3. Sacral Nerve Stimulators
- 9.1.1.4. Vagus Nerve Stimulators
- 9.1.1.5. Gastric Electric Stimulators
- 9.1.1.6. Other Device Types
- 9.1.2. External Devices
- 9.1.2.1. Transcranial Magnetic Stimulation (TMS)
- 9.1.2.2. Transcutaneous Electrical Nerve Stimulation (TENS)
- 9.1.2.3. Other External Devices
- 9.1.1. Implantable Devices
- 9.2. Market Analysis, Insights and Forecast - by Application
- 9.2.1. Parkinson's Disease
- 9.2.2. Epilepsy
- 9.2.3. Depression
- 9.2.4. Dystonia
- 9.2.5. Pain Management
- 9.2.6. Other Applications
- 9.3. Market Analysis, Insights and Forecast - by End-Users
- 9.3.1. Clinics
- 9.3.2. Hospitals
- 9.3.3. Rehabilitation Centers
- 9.1. Market Analysis, Insights and Forecast - by Device Type
- 10. South America Neurostimulation Devices Industry Analysis, Insights and Forecast, 2019-2031
- 10.1. Market Analysis, Insights and Forecast - by Device Type
- 10.1.1. Implantable Devices
- 10.1.1.1. Spinal Cord Stimulators
- 10.1.1.2. Deep Brain Stimulators
- 10.1.1.3. Sacral Nerve Stimulators
- 10.1.1.4. Vagus Nerve Stimulators
- 10.1.1.5. Gastric Electric Stimulators
- 10.1.1.6. Other Device Types
- 10.1.2. External Devices
- 10.1.2.1. Transcranial Magnetic Stimulation (TMS)
- 10.1.2.2. Transcutaneous Electrical Nerve Stimulation (TENS)
- 10.1.2.3. Other External Devices
- 10.1.1. Implantable Devices
- 10.2. Market Analysis, Insights and Forecast - by Application
- 10.2.1. Parkinson's Disease
- 10.2.2. Epilepsy
- 10.2.3. Depression
- 10.2.4. Dystonia
- 10.2.5. Pain Management
- 10.2.6. Other Applications
- 10.3. Market Analysis, Insights and Forecast - by End-Users
- 10.3.1. Clinics
- 10.3.2. Hospitals
- 10.3.3. Rehabilitation Centers
- 10.1. Market Analysis, Insights and Forecast - by Device Type
- 11. North America Neurostimulation Devices Industry Analysis, Insights and Forecast, 2019-2031
- 11.1. Market Analysis, Insights and Forecast - By Country/Sub-region
- 11.1.1 United States
- 11.1.2 Canada
- 11.1.3 Mexico
- 12. Europe Neurostimulation Devices Industry Analysis, Insights and Forecast, 2019-2031
- 12.1. Market Analysis, Insights and Forecast - By Country/Sub-region
- 12.1.1 Germany
- 12.1.2 United Kingdom
- 12.1.3 France
- 12.1.4 Italy
- 12.1.5 Spain
- 12.1.6 Rest of Europe
- 13. Asia Pacific Neurostimulation Devices Industry Analysis, Insights and Forecast, 2019-2031
- 13.1. Market Analysis, Insights and Forecast - By Country/Sub-region
- 13.1.1 China
- 13.1.2 Japan
- 13.1.3 India
- 13.1.4 Australia
- 13.1.5 South Korea
- 13.1.6 Rest of Asia Pacific
- 14. Middle East and Africa Neurostimulation Devices Industry Analysis, Insights and Forecast, 2019-2031
- 14.1. Market Analysis, Insights and Forecast - By Country/Sub-region
- 14.1.1 GCC
- 14.1.2 South Africa
- 14.1.3 Rest of Middle East and Africa
- 15. South America Neurostimulation Devices Industry Analysis, Insights and Forecast, 2019-2031
- 15.1. Market Analysis, Insights and Forecast - By Country/Sub-region
- 15.1.1 Brazil
- 15.1.2 Argentina
- 15.1.3 Rest of South America
- 16. Competitive Analysis
- 16.1. Global Market Share Analysis 2024
- 16.2. Company Profiles
- 16.2.1 Neuronetics
- 16.2.1.1. Overview
- 16.2.1.2. Products
- 16.2.1.3. SWOT Analysis
- 16.2.1.4. Recent Developments
- 16.2.1.5. Financials (Based on Availability)
- 16.2.2 Medtronic
- 16.2.2.1. Overview
- 16.2.2.2. Products
- 16.2.2.3. SWOT Analysis
- 16.2.2.4. Recent Developments
- 16.2.2.5. Financials (Based on Availability)
- 16.2.3 NeuroPace Inc
- 16.2.3.1. Overview
- 16.2.3.2. Products
- 16.2.3.3. SWOT Analysis
- 16.2.3.4. Recent Developments
- 16.2.3.5. Financials (Based on Availability)
- 16.2.4 Nevro Corp
- 16.2.4.1. Overview
- 16.2.4.2. Products
- 16.2.4.3. SWOT Analysis
- 16.2.4.4. Recent Developments
- 16.2.4.5. Financials (Based on Availability)
- 16.2.5 Synapse Biomedical Inc
- 16.2.5.1. Overview
- 16.2.5.2. Products
- 16.2.5.3. SWOT Analysis
- 16.2.5.4. Recent Developments
- 16.2.5.5. Financials (Based on Availability)
- 16.2.6 LivaNova PLC
- 16.2.6.1. Overview
- 16.2.6.2. Products
- 16.2.6.3. SWOT Analysis
- 16.2.6.4. Recent Developments
- 16.2.6.5. Financials (Based on Availability)
- 16.2.7 Abbott
- 16.2.7.1. Overview
- 16.2.7.2. Products
- 16.2.7.3. SWOT Analysis
- 16.2.7.4. Recent Developments
- 16.2.7.5. Financials (Based on Availability)
- 16.2.8 Curonix LLC
- 16.2.8.1. Overview
- 16.2.8.2. Products
- 16.2.8.3. SWOT Analysis
- 16.2.8.4. Recent Developments
- 16.2.8.5. Financials (Based on Availability)
- 16.2.9 Boston Scientific Corporation
- 16.2.9.1. Overview
- 16.2.9.2. Products
- 16.2.9.3. SWOT Analysis
- 16.2.9.4. Recent Developments
- 16.2.9.5. Financials (Based on Availability)
- 16.2.10 Aleva Neurotherapeutics
- 16.2.10.1. Overview
- 16.2.10.2. Products
- 16.2.10.3. SWOT Analysis
- 16.2.10.4. Recent Developments
- 16.2.10.5. Financials (Based on Availability)
- 16.2.1 Neuronetics
List of Figures
- Figure 1: Global Neurostimulation Devices Industry Revenue Breakdown (Million, %) by Region 2024 & 2032
- Figure 2: Global Neurostimulation Devices Industry Volume Breakdown (K Unit, %) by Region 2024 & 2032
- Figure 3: North America Neurostimulation Devices Industry Revenue (Million), by Country 2024 & 2032
- Figure 4: North America Neurostimulation Devices Industry Volume (K Unit), by Country 2024 & 2032
- Figure 5: North America Neurostimulation Devices Industry Revenue Share (%), by Country 2024 & 2032
- Figure 6: North America Neurostimulation Devices Industry Volume Share (%), by Country 2024 & 2032
- Figure 7: Europe Neurostimulation Devices Industry Revenue (Million), by Country 2024 & 2032
- Figure 8: Europe Neurostimulation Devices Industry Volume (K Unit), by Country 2024 & 2032
- Figure 9: Europe Neurostimulation Devices Industry Revenue Share (%), by Country 2024 & 2032
- Figure 10: Europe Neurostimulation Devices Industry Volume Share (%), by Country 2024 & 2032
- Figure 11: Asia Pacific Neurostimulation Devices Industry Revenue (Million), by Country 2024 & 2032
- Figure 12: Asia Pacific Neurostimulation Devices Industry Volume (K Unit), by Country 2024 & 2032
- Figure 13: Asia Pacific Neurostimulation Devices Industry Revenue Share (%), by Country 2024 & 2032
- Figure 14: Asia Pacific Neurostimulation Devices Industry Volume Share (%), by Country 2024 & 2032
- Figure 15: Middle East and Africa Neurostimulation Devices Industry Revenue (Million), by Country 2024 & 2032
- Figure 16: Middle East and Africa Neurostimulation Devices Industry Volume (K Unit), by Country 2024 & 2032
- Figure 17: Middle East and Africa Neurostimulation Devices Industry Revenue Share (%), by Country 2024 & 2032
- Figure 18: Middle East and Africa Neurostimulation Devices Industry Volume Share (%), by Country 2024 & 2032
- Figure 19: South America Neurostimulation Devices Industry Revenue (Million), by Country 2024 & 2032
- Figure 20: South America Neurostimulation Devices Industry Volume (K Unit), by Country 2024 & 2032
- Figure 21: South America Neurostimulation Devices Industry Revenue Share (%), by Country 2024 & 2032
- Figure 22: South America Neurostimulation Devices Industry Volume Share (%), by Country 2024 & 2032
- Figure 23: North America Neurostimulation Devices Industry Revenue (Million), by Device Type 2024 & 2032
- Figure 24: North America Neurostimulation Devices Industry Volume (K Unit), by Device Type 2024 & 2032
- Figure 25: North America Neurostimulation Devices Industry Revenue Share (%), by Device Type 2024 & 2032
- Figure 26: North America Neurostimulation Devices Industry Volume Share (%), by Device Type 2024 & 2032
- Figure 27: North America Neurostimulation Devices Industry Revenue (Million), by Application 2024 & 2032
- Figure 28: North America Neurostimulation Devices Industry Volume (K Unit), by Application 2024 & 2032
- Figure 29: North America Neurostimulation Devices Industry Revenue Share (%), by Application 2024 & 2032
- Figure 30: North America Neurostimulation Devices Industry Volume Share (%), by Application 2024 & 2032
- Figure 31: North America Neurostimulation Devices Industry Revenue (Million), by End-Users 2024 & 2032
- Figure 32: North America Neurostimulation Devices Industry Volume (K Unit), by End-Users 2024 & 2032
- Figure 33: North America Neurostimulation Devices Industry Revenue Share (%), by End-Users 2024 & 2032
- Figure 34: North America Neurostimulation Devices Industry Volume Share (%), by End-Users 2024 & 2032
- Figure 35: North America Neurostimulation Devices Industry Revenue (Million), by Country 2024 & 2032
- Figure 36: North America Neurostimulation Devices Industry Volume (K Unit), by Country 2024 & 2032
- Figure 37: North America Neurostimulation Devices Industry Revenue Share (%), by Country 2024 & 2032
- Figure 38: North America Neurostimulation Devices Industry Volume Share (%), by Country 2024 & 2032
- Figure 39: Europe Neurostimulation Devices Industry Revenue (Million), by Device Type 2024 & 2032
- Figure 40: Europe Neurostimulation Devices Industry Volume (K Unit), by Device Type 2024 & 2032
- Figure 41: Europe Neurostimulation Devices Industry Revenue Share (%), by Device Type 2024 & 2032
- Figure 42: Europe Neurostimulation Devices Industry Volume Share (%), by Device Type 2024 & 2032
- Figure 43: Europe Neurostimulation Devices Industry Revenue (Million), by Application 2024 & 2032
- Figure 44: Europe Neurostimulation Devices Industry Volume (K Unit), by Application 2024 & 2032
- Figure 45: Europe Neurostimulation Devices Industry Revenue Share (%), by Application 2024 & 2032
- Figure 46: Europe Neurostimulation Devices Industry Volume Share (%), by Application 2024 & 2032
- Figure 47: Europe Neurostimulation Devices Industry Revenue (Million), by End-Users 2024 & 2032
- Figure 48: Europe Neurostimulation Devices Industry Volume (K Unit), by End-Users 2024 & 2032
- Figure 49: Europe Neurostimulation Devices Industry Revenue Share (%), by End-Users 2024 & 2032
- Figure 50: Europe Neurostimulation Devices Industry Volume Share (%), by End-Users 2024 & 2032
- Figure 51: Europe Neurostimulation Devices Industry Revenue (Million), by Country 2024 & 2032
- Figure 52: Europe Neurostimulation Devices Industry Volume (K Unit), by Country 2024 & 2032
- Figure 53: Europe Neurostimulation Devices Industry Revenue Share (%), by Country 2024 & 2032
- Figure 54: Europe Neurostimulation Devices Industry Volume Share (%), by Country 2024 & 2032
- Figure 55: Asia Pacific Neurostimulation Devices Industry Revenue (Million), by Device Type 2024 & 2032
- Figure 56: Asia Pacific Neurostimulation Devices Industry Volume (K Unit), by Device Type 2024 & 2032
- Figure 57: Asia Pacific Neurostimulation Devices Industry Revenue Share (%), by Device Type 2024 & 2032
- Figure 58: Asia Pacific Neurostimulation Devices Industry Volume Share (%), by Device Type 2024 & 2032
- Figure 59: Asia Pacific Neurostimulation Devices Industry Revenue (Million), by Application 2024 & 2032
- Figure 60: Asia Pacific Neurostimulation Devices Industry Volume (K Unit), by Application 2024 & 2032
- Figure 61: Asia Pacific Neurostimulation Devices Industry Revenue Share (%), by Application 2024 & 2032
- Figure 62: Asia Pacific Neurostimulation Devices Industry Volume Share (%), by Application 2024 & 2032
- Figure 63: Asia Pacific Neurostimulation Devices Industry Revenue (Million), by End-Users 2024 & 2032
- Figure 64: Asia Pacific Neurostimulation Devices Industry Volume (K Unit), by End-Users 2024 & 2032
- Figure 65: Asia Pacific Neurostimulation Devices Industry Revenue Share (%), by End-Users 2024 & 2032
- Figure 66: Asia Pacific Neurostimulation Devices Industry Volume Share (%), by End-Users 2024 & 2032
- Figure 67: Asia Pacific Neurostimulation Devices Industry Revenue (Million), by Country 2024 & 2032
- Figure 68: Asia Pacific Neurostimulation Devices Industry Volume (K Unit), by Country 2024 & 2032
- Figure 69: Asia Pacific Neurostimulation Devices Industry Revenue Share (%), by Country 2024 & 2032
- Figure 70: Asia Pacific Neurostimulation Devices Industry Volume Share (%), by Country 2024 & 2032
- Figure 71: Middle East and Africa Neurostimulation Devices Industry Revenue (Million), by Device Type 2024 & 2032
- Figure 72: Middle East and Africa Neurostimulation Devices Industry Volume (K Unit), by Device Type 2024 & 2032
- Figure 73: Middle East and Africa Neurostimulation Devices Industry Revenue Share (%), by Device Type 2024 & 2032
- Figure 74: Middle East and Africa Neurostimulation Devices Industry Volume Share (%), by Device Type 2024 & 2032
- Figure 75: Middle East and Africa Neurostimulation Devices Industry Revenue (Million), by Application 2024 & 2032
- Figure 76: Middle East and Africa Neurostimulation Devices Industry Volume (K Unit), by Application 2024 & 2032
- Figure 77: Middle East and Africa Neurostimulation Devices Industry Revenue Share (%), by Application 2024 & 2032
- Figure 78: Middle East and Africa Neurostimulation Devices Industry Volume Share (%), by Application 2024 & 2032
- Figure 79: Middle East and Africa Neurostimulation Devices Industry Revenue (Million), by End-Users 2024 & 2032
- Figure 80: Middle East and Africa Neurostimulation Devices Industry Volume (K Unit), by End-Users 2024 & 2032
- Figure 81: Middle East and Africa Neurostimulation Devices Industry Revenue Share (%), by End-Users 2024 & 2032
- Figure 82: Middle East and Africa Neurostimulation Devices Industry Volume Share (%), by End-Users 2024 & 2032
- Figure 83: Middle East and Africa Neurostimulation Devices Industry Revenue (Million), by Country 2024 & 2032
- Figure 84: Middle East and Africa Neurostimulation Devices Industry Volume (K Unit), by Country 2024 & 2032
- Figure 85: Middle East and Africa Neurostimulation Devices Industry Revenue Share (%), by Country 2024 & 2032
- Figure 86: Middle East and Africa Neurostimulation Devices Industry Volume Share (%), by Country 2024 & 2032
- Figure 87: South America Neurostimulation Devices Industry Revenue (Million), by Device Type 2024 & 2032
- Figure 88: South America Neurostimulation Devices Industry Volume (K Unit), by Device Type 2024 & 2032
- Figure 89: South America Neurostimulation Devices Industry Revenue Share (%), by Device Type 2024 & 2032
- Figure 90: South America Neurostimulation Devices Industry Volume Share (%), by Device Type 2024 & 2032
- Figure 91: South America Neurostimulation Devices Industry Revenue (Million), by Application 2024 & 2032
- Figure 92: South America Neurostimulation Devices Industry Volume (K Unit), by Application 2024 & 2032
- Figure 93: South America Neurostimulation Devices Industry Revenue Share (%), by Application 2024 & 2032
- Figure 94: South America Neurostimulation Devices Industry Volume Share (%), by Application 2024 & 2032
- Figure 95: South America Neurostimulation Devices Industry Revenue (Million), by End-Users 2024 & 2032
- Figure 96: South America Neurostimulation Devices Industry Volume (K Unit), by End-Users 2024 & 2032
- Figure 97: South America Neurostimulation Devices Industry Revenue Share (%), by End-Users 2024 & 2032
- Figure 98: South America Neurostimulation Devices Industry Volume Share (%), by End-Users 2024 & 2032
- Figure 99: South America Neurostimulation Devices Industry Revenue (Million), by Country 2024 & 2032
- Figure 100: South America Neurostimulation Devices Industry Volume (K Unit), by Country 2024 & 2032
- Figure 101: South America Neurostimulation Devices Industry Revenue Share (%), by Country 2024 & 2032
- Figure 102: South America Neurostimulation Devices Industry Volume Share (%), by Country 2024 & 2032
List of Tables
- Table 1: Global Neurostimulation Devices Industry Revenue Million Forecast, by Region 2019 & 2032
- Table 2: Global Neurostimulation Devices Industry Volume K Unit Forecast, by Region 2019 & 2032
- Table 3: Global Neurostimulation Devices Industry Revenue Million Forecast, by Device Type 2019 & 2032
- Table 4: Global Neurostimulation Devices Industry Volume K Unit Forecast, by Device Type 2019 & 2032
- Table 5: Global Neurostimulation Devices Industry Revenue Million Forecast, by Application 2019 & 2032
- Table 6: Global Neurostimulation Devices Industry Volume K Unit Forecast, by Application 2019 & 2032
- Table 7: Global Neurostimulation Devices Industry Revenue Million Forecast, by End-Users 2019 & 2032
- Table 8: Global Neurostimulation Devices Industry Volume K Unit Forecast, by End-Users 2019 & 2032
- Table 9: Global Neurostimulation Devices Industry Revenue Million Forecast, by Region 2019 & 2032
- Table 10: Global Neurostimulation Devices Industry Volume K Unit Forecast, by Region 2019 & 2032
- Table 11: Global Neurostimulation Devices Industry Revenue Million Forecast, by Country 2019 & 2032
- Table 12: Global Neurostimulation Devices Industry Volume K Unit Forecast, by Country 2019 & 2032
- Table 13: United States Neurostimulation Devices Industry Revenue (Million) Forecast, by Application 2019 & 2032
- Table 14: United States Neurostimulation Devices Industry Volume (K Unit) Forecast, by Application 2019 & 2032
- Table 15: Canada Neurostimulation Devices Industry Revenue (Million) Forecast, by Application 2019 & 2032
- Table 16: Canada Neurostimulation Devices Industry Volume (K Unit) Forecast, by Application 2019 & 2032
- Table 17: Mexico Neurostimulation Devices Industry Revenue (Million) Forecast, by Application 2019 & 2032
- Table 18: Mexico Neurostimulation Devices Industry Volume (K Unit) Forecast, by Application 2019 & 2032
- Table 19: Global Neurostimulation Devices Industry Revenue Million Forecast, by Country 2019 & 2032
- Table 20: Global Neurostimulation Devices Industry Volume K Unit Forecast, by Country 2019 & 2032
- Table 21: Germany Neurostimulation Devices Industry Revenue (Million) Forecast, by Application 2019 & 2032
- Table 22: Germany Neurostimulation Devices Industry Volume (K Unit) Forecast, by Application 2019 & 2032
- Table 23: United Kingdom Neurostimulation Devices Industry Revenue (Million) Forecast, by Application 2019 & 2032
- Table 24: United Kingdom Neurostimulation Devices Industry Volume (K Unit) Forecast, by Application 2019 & 2032
- Table 25: France Neurostimulation Devices Industry Revenue (Million) Forecast, by Application 2019 & 2032
- Table 26: France Neurostimulation Devices Industry Volume (K Unit) Forecast, by Application 2019 & 2032
- Table 27: Italy Neurostimulation Devices Industry Revenue (Million) Forecast, by Application 2019 & 2032
- Table 28: Italy Neurostimulation Devices Industry Volume (K Unit) Forecast, by Application 2019 & 2032
- Table 29: Spain Neurostimulation Devices Industry Revenue (Million) Forecast, by Application 2019 & 2032
- Table 30: Spain Neurostimulation Devices Industry Volume (K Unit) Forecast, by Application 2019 & 2032
- Table 31: Rest of Europe Neurostimulation Devices Industry Revenue (Million) Forecast, by Application 2019 & 2032
- Table 32: Rest of Europe Neurostimulation Devices Industry Volume (K Unit) Forecast, by Application 2019 & 2032
- Table 33: Global Neurostimulation Devices Industry Revenue Million Forecast, by Country 2019 & 2032
- Table 34: Global Neurostimulation Devices Industry Volume K Unit Forecast, by Country 2019 & 2032
- Table 35: China Neurostimulation Devices Industry Revenue (Million) Forecast, by Application 2019 & 2032
- Table 36: China Neurostimulation Devices Industry Volume (K Unit) Forecast, by Application 2019 & 2032
- Table 37: Japan Neurostimulation Devices Industry Revenue (Million) Forecast, by Application 2019 & 2032
- Table 38: Japan Neurostimulation Devices Industry Volume (K Unit) Forecast, by Application 2019 & 2032
- Table 39: India Neurostimulation Devices Industry Revenue (Million) Forecast, by Application 2019 & 2032
- Table 40: India Neurostimulation Devices Industry Volume (K Unit) Forecast, by Application 2019 & 2032
- Table 41: Australia Neurostimulation Devices Industry Revenue (Million) Forecast, by Application 2019 & 2032
- Table 42: Australia Neurostimulation Devices Industry Volume (K Unit) Forecast, by Application 2019 & 2032
- Table 43: South Korea Neurostimulation Devices Industry Revenue (Million) Forecast, by Application 2019 & 2032
- Table 44: South Korea Neurostimulation Devices Industry Volume (K Unit) Forecast, by Application 2019 & 2032
- Table 45: Rest of Asia Pacific Neurostimulation Devices Industry Revenue (Million) Forecast, by Application 2019 & 2032
- Table 46: Rest of Asia Pacific Neurostimulation Devices Industry Volume (K Unit) Forecast, by Application 2019 & 2032
- Table 47: Global Neurostimulation Devices Industry Revenue Million Forecast, by Country 2019 & 2032
- Table 48: Global Neurostimulation Devices Industry Volume K Unit Forecast, by Country 2019 & 2032
- Table 49: GCC Neurostimulation Devices Industry Revenue (Million) Forecast, by Application 2019 & 2032
- Table 50: GCC Neurostimulation Devices Industry Volume (K Unit) Forecast, by Application 2019 & 2032
- Table 51: South Africa Neurostimulation Devices Industry Revenue (Million) Forecast, by Application 2019 & 2032
- Table 52: South Africa Neurostimulation Devices Industry Volume (K Unit) Forecast, by Application 2019 & 2032
- Table 53: Rest of Middle East and Africa Neurostimulation Devices Industry Revenue (Million) Forecast, by Application 2019 & 2032
- Table 54: Rest of Middle East and Africa Neurostimulation Devices Industry Volume (K Unit) Forecast, by Application 2019 & 2032
- Table 55: Global Neurostimulation Devices Industry Revenue Million Forecast, by Country 2019 & 2032
- Table 56: Global Neurostimulation Devices Industry Volume K Unit Forecast, by Country 2019 & 2032
- Table 57: Brazil Neurostimulation Devices Industry Revenue (Million) Forecast, by Application 2019 & 2032
- Table 58: Brazil Neurostimulation Devices Industry Volume (K Unit) Forecast, by Application 2019 & 2032
- Table 59: Argentina Neurostimulation Devices Industry Revenue (Million) Forecast, by Application 2019 & 2032
- Table 60: Argentina Neurostimulation Devices Industry Volume (K Unit) Forecast, by Application 2019 & 2032
- Table 61: Rest of South America Neurostimulation Devices Industry Revenue (Million) Forecast, by Application 2019 & 2032
- Table 62: Rest of South America Neurostimulation Devices Industry Volume (K Unit) Forecast, by Application 2019 & 2032
- Table 63: Global Neurostimulation Devices Industry Revenue Million Forecast, by Device Type 2019 & 2032
- Table 64: Global Neurostimulation Devices Industry Volume K Unit Forecast, by Device Type 2019 & 2032
- Table 65: Global Neurostimulation Devices Industry Revenue Million Forecast, by Application 2019 & 2032
- Table 66: Global Neurostimulation Devices Industry Volume K Unit Forecast, by Application 2019 & 2032
- Table 67: Global Neurostimulation Devices Industry Revenue Million Forecast, by End-Users 2019 & 2032
- Table 68: Global Neurostimulation Devices Industry Volume K Unit Forecast, by End-Users 2019 & 2032
- Table 69: Global Neurostimulation Devices Industry Revenue Million Forecast, by Country 2019 & 2032
- Table 70: Global Neurostimulation Devices Industry Volume K Unit Forecast, by Country 2019 & 2032
- Table 71: United States Neurostimulation Devices Industry Revenue (Million) Forecast, by Application 2019 & 2032
- Table 72: United States Neurostimulation Devices Industry Volume (K Unit) Forecast, by Application 2019 & 2032
- Table 73: Canada Neurostimulation Devices Industry Revenue (Million) Forecast, by Application 2019 & 2032
- Table 74: Canada Neurostimulation Devices Industry Volume (K Unit) Forecast, by Application 2019 & 2032
- Table 75: Mexico Neurostimulation Devices Industry Revenue (Million) Forecast, by Application 2019 & 2032
- Table 76: Mexico Neurostimulation Devices Industry Volume (K Unit) Forecast, by Application 2019 & 2032
- Table 77: Global Neurostimulation Devices Industry Revenue Million Forecast, by Device Type 2019 & 2032
- Table 78: Global Neurostimulation Devices Industry Volume K Unit Forecast, by Device Type 2019 & 2032
- Table 79: Global Neurostimulation Devices Industry Revenue Million Forecast, by Application 2019 & 2032
- Table 80: Global Neurostimulation Devices Industry Volume K Unit Forecast, by Application 2019 & 2032
- Table 81: Global Neurostimulation Devices Industry Revenue Million Forecast, by End-Users 2019 & 2032
- Table 82: Global Neurostimulation Devices Industry Volume K Unit Forecast, by End-Users 2019 & 2032
- Table 83: Global Neurostimulation Devices Industry Revenue Million Forecast, by Country 2019 & 2032
- Table 84: Global Neurostimulation Devices Industry Volume K Unit Forecast, by Country 2019 & 2032
- Table 85: Germany Neurostimulation Devices Industry Revenue (Million) Forecast, by Application 2019 & 2032
- Table 86: Germany Neurostimulation Devices Industry Volume (K Unit) Forecast, by Application 2019 & 2032
- Table 87: United Kingdom Neurostimulation Devices Industry Revenue (Million) Forecast, by Application 2019 & 2032
- Table 88: United Kingdom Neurostimulation Devices Industry Volume (K Unit) Forecast, by Application 2019 & 2032
- Table 89: France Neurostimulation Devices Industry Revenue (Million) Forecast, by Application 2019 & 2032
- Table 90: France Neurostimulation Devices Industry Volume (K Unit) Forecast, by Application 2019 & 2032
- Table 91: Italy Neurostimulation Devices Industry Revenue (Million) Forecast, by Application 2019 & 2032
- Table 92: Italy Neurostimulation Devices Industry Volume (K Unit) Forecast, by Application 2019 & 2032
- Table 93: Spain Neurostimulation Devices Industry Revenue (Million) Forecast, by Application 2019 & 2032
- Table 94: Spain Neurostimulation Devices Industry Volume (K Unit) Forecast, by Application 2019 & 2032
- Table 95: Rest of Europe Neurostimulation Devices Industry Revenue (Million) Forecast, by Application 2019 & 2032
- Table 96: Rest of Europe Neurostimulation Devices Industry Volume (K Unit) Forecast, by Application 2019 & 2032
- Table 97: Global Neurostimulation Devices Industry Revenue Million Forecast, by Device Type 2019 & 2032
- Table 98: Global Neurostimulation Devices Industry Volume K Unit Forecast, by Device Type 2019 & 2032
- Table 99: Global Neurostimulation Devices Industry Revenue Million Forecast, by Application 2019 & 2032
- Table 100: Global Neurostimulation Devices Industry Volume K Unit Forecast, by Application 2019 & 2032
- Table 101: Global Neurostimulation Devices Industry Revenue Million Forecast, by End-Users 2019 & 2032
- Table 102: Global Neurostimulation Devices Industry Volume K Unit Forecast, by End-Users 2019 & 2032
- Table 103: Global Neurostimulation Devices Industry Revenue Million Forecast, by Country 2019 & 2032
- Table 104: Global Neurostimulation Devices Industry Volume K Unit Forecast, by Country 2019 & 2032
- Table 105: China Neurostimulation Devices Industry Revenue (Million) Forecast, by Application 2019 & 2032
- Table 106: China Neurostimulation Devices Industry Volume (K Unit) Forecast, by Application 2019 & 2032
- Table 107: Japan Neurostimulation Devices Industry Revenue (Million) Forecast, by Application 2019 & 2032
- Table 108: Japan Neurostimulation Devices Industry Volume (K Unit) Forecast, by Application 2019 & 2032
- Table 109: India Neurostimulation Devices Industry Revenue (Million) Forecast, by Application 2019 & 2032
- Table 110: India Neurostimulation Devices Industry Volume (K Unit) Forecast, by Application 2019 & 2032
- Table 111: Australia Neurostimulation Devices Industry Revenue (Million) Forecast, by Application 2019 & 2032
- Table 112: Australia Neurostimulation Devices Industry Volume (K Unit) Forecast, by Application 2019 & 2032
- Table 113: South Korea Neurostimulation Devices Industry Revenue (Million) Forecast, by Application 2019 & 2032
- Table 114: South Korea Neurostimulation Devices Industry Volume (K Unit) Forecast, by Application 2019 & 2032
- Table 115: Rest of Asia Pacific Neurostimulation Devices Industry Revenue (Million) Forecast, by Application 2019 & 2032
- Table 116: Rest of Asia Pacific Neurostimulation Devices Industry Volume (K Unit) Forecast, by Application 2019 & 2032
- Table 117: Global Neurostimulation Devices Industry Revenue Million Forecast, by Device Type 2019 & 2032
- Table 118: Global Neurostimulation Devices Industry Volume K Unit Forecast, by Device Type 2019 & 2032
- Table 119: Global Neurostimulation Devices Industry Revenue Million Forecast, by Application 2019 & 2032
- Table 120: Global Neurostimulation Devices Industry Volume K Unit Forecast, by Application 2019 & 2032
- Table 121: Global Neurostimulation Devices Industry Revenue Million Forecast, by End-Users 2019 & 2032
- Table 122: Global Neurostimulation Devices Industry Volume K Unit Forecast, by End-Users 2019 & 2032
- Table 123: Global Neurostimulation Devices Industry Revenue Million Forecast, by Country 2019 & 2032
- Table 124: Global Neurostimulation Devices Industry Volume K Unit Forecast, by Country 2019 & 2032
- Table 125: GCC Neurostimulation Devices Industry Revenue (Million) Forecast, by Application 2019 & 2032
- Table 126: GCC Neurostimulation Devices Industry Volume (K Unit) Forecast, by Application 2019 & 2032
- Table 127: South Africa Neurostimulation Devices Industry Revenue (Million) Forecast, by Application 2019 & 2032
- Table 128: South Africa Neurostimulation Devices Industry Volume (K Unit) Forecast, by Application 2019 & 2032
- Table 129: Rest of Middle East and Africa Neurostimulation Devices Industry Revenue (Million) Forecast, by Application 2019 & 2032
- Table 130: Rest of Middle East and Africa Neurostimulation Devices Industry Volume (K Unit) Forecast, by Application 2019 & 2032
- Table 131: Global Neurostimulation Devices Industry Revenue Million Forecast, by Device Type 2019 & 2032
- Table 132: Global Neurostimulation Devices Industry Volume K Unit Forecast, by Device Type 2019 & 2032
- Table 133: Global Neurostimulation Devices Industry Revenue Million Forecast, by Application 2019 & 2032
- Table 134: Global Neurostimulation Devices Industry Volume K Unit Forecast, by Application 2019 & 2032
- Table 135: Global Neurostimulation Devices Industry Revenue Million Forecast, by End-Users 2019 & 2032
- Table 136: Global Neurostimulation Devices Industry Volume K Unit Forecast, by End-Users 2019 & 2032
- Table 137: Global Neurostimulation Devices Industry Revenue Million Forecast, by Country 2019 & 2032
- Table 138: Global Neurostimulation Devices Industry Volume K Unit Forecast, by Country 2019 & 2032
- Table 139: Brazil Neurostimulation Devices Industry Revenue (Million) Forecast, by Application 2019 & 2032
- Table 140: Brazil Neurostimulation Devices Industry Volume (K Unit) Forecast, by Application 2019 & 2032
- Table 141: Argentina Neurostimulation Devices Industry Revenue (Million) Forecast, by Application 2019 & 2032
- Table 142: Argentina Neurostimulation Devices Industry Volume (K Unit) Forecast, by Application 2019 & 2032
- Table 143: Rest of South America Neurostimulation Devices Industry Revenue (Million) Forecast, by Application 2019 & 2032
- Table 144: Rest of South America Neurostimulation Devices Industry Volume (K Unit) Forecast, by Application 2019 & 2032
Frequently Asked Questions
1. What is the projected Compound Annual Growth Rate (CAGR) of the Neurostimulation Devices Industry?
The projected CAGR is approximately 12.50%.
2. Which companies are prominent players in the Neurostimulation Devices Industry?
Key companies in the market include Neuronetics, Medtronic, NeuroPace Inc, Nevro Corp, Synapse Biomedical Inc , LivaNova PLC, Abbott, Curonix LLC, Boston Scientific Corporation, Aleva Neurotherapeutics.
3. What are the main segments of the Neurostimulation Devices Industry?
The market segments include Device Type, Application, End-Users.
4. Can you provide details about the market size?
The market size is estimated to be USD 8.21 Million as of 2022.
5. What are some drivers contributing to market growth?
Rise in Prevalence of Neurological Disorders; Technological Advancements in Neurostimulation Devices.
6. What are the notable trends driving market growth?
Spinal Cord Stimulator is Expected to Dominate the Market During the Forecast Period.
7. Are there any restraints impacting market growth?
Complications Associated with Neurostimulation Devices; Stringent Device Approval Regulations.
8. Can you provide examples of recent developments in the market?
May 2023: Abbott received FDA approval for its spinal cord stimulation (SCS) systems for treating chronic back pain in people who have not had or are not eligible to receive back surgery, known as non-surgical back pain. This new indication applies to all Abbott's SCS products in the United States, including the Eterna SCS platform and the Proclaim SCS family.
9. What pricing options are available for accessing the report?
Pricing options include single-user, multi-user, and enterprise licenses priced at USD 4750, USD 5250, and USD 8750 respectively.
10. Is the market size provided in terms of value or volume?
The market size is provided in terms of value, measured in Million and volume, measured in K Unit.
11. Are there any specific market keywords associated with the report?
Yes, the market keyword associated with the report is "Neurostimulation Devices Industry," which aids in identifying and referencing the specific market segment covered.
12. How do I determine which pricing option suits my needs best?
The pricing options vary based on user requirements and access needs. Individual users may opt for single-user licenses, while businesses requiring broader access may choose multi-user or enterprise licenses for cost-effective access to the report.
13. Are there any additional resources or data provided in the Neurostimulation Devices Industry report?
While the report offers comprehensive insights, it's advisable to review the specific contents or supplementary materials provided to ascertain if additional resources or data are available.
14. How can I stay updated on further developments or reports in the Neurostimulation Devices Industry?
To stay informed about further developments, trends, and reports in the Neurostimulation Devices Industry, consider subscribing to industry newsletters, following relevant companies and organizations, or regularly checking reputable industry news sources and publications.
Methodology
Step 1 - Identification of Relevant Samples Size from Population Database


Step 2 - Approaches for Defining Global Market Size (Value, Volume* & Price*)

Note*: In applicable scenarios
Step 3 - Data Sources
Primary Research
- Web Analytics
- Survey Reports
- Research Institute
- Latest Research Reports
- Opinion Leaders
Secondary Research
- Annual Reports
- White Paper
- Latest Press Release
- Industry Association
- Paid Database
- Investor Presentations

Step 4 - Data Triangulation
Involves using different sources of information in order to increase the validity of a study
These sources are likely to be stakeholders in a program - participants, other researchers, program staff, other community members, and so on.
Then we put all data in single framework & apply various statistical tools to find out the dynamic on the market.
During the analysis stage, feedback from the stakeholder groups would be compared to determine areas of agreement as well as areas of divergence
