

Key Insights
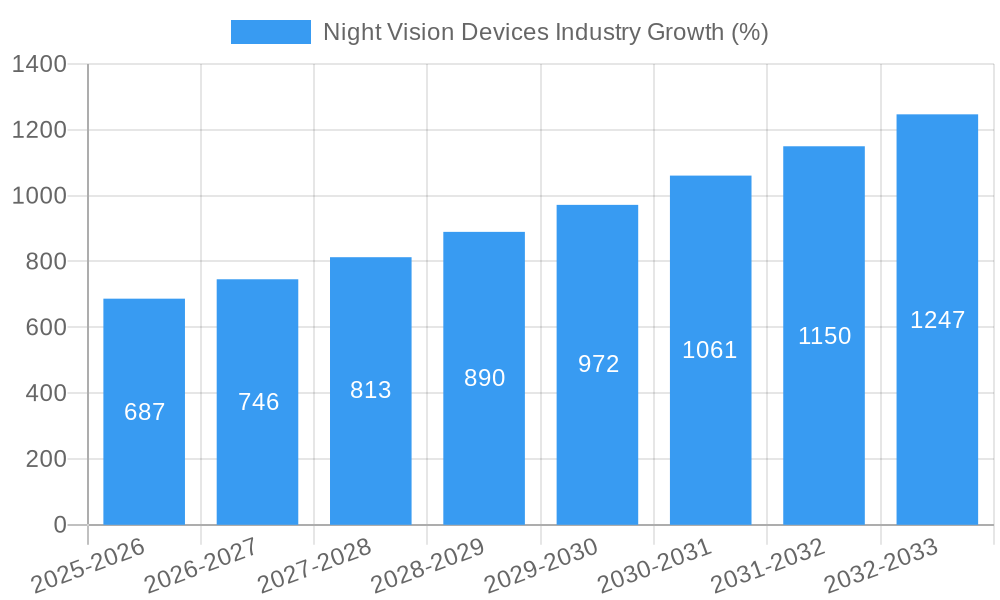
The Night Vision Devices (NVD) market, currently valued at $8.68 billion (2025), is experiencing robust growth, projected to expand at a Compound Annual Growth Rate (CAGR) of 7.97% from 2025 to 2033. This expansion is driven by increasing demand from military and defense sectors for advanced surveillance and targeting systems. Furthermore, the growing popularity of outdoor recreational activities like hunting and wildlife observation fuels the consumer segment's demand for high-quality NVDs. Technological advancements, including improved image resolution, enhanced thermal imaging capabilities, and miniaturization leading to more compact and user-friendly devices, are key market drivers. The market is segmented by type (cameras, goggles, monoculars/binoculars, rifle scopes, and others), technology (thermal imaging, image intensifiers, infrared illumination, and others), and application (military and defense, wildlife spotting, surveillance, navigation, and others). Leading players like L3Harris Technologies, Raytheon Technologies, and FLIR are investing heavily in R&D to maintain their competitive edge and capitalize on emerging market opportunities.
The market's growth trajectory is influenced by several factors. Government initiatives promoting national security and border protection contribute significantly to military and defense spending on NVDs. Conversely, the high initial cost of advanced NVDs and the need for specialized training to operate them can restrain market penetration in certain segments. However, ongoing technological advancements are making NVDs more affordable and accessible, mitigating this constraint to some extent. The Asia-Pacific region is expected to witness significant growth due to increasing defense budgets and rising consumer disposable income. North America maintains a strong market position due to the presence of major manufacturers and a robust military sector. Europe and other regions are also projected to experience steady growth, driven by increasing demand for surveillance and security solutions. Future growth will likely be shaped by the development of lightweight, integrated systems, enhanced user interfaces, and integration with other technologies such as artificial intelligence.

Night Vision Devices Industry Market Report: 2019-2033
This comprehensive report provides an in-depth analysis of the Night Vision Devices industry, covering market dynamics, key segments, leading players, and future growth prospects. With a study period spanning 2019-2033, a base year of 2025, and a forecast period of 2025-2033, this report offers actionable insights for industry stakeholders, investors, and businesses seeking to navigate this dynamic market. The global market size in 2025 is estimated at xx Million USD, with a projected CAGR of xx% during the forecast period.
Night Vision Devices Industry Market Concentration & Dynamics
The Night Vision Devices market exhibits a moderately concentrated landscape, with a few major players holding significant market share. L3Harris Technologies Inc., Raytheon Technologies Corporation, and Teledyne FLIR LLC are among the leading companies, collectively accounting for an estimated xx% of the global market in 2025. However, several smaller, specialized companies also contribute significantly, particularly in niche segments like wildlife spotting and specialized military applications.
The industry's innovation ecosystem is dynamic, with ongoing advancements in thermal imaging, image intensification, and sensor fusion technologies driving product development. Regulatory frameworks, particularly those related to military and defense applications, play a crucial role in shaping market dynamics. Substitute products, such as enhanced low-light cameras, pose some competitive pressure, particularly in civilian applications. End-user trends, especially the increasing adoption of night vision technology in surveillance and security, are key growth drivers.
Mergers and acquisitions (M&A) activity has been moderate in recent years. The number of M&A deals within the industry averaged approximately xx per year between 2019 and 2024. These deals frequently involve smaller, specialized companies being acquired by larger players to expand their product portfolios or gain access to specific technologies.
- Market Concentration: Moderately concentrated, with top 3 players holding xx% market share (2025).
- Innovation: Focus on thermal imaging, image intensification, and sensor fusion.
- Regulations: Significant impact, especially in military and defense applications.
- Substitute Products: Enhanced low-light cameras pose some competition.
- End-User Trends: Increasing adoption in surveillance and security.
- M&A Activity: Average of xx deals annually (2019-2024).
Night Vision Devices Industry Insights & Trends
The Night Vision Devices market is experiencing robust growth, driven by several factors. The increasing demand for enhanced security and surveillance systems, particularly in both civilian and military sectors, is a primary catalyst. Technological advancements, such as the development of higher-resolution thermal imagers and improved image intensification technologies, are contributing to market expansion. Furthermore, the growing adoption of night vision devices in diverse applications, including wildlife observation, navigation, and industrial inspections, is fueling market growth. The market is also witnessing increased integration of night vision technologies with other advanced systems, such as augmented reality (AR) and artificial intelligence (AI), creating new opportunities and enhancing functionality.
Consumer behavior is evolving, with a shift towards smaller, lighter, and more user-friendly devices, along with increased demand for enhanced features like improved image clarity and longer battery life. This trend is influencing product design and innovation.
The global night vision devices market size was valued at approximately xx Million USD in 2024, and is expected to reach xx Million USD by 2033, exhibiting a substantial compound annual growth rate (CAGR) of xx% during the forecast period.
Key Markets & Segments Leading Night Vision Devices Industry
The North American region holds the dominant position in the global night vision devices market, driven by strong military spending and the presence of major manufacturers. Europe and Asia-Pacific also represent significant markets, with growth fueled by increasing investments in security and surveillance infrastructure and expanding applications in other sectors.
By Type: Goggles and Binoculars currently holds the largest market share, driven by their widespread use in military and civilian applications. However, Rifle Scopes are experiencing significant growth, particularly in the sporting and hunting markets.
By Technology: Thermal Imaging is currently the leading technology, due to its versatility and effectiveness in various environments. Image Intensifier technology maintains a strong presence, especially in military applications where high resolution and low-light performance are crucial.
By Application: The Military and Defense segment dominates the market, owing to high demand for night vision capabilities in armed forces operations. However, the Surveillance and Wildlife Spotting and Conservation segments are also witnessing significant growth.
- Drivers (Regional):
- North America: High military spending, presence of major manufacturers.
- Europe: Investments in security and surveillance.
- Asia-Pacific: Expanding applications across various sectors.
- Dominance Analysis:
- By Type: Goggles and Binoculars, followed by Rifle Scopes.
- By Technology: Thermal Imaging, with Image Intensifier remaining significant.
- By Application: Military and Defense, followed by Surveillance and Wildlife Spotting & Conservation.
Night Vision Devices Industry Product Developments
Recent product innovations include the integration of augmented reality (AR) features into night vision goggles, allowing for overlaying of digital information onto the user's view. This feature significantly enhances situational awareness. Advances in thermal imaging technology are resulting in higher resolution, improved image clarity, and more compact and lightweight devices. The incorporation of advanced sensor fusion technologies is combining thermal and visible light imagery to provide a comprehensive view. These improvements offer a significant competitive edge to manufacturers, enhancing product appeal and driving market growth.
Challenges in the Night Vision Devices Industry Market
The Night Vision Devices industry faces several challenges. Stringent regulatory compliance requirements, particularly for military applications, can increase development costs and timelines. Supply chain disruptions and fluctuating prices of raw materials, particularly specialized components, can impact profitability. Intense competition from established players and the emergence of new entrants pose considerable challenges, requiring manufacturers to continually innovate and differentiate their products to maintain market share. This results in a xx Million USD estimated annual loss in revenue to these factors.
Forces Driving Night Vision Devices Industry Growth
Several factors are driving market growth. Advancements in sensor technology, particularly in thermal imaging and image intensification, are delivering enhanced performance and capabilities. Growing demand for enhanced security and surveillance systems in both civilian and military applications is pushing market expansion. Favorable government regulations in several key markets are also encouraging industry development. The increasing adoption of night vision devices in diverse industries, from law enforcement to wildlife conservation, broadens the market potential.
Long-Term Growth Catalysts in the Night Vision Devices Industry
Long-term growth will be fueled by continuous innovation in sensor technology and the integration of AI and machine learning to improve image processing and enhance situational awareness. Strategic partnerships and collaborations between manufacturers and technology providers are expected to accelerate the development of next-generation products. Expansion into new and emerging markets, particularly in developing countries with increasing demand for security and surveillance systems, will drive long-term growth.
Emerging Opportunities in Night Vision Devices Industry
The integration of night vision technology with drones and other unmanned aerial vehicles (UAVs) presents significant opportunities. The growing adoption of night vision devices in the industrial sector, for tasks such as inspections and maintenance, is another key area of growth. Miniaturization of devices and the development of more energy-efficient technologies will create new market segments and opportunities. Increased demand for wearable night vision solutions will fuel innovation.
Leading Players in the Night Vision Devices Industry Sector
- L3Harris Technologies Inc
- TACTICAL NIGHT VISION COMPANY
- Exosens
- Raytheon Technologies Corporation
- Tak technologies private Limited
- Satir
- nivisys LLC
- Excelitas Technologies Corp
- sharp Corporation
- Elibit Systems Ltd
- BAE Systems PLC
- EOTECH LLC
- Thales Group SA
- Opgal Optronic Industries Ltd
- Apresys International Inc
- Luna Optics Inc
- Panasonic Holding Corporation
- American Technologies Network Corp
- Bushnell Inc
- Teledyne FLIR LLC
Key Milestones in Night Vision Devices Industry Industry
- November 2023: Night Vision LLC (Elbit Systems of America) secures a USD 500 Million contract from the US Department of Defense for SBNVG systems.
- October 2023: Thermoteknix Systems launches the Fused Night Vision Goggle with Augmented Reality (FNVG-AR).
Strategic Outlook for Night Vision Devices Industry Market
The Night Vision Devices market is poised for continued strong growth, driven by technological advancements, increasing demand across diverse applications, and favorable government support. Strategic opportunities exist for companies that can innovate, develop superior products, and effectively penetrate new markets. Focus on miniaturization, energy efficiency, and integration with other advanced technologies will be key to success. The market’s future looks bright, with substantial potential for expansion across both established and emerging applications.
Night Vision Devices Industry Segmentation
-
1. Type
- 1.1. Camera
- 1.2. Goggles
- 1.3. Monoculars and Binoculars
- 1.4. Rifle Scope
- 1.5. Other Types
-
2. Technology
- 2.1. Thermal Imaging
- 2.2. Image Intensifier
- 2.3. Infrared Illumination
- 2.4. Other Technologies
-
3. Application
- 3.1. Military and Defense
- 3.2. Wildlife Spotting and Conservation
- 3.3. Surveillance
- 3.4. Navigation
- 3.5. Other Applications
Night Vision Devices Industry Segmentation By Geography
- 1. North America
- 2. Europe
- 3. Asia Pacific
- 4. Latin America
- 5. Middle East and Africa

Night Vision Devices Industry REPORT HIGHLIGHTS
| Aspects | Details |
|---|---|
| Study Period | 2019-2033 |
| Base Year | 2024 |
| Estimated Year | 2025 |
| Forecast Period | 2025-2033 |
| Historical Period | 2019-2024 |
| Growth Rate | CAGR of 7.97% from 2019-2033 |
| Segmentation |
|
Table of Contents
- 1. Introduction
- 1.1. Research Scope
- 1.2. Market Segmentation
- 1.3. Research Methodology
- 1.4. Definitions and Assumptions
- 2. Executive Summary
- 2.1. Introduction
- 3. Market Dynamics
- 3.1. Introduction
- 3.2. Market Drivers
- 3.2.1. Increasing Military Expenditure; Increasing Adoption from Law Enforcement
- 3.3. Market Restrains
- 3.3.1. High Costs Associated with Maintenance
- 3.4. Market Trends
- 3.4.1. Surveillance Applications to Hold Significant Share
- 4. Market Factor Analysis
- 4.1. Porters Five Forces
- 4.2. Supply/Value Chain
- 4.3. PESTEL analysis
- 4.4. Market Entropy
- 4.5. Patent/Trademark Analysis
- 5. Global Night Vision Devices Industry Analysis, Insights and Forecast, 2019-2031
- 5.1. Market Analysis, Insights and Forecast - by Type
- 5.1.1. Camera
- 5.1.2. Goggles
- 5.1.3. Monoculars and Binoculars
- 5.1.4. Rifle Scope
- 5.1.5. Other Types
- 5.2. Market Analysis, Insights and Forecast - by Technology
- 5.2.1. Thermal Imaging
- 5.2.2. Image Intensifier
- 5.2.3. Infrared Illumination
- 5.2.4. Other Technologies
- 5.3. Market Analysis, Insights and Forecast - by Application
- 5.3.1. Military and Defense
- 5.3.2. Wildlife Spotting and Conservation
- 5.3.3. Surveillance
- 5.3.4. Navigation
- 5.3.5. Other Applications
- 5.4. Market Analysis, Insights and Forecast - by Region
- 5.4.1. North America
- 5.4.2. Europe
- 5.4.3. Asia Pacific
- 5.4.4. Latin America
- 5.4.5. Middle East and Africa
- 5.1. Market Analysis, Insights and Forecast - by Type
- 6. North America Night Vision Devices Industry Analysis, Insights and Forecast, 2019-2031
- 6.1. Market Analysis, Insights and Forecast - by Type
- 6.1.1. Camera
- 6.1.2. Goggles
- 6.1.3. Monoculars and Binoculars
- 6.1.4. Rifle Scope
- 6.1.5. Other Types
- 6.2. Market Analysis, Insights and Forecast - by Technology
- 6.2.1. Thermal Imaging
- 6.2.2. Image Intensifier
- 6.2.3. Infrared Illumination
- 6.2.4. Other Technologies
- 6.3. Market Analysis, Insights and Forecast - by Application
- 6.3.1. Military and Defense
- 6.3.2. Wildlife Spotting and Conservation
- 6.3.3. Surveillance
- 6.3.4. Navigation
- 6.3.5. Other Applications
- 6.1. Market Analysis, Insights and Forecast - by Type
- 7. Europe Night Vision Devices Industry Analysis, Insights and Forecast, 2019-2031
- 7.1. Market Analysis, Insights and Forecast - by Type
- 7.1.1. Camera
- 7.1.2. Goggles
- 7.1.3. Monoculars and Binoculars
- 7.1.4. Rifle Scope
- 7.1.5. Other Types
- 7.2. Market Analysis, Insights and Forecast - by Technology
- 7.2.1. Thermal Imaging
- 7.2.2. Image Intensifier
- 7.2.3. Infrared Illumination
- 7.2.4. Other Technologies
- 7.3. Market Analysis, Insights and Forecast - by Application
- 7.3.1. Military and Defense
- 7.3.2. Wildlife Spotting and Conservation
- 7.3.3. Surveillance
- 7.3.4. Navigation
- 7.3.5. Other Applications
- 7.1. Market Analysis, Insights and Forecast - by Type
- 8. Asia Pacific Night Vision Devices Industry Analysis, Insights and Forecast, 2019-2031
- 8.1. Market Analysis, Insights and Forecast - by Type
- 8.1.1. Camera
- 8.1.2. Goggles
- 8.1.3. Monoculars and Binoculars
- 8.1.4. Rifle Scope
- 8.1.5. Other Types
- 8.2. Market Analysis, Insights and Forecast - by Technology
- 8.2.1. Thermal Imaging
- 8.2.2. Image Intensifier
- 8.2.3. Infrared Illumination
- 8.2.4. Other Technologies
- 8.3. Market Analysis, Insights and Forecast - by Application
- 8.3.1. Military and Defense
- 8.3.2. Wildlife Spotting and Conservation
- 8.3.3. Surveillance
- 8.3.4. Navigation
- 8.3.5. Other Applications
- 8.1. Market Analysis, Insights and Forecast - by Type
- 9. Latin America Night Vision Devices Industry Analysis, Insights and Forecast, 2019-2031
- 9.1. Market Analysis, Insights and Forecast - by Type
- 9.1.1. Camera
- 9.1.2. Goggles
- 9.1.3. Monoculars and Binoculars
- 9.1.4. Rifle Scope
- 9.1.5. Other Types
- 9.2. Market Analysis, Insights and Forecast - by Technology
- 9.2.1. Thermal Imaging
- 9.2.2. Image Intensifier
- 9.2.3. Infrared Illumination
- 9.2.4. Other Technologies
- 9.3. Market Analysis, Insights and Forecast - by Application
- 9.3.1. Military and Defense
- 9.3.2. Wildlife Spotting and Conservation
- 9.3.3. Surveillance
- 9.3.4. Navigation
- 9.3.5. Other Applications
- 9.1. Market Analysis, Insights and Forecast - by Type
- 10. Middle East and Africa Night Vision Devices Industry Analysis, Insights and Forecast, 2019-2031
- 10.1. Market Analysis, Insights and Forecast - by Type
- 10.1.1. Camera
- 10.1.2. Goggles
- 10.1.3. Monoculars and Binoculars
- 10.1.4. Rifle Scope
- 10.1.5. Other Types
- 10.2. Market Analysis, Insights and Forecast - by Technology
- 10.2.1. Thermal Imaging
- 10.2.2. Image Intensifier
- 10.2.3. Infrared Illumination
- 10.2.4. Other Technologies
- 10.3. Market Analysis, Insights and Forecast - by Application
- 10.3.1. Military and Defense
- 10.3.2. Wildlife Spotting and Conservation
- 10.3.3. Surveillance
- 10.3.4. Navigation
- 10.3.5. Other Applications
- 10.1. Market Analysis, Insights and Forecast - by Type
- 11. North America Night Vision Devices Industry Analysis, Insights and Forecast, 2019-2031
- 11.1. Market Analysis, Insights and Forecast - By Country/Sub-region
- 11.1.1.
- 12. Europe Night Vision Devices Industry Analysis, Insights and Forecast, 2019-2031
- 12.1. Market Analysis, Insights and Forecast - By Country/Sub-region
- 12.1.1.
- 13. Asia Pacific Night Vision Devices Industry Analysis, Insights and Forecast, 2019-2031
- 13.1. Market Analysis, Insights and Forecast - By Country/Sub-region
- 13.1.1.
- 14. Latin America Night Vision Devices Industry Analysis, Insights and Forecast, 2019-2031
- 14.1. Market Analysis, Insights and Forecast - By Country/Sub-region
- 14.1.1.
- 15. Middle East and Africa Night Vision Devices Industry Analysis, Insights and Forecast, 2019-2031
- 15.1. Market Analysis, Insights and Forecast - By Country/Sub-region
- 15.1.1.
- 16. Competitive Analysis
- 16.1. Global Market Share Analysis 2024
- 16.2. Company Profiles
- 16.2.1 L3Harris Technologies Inc
- 16.2.1.1. Overview
- 16.2.1.2. Products
- 16.2.1.3. SWOT Analysis
- 16.2.1.4. Recent Developments
- 16.2.1.5. Financials (Based on Availability)
- 16.2.2 TACTICAL NIGHT VISION COMPANY
- 16.2.2.1. Overview
- 16.2.2.2. Products
- 16.2.2.3. SWOT Analysis
- 16.2.2.4. Recent Developments
- 16.2.2.5. Financials (Based on Availability)
- 16.2.3 Exosens
- 16.2.3.1. Overview
- 16.2.3.2. Products
- 16.2.3.3. SWOT Analysis
- 16.2.3.4. Recent Developments
- 16.2.3.5. Financials (Based on Availability)
- 16.2.4 Raytheon Technologies Corporation
- 16.2.4.1. Overview
- 16.2.4.2. Products
- 16.2.4.3. SWOT Analysis
- 16.2.4.4. Recent Developments
- 16.2.4.5. Financials (Based on Availability)
- 16.2.5 Tak technologies private Limited
- 16.2.5.1. Overview
- 16.2.5.2. Products
- 16.2.5.3. SWOT Analysis
- 16.2.5.4. Recent Developments
- 16.2.5.5. Financials (Based on Availability)
- 16.2.6 Satir
- 16.2.6.1. Overview
- 16.2.6.2. Products
- 16.2.6.3. SWOT Analysis
- 16.2.6.4. Recent Developments
- 16.2.6.5. Financials (Based on Availability)
- 16.2.7 nivisys LLC
- 16.2.7.1. Overview
- 16.2.7.2. Products
- 16.2.7.3. SWOT Analysis
- 16.2.7.4. Recent Developments
- 16.2.7.5. Financials (Based on Availability)
- 16.2.8 Excelitas Technologies Corp
- 16.2.8.1. Overview
- 16.2.8.2. Products
- 16.2.8.3. SWOT Analysis
- 16.2.8.4. Recent Developments
- 16.2.8.5. Financials (Based on Availability)
- 16.2.9 sharp Corporation
- 16.2.9.1. Overview
- 16.2.9.2. Products
- 16.2.9.3. SWOT Analysis
- 16.2.9.4. Recent Developments
- 16.2.9.5. Financials (Based on Availability)
- 16.2.10 Elibit Systems Ltd
- 16.2.10.1. Overview
- 16.2.10.2. Products
- 16.2.10.3. SWOT Analysis
- 16.2.10.4. Recent Developments
- 16.2.10.5. Financials (Based on Availability)
- 16.2.11 BAE Systems PLC
- 16.2.11.1. Overview
- 16.2.11.2. Products
- 16.2.11.3. SWOT Analysis
- 16.2.11.4. Recent Developments
- 16.2.11.5. Financials (Based on Availability)
- 16.2.12 EOTECH LLC
- 16.2.12.1. Overview
- 16.2.12.2. Products
- 16.2.12.3. SWOT Analysis
- 16.2.12.4. Recent Developments
- 16.2.12.5. Financials (Based on Availability)
- 16.2.13 Thales Group SA
- 16.2.13.1. Overview
- 16.2.13.2. Products
- 16.2.13.3. SWOT Analysis
- 16.2.13.4. Recent Developments
- 16.2.13.5. Financials (Based on Availability)
- 16.2.14 Opgal Optronic Industries Ltd
- 16.2.14.1. Overview
- 16.2.14.2. Products
- 16.2.14.3. SWOT Analysis
- 16.2.14.4. Recent Developments
- 16.2.14.5. Financials (Based on Availability)
- 16.2.15 Apresys International Inc
- 16.2.15.1. Overview
- 16.2.15.2. Products
- 16.2.15.3. SWOT Analysis
- 16.2.15.4. Recent Developments
- 16.2.15.5. Financials (Based on Availability)
- 16.2.16 Luna Optics Inc
- 16.2.16.1. Overview
- 16.2.16.2. Products
- 16.2.16.3. SWOT Analysis
- 16.2.16.4. Recent Developments
- 16.2.16.5. Financials (Based on Availability)
- 16.2.17 Panasonic Holding Corporation
- 16.2.17.1. Overview
- 16.2.17.2. Products
- 16.2.17.3. SWOT Analysis
- 16.2.17.4. Recent Developments
- 16.2.17.5. Financials (Based on Availability)
- 16.2.18 American Technologies Network Corp
- 16.2.18.1. Overview
- 16.2.18.2. Products
- 16.2.18.3. SWOT Analysis
- 16.2.18.4. Recent Developments
- 16.2.18.5. Financials (Based on Availability)
- 16.2.19 Bushnell Inc
- 16.2.19.1. Overview
- 16.2.19.2. Products
- 16.2.19.3. SWOT Analysis
- 16.2.19.4. Recent Developments
- 16.2.19.5. Financials (Based on Availability)
- 16.2.20 Teledyne FLIR LLC
- 16.2.20.1. Overview
- 16.2.20.2. Products
- 16.2.20.3. SWOT Analysis
- 16.2.20.4. Recent Developments
- 16.2.20.5. Financials (Based on Availability)
- 16.2.1 L3Harris Technologies Inc
List of Figures
- Figure 1: Global Night Vision Devices Industry Revenue Breakdown (Million, %) by Region 2024 & 2032
- Figure 2: North America Night Vision Devices Industry Revenue (Million), by Country 2024 & 2032
- Figure 3: North America Night Vision Devices Industry Revenue Share (%), by Country 2024 & 2032
- Figure 4: Europe Night Vision Devices Industry Revenue (Million), by Country 2024 & 2032
- Figure 5: Europe Night Vision Devices Industry Revenue Share (%), by Country 2024 & 2032
- Figure 6: Asia Pacific Night Vision Devices Industry Revenue (Million), by Country 2024 & 2032
- Figure 7: Asia Pacific Night Vision Devices Industry Revenue Share (%), by Country 2024 & 2032
- Figure 8: Latin America Night Vision Devices Industry Revenue (Million), by Country 2024 & 2032
- Figure 9: Latin America Night Vision Devices Industry Revenue Share (%), by Country 2024 & 2032
- Figure 10: Middle East and Africa Night Vision Devices Industry Revenue (Million), by Country 2024 & 2032
- Figure 11: Middle East and Africa Night Vision Devices Industry Revenue Share (%), by Country 2024 & 2032
- Figure 12: North America Night Vision Devices Industry Revenue (Million), by Type 2024 & 2032
- Figure 13: North America Night Vision Devices Industry Revenue Share (%), by Type 2024 & 2032
- Figure 14: North America Night Vision Devices Industry Revenue (Million), by Technology 2024 & 2032
- Figure 15: North America Night Vision Devices Industry Revenue Share (%), by Technology 2024 & 2032
- Figure 16: North America Night Vision Devices Industry Revenue (Million), by Application 2024 & 2032
- Figure 17: North America Night Vision Devices Industry Revenue Share (%), by Application 2024 & 2032
- Figure 18: North America Night Vision Devices Industry Revenue (Million), by Country 2024 & 2032
- Figure 19: North America Night Vision Devices Industry Revenue Share (%), by Country 2024 & 2032
- Figure 20: Europe Night Vision Devices Industry Revenue (Million), by Type 2024 & 2032
- Figure 21: Europe Night Vision Devices Industry Revenue Share (%), by Type 2024 & 2032
- Figure 22: Europe Night Vision Devices Industry Revenue (Million), by Technology 2024 & 2032
- Figure 23: Europe Night Vision Devices Industry Revenue Share (%), by Technology 2024 & 2032
- Figure 24: Europe Night Vision Devices Industry Revenue (Million), by Application 2024 & 2032
- Figure 25: Europe Night Vision Devices Industry Revenue Share (%), by Application 2024 & 2032
- Figure 26: Europe Night Vision Devices Industry Revenue (Million), by Country 2024 & 2032
- Figure 27: Europe Night Vision Devices Industry Revenue Share (%), by Country 2024 & 2032
- Figure 28: Asia Pacific Night Vision Devices Industry Revenue (Million), by Type 2024 & 2032
- Figure 29: Asia Pacific Night Vision Devices Industry Revenue Share (%), by Type 2024 & 2032
- Figure 30: Asia Pacific Night Vision Devices Industry Revenue (Million), by Technology 2024 & 2032
- Figure 31: Asia Pacific Night Vision Devices Industry Revenue Share (%), by Technology 2024 & 2032
- Figure 32: Asia Pacific Night Vision Devices Industry Revenue (Million), by Application 2024 & 2032
- Figure 33: Asia Pacific Night Vision Devices Industry Revenue Share (%), by Application 2024 & 2032
- Figure 34: Asia Pacific Night Vision Devices Industry Revenue (Million), by Country 2024 & 2032
- Figure 35: Asia Pacific Night Vision Devices Industry Revenue Share (%), by Country 2024 & 2032
- Figure 36: Latin America Night Vision Devices Industry Revenue (Million), by Type 2024 & 2032
- Figure 37: Latin America Night Vision Devices Industry Revenue Share (%), by Type 2024 & 2032
- Figure 38: Latin America Night Vision Devices Industry Revenue (Million), by Technology 2024 & 2032
- Figure 39: Latin America Night Vision Devices Industry Revenue Share (%), by Technology 2024 & 2032
- Figure 40: Latin America Night Vision Devices Industry Revenue (Million), by Application 2024 & 2032
- Figure 41: Latin America Night Vision Devices Industry Revenue Share (%), by Application 2024 & 2032
- Figure 42: Latin America Night Vision Devices Industry Revenue (Million), by Country 2024 & 2032
- Figure 43: Latin America Night Vision Devices Industry Revenue Share (%), by Country 2024 & 2032
- Figure 44: Middle East and Africa Night Vision Devices Industry Revenue (Million), by Type 2024 & 2032
- Figure 45: Middle East and Africa Night Vision Devices Industry Revenue Share (%), by Type 2024 & 2032
- Figure 46: Middle East and Africa Night Vision Devices Industry Revenue (Million), by Technology 2024 & 2032
- Figure 47: Middle East and Africa Night Vision Devices Industry Revenue Share (%), by Technology 2024 & 2032
- Figure 48: Middle East and Africa Night Vision Devices Industry Revenue (Million), by Application 2024 & 2032
- Figure 49: Middle East and Africa Night Vision Devices Industry Revenue Share (%), by Application 2024 & 2032
- Figure 50: Middle East and Africa Night Vision Devices Industry Revenue (Million), by Country 2024 & 2032
- Figure 51: Middle East and Africa Night Vision Devices Industry Revenue Share (%), by Country 2024 & 2032
List of Tables
- Table 1: Global Night Vision Devices Industry Revenue Million Forecast, by Region 2019 & 2032
- Table 2: Global Night Vision Devices Industry Revenue Million Forecast, by Type 2019 & 2032
- Table 3: Global Night Vision Devices Industry Revenue Million Forecast, by Technology 2019 & 2032
- Table 4: Global Night Vision Devices Industry Revenue Million Forecast, by Application 2019 & 2032
- Table 5: Global Night Vision Devices Industry Revenue Million Forecast, by Region 2019 & 2032
- Table 6: Global Night Vision Devices Industry Revenue Million Forecast, by Country 2019 & 2032
- Table 7: Night Vision Devices Industry Revenue (Million) Forecast, by Application 2019 & 2032
- Table 8: Global Night Vision Devices Industry Revenue Million Forecast, by Country 2019 & 2032
- Table 9: Night Vision Devices Industry Revenue (Million) Forecast, by Application 2019 & 2032
- Table 10: Global Night Vision Devices Industry Revenue Million Forecast, by Country 2019 & 2032
- Table 11: Night Vision Devices Industry Revenue (Million) Forecast, by Application 2019 & 2032
- Table 12: Global Night Vision Devices Industry Revenue Million Forecast, by Country 2019 & 2032
- Table 13: Night Vision Devices Industry Revenue (Million) Forecast, by Application 2019 & 2032
- Table 14: Global Night Vision Devices Industry Revenue Million Forecast, by Country 2019 & 2032
- Table 15: Night Vision Devices Industry Revenue (Million) Forecast, by Application 2019 & 2032
- Table 16: Global Night Vision Devices Industry Revenue Million Forecast, by Type 2019 & 2032
- Table 17: Global Night Vision Devices Industry Revenue Million Forecast, by Technology 2019 & 2032
- Table 18: Global Night Vision Devices Industry Revenue Million Forecast, by Application 2019 & 2032
- Table 19: Global Night Vision Devices Industry Revenue Million Forecast, by Country 2019 & 2032
- Table 20: Global Night Vision Devices Industry Revenue Million Forecast, by Type 2019 & 2032
- Table 21: Global Night Vision Devices Industry Revenue Million Forecast, by Technology 2019 & 2032
- Table 22: Global Night Vision Devices Industry Revenue Million Forecast, by Application 2019 & 2032
- Table 23: Global Night Vision Devices Industry Revenue Million Forecast, by Country 2019 & 2032
- Table 24: Global Night Vision Devices Industry Revenue Million Forecast, by Type 2019 & 2032
- Table 25: Global Night Vision Devices Industry Revenue Million Forecast, by Technology 2019 & 2032
- Table 26: Global Night Vision Devices Industry Revenue Million Forecast, by Application 2019 & 2032
- Table 27: Global Night Vision Devices Industry Revenue Million Forecast, by Country 2019 & 2032
- Table 28: Global Night Vision Devices Industry Revenue Million Forecast, by Type 2019 & 2032
- Table 29: Global Night Vision Devices Industry Revenue Million Forecast, by Technology 2019 & 2032
- Table 30: Global Night Vision Devices Industry Revenue Million Forecast, by Application 2019 & 2032
- Table 31: Global Night Vision Devices Industry Revenue Million Forecast, by Country 2019 & 2032
- Table 32: Global Night Vision Devices Industry Revenue Million Forecast, by Type 2019 & 2032
- Table 33: Global Night Vision Devices Industry Revenue Million Forecast, by Technology 2019 & 2032
- Table 34: Global Night Vision Devices Industry Revenue Million Forecast, by Application 2019 & 2032
- Table 35: Global Night Vision Devices Industry Revenue Million Forecast, by Country 2019 & 2032
Frequently Asked Questions
1. What is the projected Compound Annual Growth Rate (CAGR) of the Night Vision Devices Industry?
The projected CAGR is approximately 7.97%.
2. Which companies are prominent players in the Night Vision Devices Industry?
Key companies in the market include L3Harris Technologies Inc, TACTICAL NIGHT VISION COMPANY, Exosens, Raytheon Technologies Corporation, Tak technologies private Limited, Satir, nivisys LLC, Excelitas Technologies Corp, sharp Corporation, Elibit Systems Ltd, BAE Systems PLC, EOTECH LLC, Thales Group SA, Opgal Optronic Industries Ltd, Apresys International Inc, Luna Optics Inc, Panasonic Holding Corporation, American Technologies Network Corp, Bushnell Inc, Teledyne FLIR LLC.
3. What are the main segments of the Night Vision Devices Industry?
The market segments include Type, Technology, Application.
4. Can you provide details about the market size?
The market size is estimated to be USD 8.68 Million as of 2022.
5. What are some drivers contributing to market growth?
Increasing Military Expenditure; Increasing Adoption from Law Enforcement.
6. What are the notable trends driving market growth?
Surveillance Applications to Hold Significant Share.
7. Are there any restraints impacting market growth?
High Costs Associated with Maintenance.
8. Can you provide examples of recent developments in the market?
November 2023 - Night Vision LLC, a subsidiary of Elbit Systems of America, announced that it secured USD 500 million from the US Department of Defense to enhance the US Marine Corps’ efficiency with the supply of Squad Binocular Night Vision Goggle (SBNVG) systems. The contract is expected to be completed by 2028, aiming to equip the Marines with technology for nighttime situational awareness, with work to be executed in Roanoke, Virginia.
9. What pricing options are available for accessing the report?
Pricing options include single-user, multi-user, and enterprise licenses priced at USD 4750, USD 5250, and USD 8750 respectively.
10. Is the market size provided in terms of value or volume?
The market size is provided in terms of value, measured in Million.
11. Are there any specific market keywords associated with the report?
Yes, the market keyword associated with the report is "Night Vision Devices Industry," which aids in identifying and referencing the specific market segment covered.
12. How do I determine which pricing option suits my needs best?
The pricing options vary based on user requirements and access needs. Individual users may opt for single-user licenses, while businesses requiring broader access may choose multi-user or enterprise licenses for cost-effective access to the report.
13. Are there any additional resources or data provided in the Night Vision Devices Industry report?
While the report offers comprehensive insights, it's advisable to review the specific contents or supplementary materials provided to ascertain if additional resources or data are available.
14. How can I stay updated on further developments or reports in the Night Vision Devices Industry?
To stay informed about further developments, trends, and reports in the Night Vision Devices Industry, consider subscribing to industry newsletters, following relevant companies and organizations, or regularly checking reputable industry news sources and publications.
Methodology
Step 1 - Identification of Relevant Samples Size from Population Database


Step 2 - Approaches for Defining Global Market Size (Value, Volume* & Price*)

Note*: In applicable scenarios
Step 3 - Data Sources
Primary Research
- Web Analytics
- Survey Reports
- Research Institute
- Latest Research Reports
- Opinion Leaders
Secondary Research
- Annual Reports
- White Paper
- Latest Press Release
- Industry Association
- Paid Database
- Investor Presentations

Step 4 - Data Triangulation
Involves using different sources of information in order to increase the validity of a study
These sources are likely to be stakeholders in a program - participants, other researchers, program staff, other community members, and so on.
Then we put all data in single framework & apply various statistical tools to find out the dynamic on the market.
During the analysis stage, feedback from the stakeholder groups would be compared to determine areas of agreement as well as areas of divergence
