

Key Insights
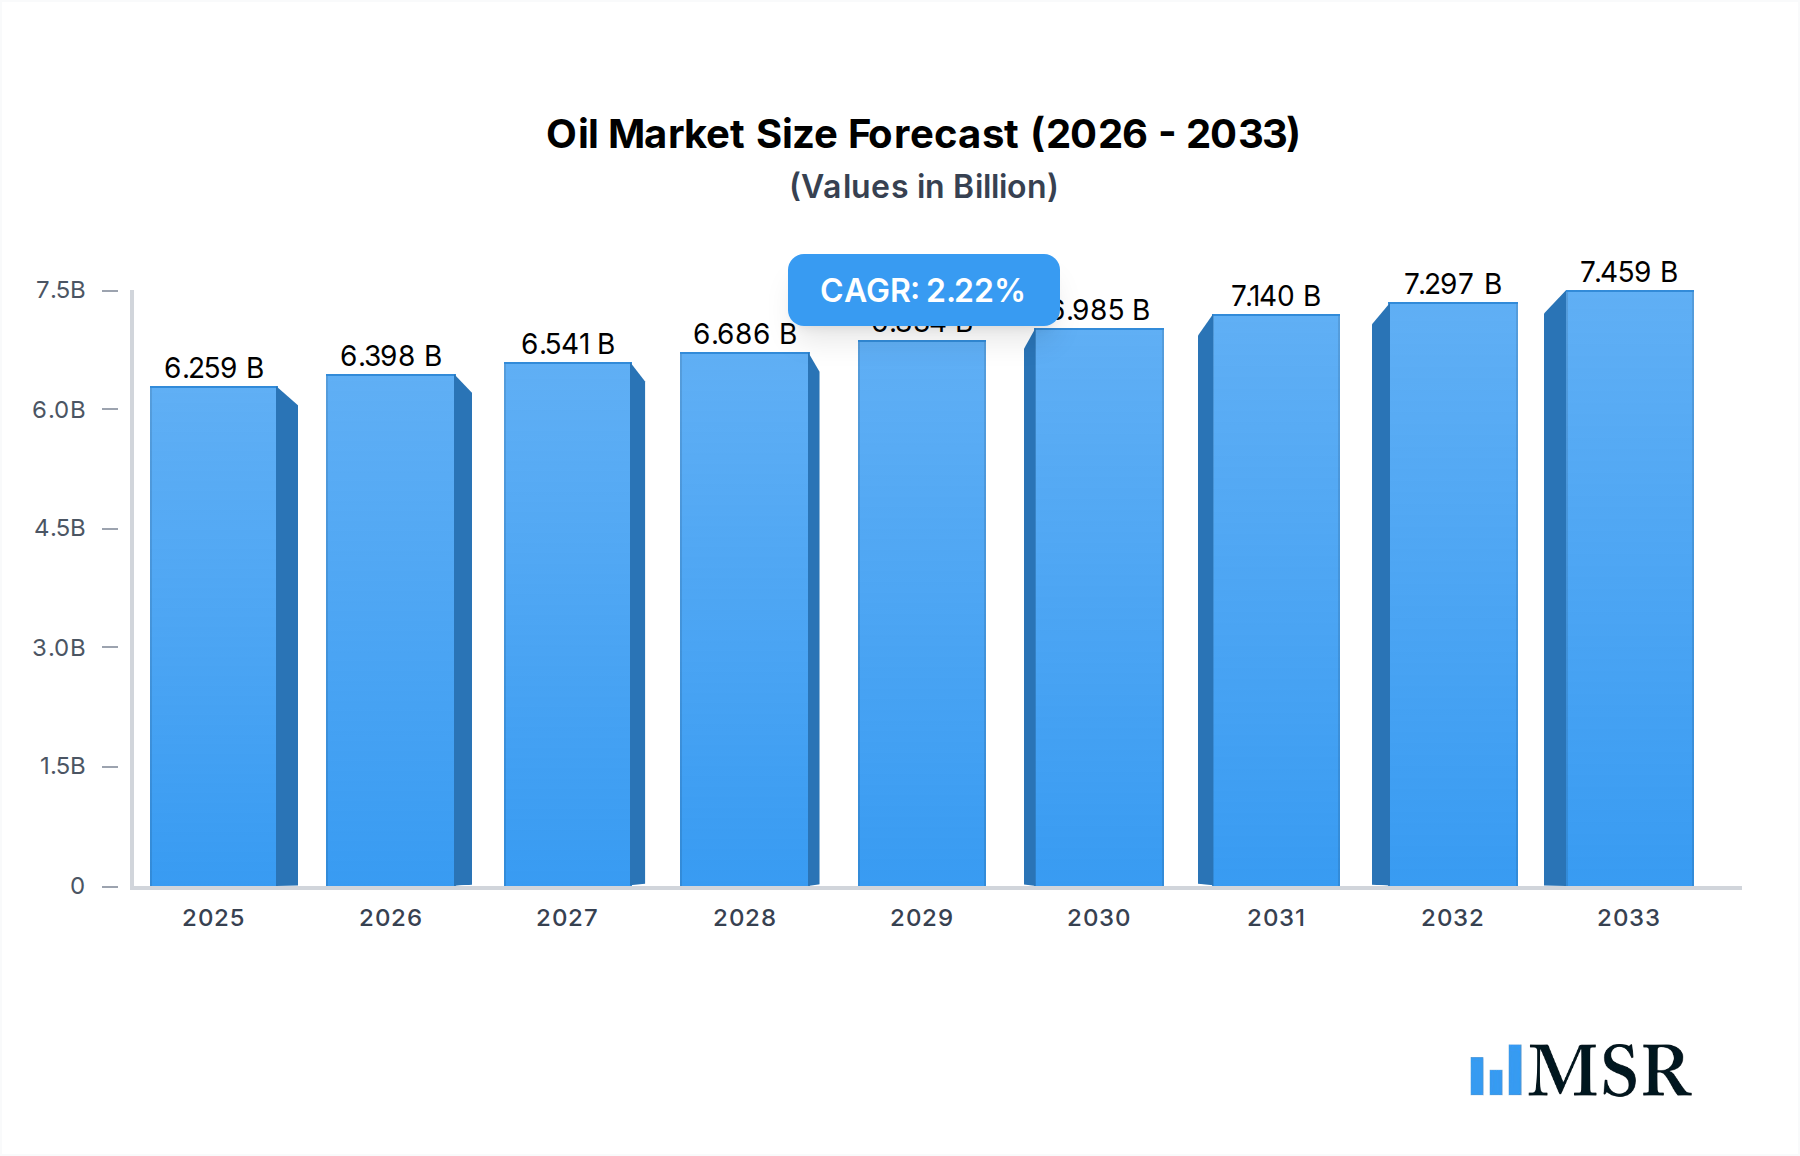
The Oil & Gas Processing Seals market is poised for steady growth, estimated at 6259.3 million USD in 2025, with a projected Compound Annual Growth Rate (CAGR) of 2.2% through 2033. This expansion is underpinned by the continuous demand for efficient and reliable sealing solutions across the upstream, midstream, and downstream sectors of the oil and gas industry. Key drivers for this market include the ongoing exploration and production activities, particularly in challenging environments requiring robust sealing technologies. The increasing emphasis on operational safety, environmental compliance, and the prevention of leaks further bolsters the demand for high-performance seals. The market is segmented by application into Crude Oil and Natural Gas, with both segments exhibiting consistent requirements for advanced sealing materials and designs. Furthermore, the types of seals, such as Single and Double seals, cater to diverse operational needs, from basic sealing to critical safety applications. The market's resilience is also supported by investments in aging infrastructure that necessitate seal replacements and upgrades to maintain operational integrity and efficiency.

Oil & Gas Processing Seals Market Size (In Billion)
The Oil & Gas Processing Seals market is characterized by significant innovation and a competitive landscape featuring established global players. Trends such as the development of advanced materials offering superior resistance to extreme temperatures, pressures, and corrosive chemicals are shaping product offerings. The integration of smart technologies for condition monitoring of seals is also emerging as a key trend, enabling predictive maintenance and reducing downtime. Geographically, North America and Europe currently represent significant markets due to extensive oil and gas infrastructure and stringent regulatory frameworks. However, the Asia Pacific region is expected to witness robust growth driven by increasing energy demand and expanding exploration activities. While the market benefits from steady demand, potential restraints include fluctuations in crude oil prices, which can impact overall investment in the oil and gas sector, and the increasing adoption of renewable energy sources, which could gradually influence the long-term demand dynamics for fossil fuels and their associated processing equipment. Nevertheless, the indispensable nature of seals in ensuring the safe and efficient operation of existing oil and gas facilities ensures a sustained market presence.
Oil & Gas Processing Seals Company Market Share
This in-depth report offers a definitive analysis of the global Oil & Gas Processing Seals Market, providing critical insights for stakeholders navigating this vital industrial sector. Delving into market dynamics, product innovations, key applications, and future trajectories, this report is your essential guide to understanding the forces shaping the demand for high-performance sealing solutions in crude oil and natural gas processing. Spanning a comprehensive study period of 2019 to 2033, with a base year of 2025 and a forecast period extending to 2033, this analysis provides actionable intelligence for strategic decision-making.
Oil & Gas Processing Seals Market Concentration & Dynamics
The Oil & Gas Processing Seals market exhibits a moderate to high concentration, with established players leveraging significant R&D investments and extensive distribution networks. Key innovators like Freudenberg Group, John Crane, and Flowserve Corporation consistently drive technological advancements, particularly in materials science and design for extreme conditions. The innovation ecosystem is characterized by collaborations between seal manufacturers and oil and gas operators, fostering the development of bespoke solutions. Regulatory frameworks play a crucial role, with stringent safety and environmental standards influencing material selection and seal design, impacting market share for compliant products. The threat of substitute products is relatively low due to the critical nature of sealing integrity in preventing leaks and ensuring operational safety, but advancements in non-traditional sealing methods are being monitored. End-user trends emphasize the demand for seals with extended service life, reduced maintenance requirements, and enhanced chemical resistance. M&A activities have been observed, with major players acquiring niche technology providers to expand their product portfolios and geographical reach. For instance, in the historical period 2019-2024, an estimated 25 M&A deal counts have been recorded, indicating a strategic consolidation phase.
Oil & Gas Processing Seals Industry Insights & Trends
The global Oil & Gas Processing Seals market size is projected to reach approximately USD 4,500 million by 2025, with a robust Compound Annual Growth Rate (CAGR) of 5.2% from 2025 to 2033. This growth is primarily propelled by the increasing global demand for energy, necessitating the expansion and optimization of upstream, midstream, and downstream oil and gas operations. Technological disruptions are at the forefront, with advancements in high-performance elastomers, advanced composite materials, and intelligent sensing technologies integrated into seals. These innovations are crucial for enhancing operational efficiency, reducing downtime, and improving safety in harsh and demanding environments. Evolving consumer behaviors within the oil and gas industry are shifting towards a greater emphasis on sustainability and lifecycle cost optimization. Operators are seeking sealing solutions that not only offer superior performance but also contribute to reduced environmental impact and lower total cost of ownership. The need for seals that can withstand extreme temperatures, high pressures, and corrosive media is intensifying, driving demand for advanced materials like perfluoroelastomers (FFKM) and specialized polymers. Furthermore, the increasing adoption of digitalization and automation in oil and gas facilities is creating opportunities for smart seals equipped with monitoring capabilities, enabling predictive maintenance and proactive issue resolution. The report will extensively analyze the impact of these trends on market segmentation, regional demand, and competitive strategies.
Key Markets & Segments Leading Oil & Gas Processing Seals
The Crude Oil segment, specifically in applications involving exploration, extraction, and refining, is a dominant force in the Oil & Gas Processing Seals market. This segment's leadership is underpinned by substantial global demand for refined petroleum products, driving continuous investment in oilfield infrastructure and processing facilities. Key drivers for the dominance of the Crude Oil segment include:
- Economic Growth: Rising global economies and increasing energy consumption directly fuel the demand for crude oil and its derivatives.
- Infrastructure Development: Ongoing investments in new oil fields, pipelines, and refineries worldwide necessitate a continuous supply of high-performance seals.
- Mature Production Fields: The need to optimize extraction from existing, mature oil fields often involves enhanced recovery techniques that require robust sealing solutions.
- Refining Capacity Expansion: Global efforts to increase refining capacities to meet diverse product demands further stimulate the market for processing seals.
In terms of seal types, Single seals are widely adopted in less critical applications or where redundancy is managed through other system designs. However, the growing emphasis on safety and environmental compliance is increasingly driving the adoption of Double seals in critical areas such as pumps and compressors handling volatile hydrocarbons. The Natural Gas segment is also a significant contributor, with expanding infrastructure for liquefaction (LNG) and transportation further bolstering the demand for specialized seals capable of withstanding cryogenic temperatures and high pressures. Regions with substantial crude oil production and refining activities, such as North America, the Middle East, and parts of Asia-Pacific, represent key markets. For instance, the United States, with its extensive shale oil and gas operations, is a major consumer of advanced oil and gas processing seals, contributing an estimated 30% of the global market share in 2025. Similarly, the Middle East's significant crude oil reserves and ongoing expansion projects ensure its continued prominence in this market.
Oil & Gas Processing Seals Product Developments
Product innovations in the Oil & Gas Processing Seals market are focused on enhancing performance, durability, and safety. Manufacturers are developing seals with superior resistance to aggressive chemicals, extreme temperatures (both high and low), and abrasive media commonly encountered in oil and gas processing. Advancements include the integration of novel composite materials, enhanced elastomer formulations (e.g., advanced FFKM compounds), and novel designs for reduced friction and improved sealing efficiency. These product developments are crucial for meeting the increasingly stringent operational demands and environmental regulations within the industry, offering a competitive edge to companies investing in R&D. The market relevance of these innovations is directly tied to their ability to extend seal lifespan, minimize leakage, and reduce maintenance intervals, thereby contributing to significant operational cost savings for end-users.
Challenges in the Oil & Gas Processing Seals Market
The Oil & Gas Processing Seals market faces several challenges. Regulatory hurdles, including evolving environmental protection laws and safety standards, necessitate continuous adaptation of product designs and materials, leading to increased R&D costs. Supply chain disruptions, exacerbated by geopolitical factors and material availability fluctuations, can impact lead times and component costs. For example, a 10% increase in raw material prices for specialized polymers could translate to a 5% rise in overall seal costs. Competitive pressures from both established and emerging players drive price sensitivity, while the need for highly specialized and often customized sealing solutions requires significant technical expertise and investment.
Forces Driving Oil & Gas Processing Seals Growth
Several key growth drivers are propelling the Oil & Gas Processing Seals market. The increasing global demand for energy, particularly from developing economies, is a primary catalyst, leading to expanded exploration, production, and refining activities. Technological advancements in seal materials and design, offering enhanced performance in extreme conditions, are crucial. For instance, the development of seals with improved chemical resistance can extend their service life by up to 20% in corrosive environments. Stringent safety and environmental regulations are also driving the adoption of higher-performing, more reliable sealing solutions to prevent leaks and emissions. Furthermore, the growth of the liquefied natural gas (LNG) sector, requiring specialized seals for cryogenic applications, presents a significant growth opportunity.
Challenges in the Oil & Gas Processing Seals Market
Long-term growth catalysts in the Oil & Gas Processing Seals market are centered around sustained innovation and strategic market expansion. The ongoing pursuit of enhanced operational efficiency and cost reduction by oil and gas operators will continue to drive demand for seals that offer superior longevity and reduced maintenance. Advancements in materials science, leading to seals capable of withstanding even more extreme temperatures, pressures, and corrosive substances, will be critical. Strategic partnerships and collaborations between seal manufacturers and major oil and gas companies will foster the co-development of next-generation sealing technologies tailored to specific operational challenges. Furthermore, the exploration and development of new oil and gas reserves, particularly in challenging offshore or Arctic environments, will create sustained demand for highly specialized and robust sealing solutions.
Emerging Opportunities in Oil & Gas Processing Seals
Emerging opportunities within the Oil & Gas Processing Seals market are driven by several key trends. The increasing focus on digitalization and the Industrial Internet of Things (IIoT) is paving the way for "smart" seals equipped with sensors for real-time monitoring of performance and condition, enabling predictive maintenance. This trend is expected to create a new sub-segment with an estimated growth potential of 15% annually. The expansion of renewable energy integration within oil and gas facilities, such as hydrogen production, will require seals capable of handling new types of media and operating conditions. Furthermore, the development of environmentally friendly and sustainable sealing materials is gaining traction, aligning with the industry's increasing emphasis on ESG (Environmental, Social, and Governance) factors. Exploration of new offshore frontiers and the need for seals in subsea applications also present significant growth avenues.
Leading Players in the Oil & Gas Processing Seals Sector
- Freudenberg Group
- John Crane
- Flowserve Corporation
- Parker Hannifin Corp
- Saint-Gobain
- Trelleborg AB
- Dupont
- Precision Polymer Engineering
- Techno Ad Ltd.
- M.Barnwell Services Limited
- Precision Associates, Inc.
- FTL Technology
- Aesseal PLC.
- Technetics Group
- Performance Sealing Inc.
- Ceetak Ltd.
- American High Performance Seals
Key Milestones in Oil & Gas Processing Seals Industry
- 2020 March: Freudenberg Group launches a new generation of high-performance FFKM seals for extreme chemical resistance.
- 2021 May: John Crane introduces advanced sensor integration into its mechanical seals for enhanced monitoring.
- 2022 February: Flowserve Corporation acquires a specialized composite sealing company, expanding its material capabilities.
- 2023 April: Parker Hannifin Corp announces a new line of seals designed for enhanced performance in LNG applications.
- 2024 January: Saint-Gobain invests in R&D for bio-based elastomers for sealing solutions.
Strategic Outlook for Oil & Gas Processing Seals Market
The strategic outlook for the Oil & Gas Processing Seals market is one of sustained growth, driven by the ongoing demand for energy and the imperative for operational excellence. Key growth accelerators include continued investment in R&D for advanced materials and smart sealing technologies, fostering stronger collaborations with oil and gas operators to co-create solutions, and strategically expanding market presence in emerging geographical regions with significant upstream and downstream development. The market is poised for further innovation, particularly in areas supporting the energy transition and enhancing environmental compliance, presenting substantial future market potential.
Oil & Gas Processing Seals Segmentation
-
1. Application
- 1.1. Crude Oil
- 1.2. Natural Gas
-
2. Types
- 2.1. Single
- 2.2. Double
Oil & Gas Processing Seals Segmentation By Geography
-
1. North America
- 1.1. United States
- 1.2. Canada
- 1.3. Mexico
-
2. South America
- 2.1. Brazil
- 2.2. Argentina
- 2.3. Rest of South America
-
3. Europe
- 3.1. United Kingdom
- 3.2. Germany
- 3.3. France
- 3.4. Italy
- 3.5. Spain
- 3.6. Russia
- 3.7. Benelux
- 3.8. Nordics
- 3.9. Rest of Europe
-
4. Middle East & Africa
- 4.1. Turkey
- 4.2. Israel
- 4.3. GCC
- 4.4. North Africa
- 4.5. South Africa
- 4.6. Rest of Middle East & Africa
-
5. Asia Pacific
- 5.1. China
- 5.2. India
- 5.3. Japan
- 5.4. South Korea
- 5.5. ASEAN
- 5.6. Oceania
- 5.7. Rest of Asia Pacific
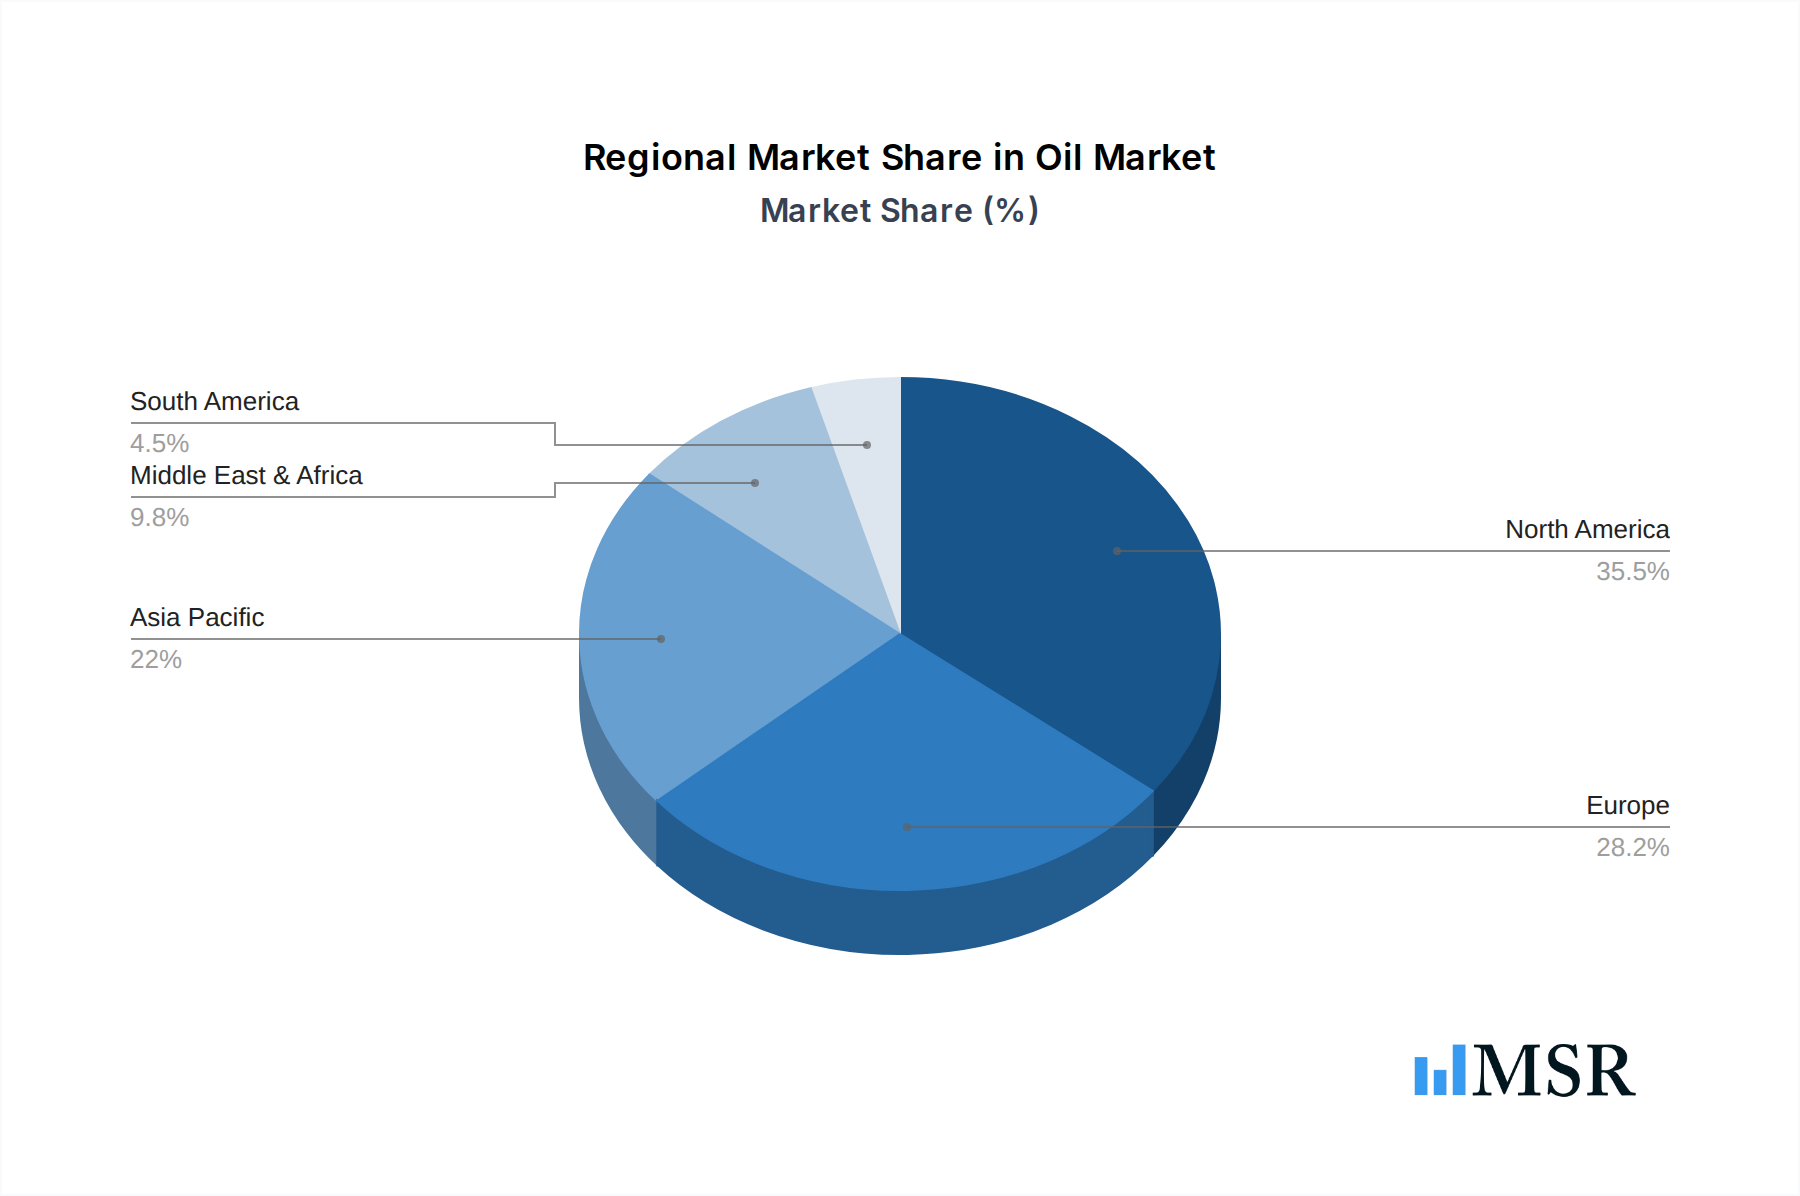
Oil & Gas Processing Seals Regional Market Share
Geographic Coverage of Oil & Gas Processing Seals
Oil & Gas Processing Seals REPORT HIGHLIGHTS
| Aspects | Details |
|---|---|
| Study Period | 2020-2034 |
| Base Year | 2025 |
| Estimated Year | 2026 |
| Forecast Period | 2026-2034 |
| Historical Period | 2020-2025 |
| Growth Rate | CAGR of 2.2% from 2020-2034 |
| Segmentation |
|
Table of Contents
- 1. Introduction
- 1.1. Research Scope
- 1.2. Market Segmentation
- 1.3. Research Methodology
- 1.4. Definitions and Assumptions
- 2. Executive Summary
- 2.1. Introduction
- 3. Market Dynamics
- 3.1. Introduction
- 3.2. Market Drivers
- 3.3. Market Restrains
- 3.4. Market Trends
- 4. Market Factor Analysis
- 4.1. Porters Five Forces
- 4.2. Supply/Value Chain
- 4.3. PESTEL analysis
- 4.4. Market Entropy
- 4.5. Patent/Trademark Analysis
- 5. Global Oil & Gas Processing Seals Analysis, Insights and Forecast, 2020-2032
- 5.1. Market Analysis, Insights and Forecast - by Application
- 5.1.1. Crude Oil
- 5.1.2. Natural Gas
- 5.2. Market Analysis, Insights and Forecast - by Types
- 5.2.1. Single
- 5.2.2. Double
- 5.3. Market Analysis, Insights and Forecast - by Region
- 5.3.1. North America
- 5.3.2. South America
- 5.3.3. Europe
- 5.3.4. Middle East & Africa
- 5.3.5. Asia Pacific
- 5.1. Market Analysis, Insights and Forecast - by Application
- 6. North America Oil & Gas Processing Seals Analysis, Insights and Forecast, 2020-2032
- 6.1. Market Analysis, Insights and Forecast - by Application
- 6.1.1. Crude Oil
- 6.1.2. Natural Gas
- 6.2. Market Analysis, Insights and Forecast - by Types
- 6.2.1. Single
- 6.2.2. Double
- 6.1. Market Analysis, Insights and Forecast - by Application
- 7. South America Oil & Gas Processing Seals Analysis, Insights and Forecast, 2020-2032
- 7.1. Market Analysis, Insights and Forecast - by Application
- 7.1.1. Crude Oil
- 7.1.2. Natural Gas
- 7.2. Market Analysis, Insights and Forecast - by Types
- 7.2.1. Single
- 7.2.2. Double
- 7.1. Market Analysis, Insights and Forecast - by Application
- 8. Europe Oil & Gas Processing Seals Analysis, Insights and Forecast, 2020-2032
- 8.1. Market Analysis, Insights and Forecast - by Application
- 8.1.1. Crude Oil
- 8.1.2. Natural Gas
- 8.2. Market Analysis, Insights and Forecast - by Types
- 8.2.1. Single
- 8.2.2. Double
- 8.1. Market Analysis, Insights and Forecast - by Application
- 9. Middle East & Africa Oil & Gas Processing Seals Analysis, Insights and Forecast, 2020-2032
- 9.1. Market Analysis, Insights and Forecast - by Application
- 9.1.1. Crude Oil
- 9.1.2. Natural Gas
- 9.2. Market Analysis, Insights and Forecast - by Types
- 9.2.1. Single
- 9.2.2. Double
- 9.1. Market Analysis, Insights and Forecast - by Application
- 10. Asia Pacific Oil & Gas Processing Seals Analysis, Insights and Forecast, 2020-2032
- 10.1. Market Analysis, Insights and Forecast - by Application
- 10.1.1. Crude Oil
- 10.1.2. Natural Gas
- 10.2. Market Analysis, Insights and Forecast - by Types
- 10.2.1. Single
- 10.2.2. Double
- 10.1. Market Analysis, Insights and Forecast - by Application
- 11. Competitive Analysis
- 11.1. Global Market Share Analysis 2025
- 11.2. Company Profiles
- 11.2.1 Freudenberg Group
- 11.2.1.1. Overview
- 11.2.1.2. Products
- 11.2.1.3. SWOT Analysis
- 11.2.1.4. Recent Developments
- 11.2.1.5. Financials (Based on Availability)
- 11.2.2 John Crane
- 11.2.2.1. Overview
- 11.2.2.2. Products
- 11.2.2.3. SWOT Analysis
- 11.2.2.4. Recent Developments
- 11.2.2.5. Financials (Based on Availability)
- 11.2.3 Flowserve Corporation
- 11.2.3.1. Overview
- 11.2.3.2. Products
- 11.2.3.3. SWOT Analysis
- 11.2.3.4. Recent Developments
- 11.2.3.5. Financials (Based on Availability)
- 11.2.4 Parker Hannifin Corp
- 11.2.4.1. Overview
- 11.2.4.2. Products
- 11.2.4.3. SWOT Analysis
- 11.2.4.4. Recent Developments
- 11.2.4.5. Financials (Based on Availability)
- 11.2.5 Saint-Gobain
- 11.2.5.1. Overview
- 11.2.5.2. Products
- 11.2.5.3. SWOT Analysis
- 11.2.5.4. Recent Developments
- 11.2.5.5. Financials (Based on Availability)
- 11.2.6 Trelleborg AB
- 11.2.6.1. Overview
- 11.2.6.2. Products
- 11.2.6.3. SWOT Analysis
- 11.2.6.4. Recent Developments
- 11.2.6.5. Financials (Based on Availability)
- 11.2.7 Dupont
- 11.2.7.1. Overview
- 11.2.7.2. Products
- 11.2.7.3. SWOT Analysis
- 11.2.7.4. Recent Developments
- 11.2.7.5. Financials (Based on Availability)
- 11.2.8 Precision Polymer Engineering
- 11.2.8.1. Overview
- 11.2.8.2. Products
- 11.2.8.3. SWOT Analysis
- 11.2.8.4. Recent Developments
- 11.2.8.5. Financials (Based on Availability)
- 11.2.9 Techno Ad Ltd.
- 11.2.9.1. Overview
- 11.2.9.2. Products
- 11.2.9.3. SWOT Analysis
- 11.2.9.4. Recent Developments
- 11.2.9.5. Financials (Based on Availability)
- 11.2.10 M.Barnwell Services Limited
- 11.2.10.1. Overview
- 11.2.10.2. Products
- 11.2.10.3. SWOT Analysis
- 11.2.10.4. Recent Developments
- 11.2.10.5. Financials (Based on Availability)
- 11.2.11 Precision Associates
- 11.2.11.1. Overview
- 11.2.11.2. Products
- 11.2.11.3. SWOT Analysis
- 11.2.11.4. Recent Developments
- 11.2.11.5. Financials (Based on Availability)
- 11.2.12 Inc.
- 11.2.12.1. Overview
- 11.2.12.2. Products
- 11.2.12.3. SWOT Analysis
- 11.2.12.4. Recent Developments
- 11.2.12.5. Financials (Based on Availability)
- 11.2.13 FTL Technology
- 11.2.13.1. Overview
- 11.2.13.2. Products
- 11.2.13.3. SWOT Analysis
- 11.2.13.4. Recent Developments
- 11.2.13.5. Financials (Based on Availability)
- 11.2.14 Aesseal PLC.
- 11.2.14.1. Overview
- 11.2.14.2. Products
- 11.2.14.3. SWOT Analysis
- 11.2.14.4. Recent Developments
- 11.2.14.5. Financials (Based on Availability)
- 11.2.15 Technetics Group
- 11.2.15.1. Overview
- 11.2.15.2. Products
- 11.2.15.3. SWOT Analysis
- 11.2.15.4. Recent Developments
- 11.2.15.5. Financials (Based on Availability)
- 11.2.16 Performance Sealing Inc.
- 11.2.16.1. Overview
- 11.2.16.2. Products
- 11.2.16.3. SWOT Analysis
- 11.2.16.4. Recent Developments
- 11.2.16.5. Financials (Based on Availability)
- 11.2.17 Ceetak Ltd.
- 11.2.17.1. Overview
- 11.2.17.2. Products
- 11.2.17.3. SWOT Analysis
- 11.2.17.4. Recent Developments
- 11.2.17.5. Financials (Based on Availability)
- 11.2.18 American High Performance Seals
- 11.2.18.1. Overview
- 11.2.18.2. Products
- 11.2.18.3. SWOT Analysis
- 11.2.18.4. Recent Developments
- 11.2.18.5. Financials (Based on Availability)
- 11.2.1 Freudenberg Group
List of Figures
- Figure 1: Global Oil & Gas Processing Seals Revenue Breakdown (million, %) by Region 2025 & 2033
- Figure 2: North America Oil & Gas Processing Seals Revenue (million), by Application 2025 & 2033
- Figure 3: North America Oil & Gas Processing Seals Revenue Share (%), by Application 2025 & 2033
- Figure 4: North America Oil & Gas Processing Seals Revenue (million), by Types 2025 & 2033
- Figure 5: North America Oil & Gas Processing Seals Revenue Share (%), by Types 2025 & 2033
- Figure 6: North America Oil & Gas Processing Seals Revenue (million), by Country 2025 & 2033
- Figure 7: North America Oil & Gas Processing Seals Revenue Share (%), by Country 2025 & 2033
- Figure 8: South America Oil & Gas Processing Seals Revenue (million), by Application 2025 & 2033
- Figure 9: South America Oil & Gas Processing Seals Revenue Share (%), by Application 2025 & 2033
- Figure 10: South America Oil & Gas Processing Seals Revenue (million), by Types 2025 & 2033
- Figure 11: South America Oil & Gas Processing Seals Revenue Share (%), by Types 2025 & 2033
- Figure 12: South America Oil & Gas Processing Seals Revenue (million), by Country 2025 & 2033
- Figure 13: South America Oil & Gas Processing Seals Revenue Share (%), by Country 2025 & 2033
- Figure 14: Europe Oil & Gas Processing Seals Revenue (million), by Application 2025 & 2033
- Figure 15: Europe Oil & Gas Processing Seals Revenue Share (%), by Application 2025 & 2033
- Figure 16: Europe Oil & Gas Processing Seals Revenue (million), by Types 2025 & 2033
- Figure 17: Europe Oil & Gas Processing Seals Revenue Share (%), by Types 2025 & 2033
- Figure 18: Europe Oil & Gas Processing Seals Revenue (million), by Country 2025 & 2033
- Figure 19: Europe Oil & Gas Processing Seals Revenue Share (%), by Country 2025 & 2033
- Figure 20: Middle East & Africa Oil & Gas Processing Seals Revenue (million), by Application 2025 & 2033
- Figure 21: Middle East & Africa Oil & Gas Processing Seals Revenue Share (%), by Application 2025 & 2033
- Figure 22: Middle East & Africa Oil & Gas Processing Seals Revenue (million), by Types 2025 & 2033
- Figure 23: Middle East & Africa Oil & Gas Processing Seals Revenue Share (%), by Types 2025 & 2033
- Figure 24: Middle East & Africa Oil & Gas Processing Seals Revenue (million), by Country 2025 & 2033
- Figure 25: Middle East & Africa Oil & Gas Processing Seals Revenue Share (%), by Country 2025 & 2033
- Figure 26: Asia Pacific Oil & Gas Processing Seals Revenue (million), by Application 2025 & 2033
- Figure 27: Asia Pacific Oil & Gas Processing Seals Revenue Share (%), by Application 2025 & 2033
- Figure 28: Asia Pacific Oil & Gas Processing Seals Revenue (million), by Types 2025 & 2033
- Figure 29: Asia Pacific Oil & Gas Processing Seals Revenue Share (%), by Types 2025 & 2033
- Figure 30: Asia Pacific Oil & Gas Processing Seals Revenue (million), by Country 2025 & 2033
- Figure 31: Asia Pacific Oil & Gas Processing Seals Revenue Share (%), by Country 2025 & 2033
List of Tables
- Table 1: Global Oil & Gas Processing Seals Revenue million Forecast, by Application 2020 & 2033
- Table 2: Global Oil & Gas Processing Seals Revenue million Forecast, by Types 2020 & 2033
- Table 3: Global Oil & Gas Processing Seals Revenue million Forecast, by Region 2020 & 2033
- Table 4: Global Oil & Gas Processing Seals Revenue million Forecast, by Application 2020 & 2033
- Table 5: Global Oil & Gas Processing Seals Revenue million Forecast, by Types 2020 & 2033
- Table 6: Global Oil & Gas Processing Seals Revenue million Forecast, by Country 2020 & 2033
- Table 7: United States Oil & Gas Processing Seals Revenue (million) Forecast, by Application 2020 & 2033
- Table 8: Canada Oil & Gas Processing Seals Revenue (million) Forecast, by Application 2020 & 2033
- Table 9: Mexico Oil & Gas Processing Seals Revenue (million) Forecast, by Application 2020 & 2033
- Table 10: Global Oil & Gas Processing Seals Revenue million Forecast, by Application 2020 & 2033
- Table 11: Global Oil & Gas Processing Seals Revenue million Forecast, by Types 2020 & 2033
- Table 12: Global Oil & Gas Processing Seals Revenue million Forecast, by Country 2020 & 2033
- Table 13: Brazil Oil & Gas Processing Seals Revenue (million) Forecast, by Application 2020 & 2033
- Table 14: Argentina Oil & Gas Processing Seals Revenue (million) Forecast, by Application 2020 & 2033
- Table 15: Rest of South America Oil & Gas Processing Seals Revenue (million) Forecast, by Application 2020 & 2033
- Table 16: Global Oil & Gas Processing Seals Revenue million Forecast, by Application 2020 & 2033
- Table 17: Global Oil & Gas Processing Seals Revenue million Forecast, by Types 2020 & 2033
- Table 18: Global Oil & Gas Processing Seals Revenue million Forecast, by Country 2020 & 2033
- Table 19: United Kingdom Oil & Gas Processing Seals Revenue (million) Forecast, by Application 2020 & 2033
- Table 20: Germany Oil & Gas Processing Seals Revenue (million) Forecast, by Application 2020 & 2033
- Table 21: France Oil & Gas Processing Seals Revenue (million) Forecast, by Application 2020 & 2033
- Table 22: Italy Oil & Gas Processing Seals Revenue (million) Forecast, by Application 2020 & 2033
- Table 23: Spain Oil & Gas Processing Seals Revenue (million) Forecast, by Application 2020 & 2033
- Table 24: Russia Oil & Gas Processing Seals Revenue (million) Forecast, by Application 2020 & 2033
- Table 25: Benelux Oil & Gas Processing Seals Revenue (million) Forecast, by Application 2020 & 2033
- Table 26: Nordics Oil & Gas Processing Seals Revenue (million) Forecast, by Application 2020 & 2033
- Table 27: Rest of Europe Oil & Gas Processing Seals Revenue (million) Forecast, by Application 2020 & 2033
- Table 28: Global Oil & Gas Processing Seals Revenue million Forecast, by Application 2020 & 2033
- Table 29: Global Oil & Gas Processing Seals Revenue million Forecast, by Types 2020 & 2033
- Table 30: Global Oil & Gas Processing Seals Revenue million Forecast, by Country 2020 & 2033
- Table 31: Turkey Oil & Gas Processing Seals Revenue (million) Forecast, by Application 2020 & 2033
- Table 32: Israel Oil & Gas Processing Seals Revenue (million) Forecast, by Application 2020 & 2033
- Table 33: GCC Oil & Gas Processing Seals Revenue (million) Forecast, by Application 2020 & 2033
- Table 34: North Africa Oil & Gas Processing Seals Revenue (million) Forecast, by Application 2020 & 2033
- Table 35: South Africa Oil & Gas Processing Seals Revenue (million) Forecast, by Application 2020 & 2033
- Table 36: Rest of Middle East & Africa Oil & Gas Processing Seals Revenue (million) Forecast, by Application 2020 & 2033
- Table 37: Global Oil & Gas Processing Seals Revenue million Forecast, by Application 2020 & 2033
- Table 38: Global Oil & Gas Processing Seals Revenue million Forecast, by Types 2020 & 2033
- Table 39: Global Oil & Gas Processing Seals Revenue million Forecast, by Country 2020 & 2033
- Table 40: China Oil & Gas Processing Seals Revenue (million) Forecast, by Application 2020 & 2033
- Table 41: India Oil & Gas Processing Seals Revenue (million) Forecast, by Application 2020 & 2033
- Table 42: Japan Oil & Gas Processing Seals Revenue (million) Forecast, by Application 2020 & 2033
- Table 43: South Korea Oil & Gas Processing Seals Revenue (million) Forecast, by Application 2020 & 2033
- Table 44: ASEAN Oil & Gas Processing Seals Revenue (million) Forecast, by Application 2020 & 2033
- Table 45: Oceania Oil & Gas Processing Seals Revenue (million) Forecast, by Application 2020 & 2033
- Table 46: Rest of Asia Pacific Oil & Gas Processing Seals Revenue (million) Forecast, by Application 2020 & 2033
Frequently Asked Questions
1. What is the projected Compound Annual Growth Rate (CAGR) of the Oil & Gas Processing Seals?
The projected CAGR is approximately 2.2%.
2. Which companies are prominent players in the Oil & Gas Processing Seals?
Key companies in the market include Freudenberg Group, John Crane, Flowserve Corporation, Parker Hannifin Corp, Saint-Gobain, Trelleborg AB, Dupont, Precision Polymer Engineering, Techno Ad Ltd., M.Barnwell Services Limited, Precision Associates, Inc., FTL Technology, Aesseal PLC., Technetics Group, Performance Sealing Inc., Ceetak Ltd., American High Performance Seals.
3. What are the main segments of the Oil & Gas Processing Seals?
The market segments include Application, Types.
4. Can you provide details about the market size?
The market size is estimated to be USD 6259.3 million as of 2022.
5. What are some drivers contributing to market growth?
N/A
6. What are the notable trends driving market growth?
N/A
7. Are there any restraints impacting market growth?
N/A
8. Can you provide examples of recent developments in the market?
N/A
9. What pricing options are available for accessing the report?
Pricing options include single-user, multi-user, and enterprise licenses priced at USD 4900.00, USD 7350.00, and USD 9800.00 respectively.
10. Is the market size provided in terms of value or volume?
The market size is provided in terms of value, measured in million.
11. Are there any specific market keywords associated with the report?
Yes, the market keyword associated with the report is "Oil & Gas Processing Seals," which aids in identifying and referencing the specific market segment covered.
12. How do I determine which pricing option suits my needs best?
The pricing options vary based on user requirements and access needs. Individual users may opt for single-user licenses, while businesses requiring broader access may choose multi-user or enterprise licenses for cost-effective access to the report.
13. Are there any additional resources or data provided in the Oil & Gas Processing Seals report?
While the report offers comprehensive insights, it's advisable to review the specific contents or supplementary materials provided to ascertain if additional resources or data are available.
14. How can I stay updated on further developments or reports in the Oil & Gas Processing Seals?
To stay informed about further developments, trends, and reports in the Oil & Gas Processing Seals, consider subscribing to industry newsletters, following relevant companies and organizations, or regularly checking reputable industry news sources and publications.
Methodology
Step 1 - Identification of Relevant Samples Size from Population Database


Step 2 - Approaches for Defining Global Market Size (Value, Volume* & Price*)

Note*: In applicable scenarios
Step 3 - Data Sources
Primary Research
- Web Analytics
- Survey Reports
- Research Institute
- Latest Research Reports
- Opinion Leaders
Secondary Research
- Annual Reports
- White Paper
- Latest Press Release
- Industry Association
- Paid Database
- Investor Presentations

Step 4 - Data Triangulation
Involves using different sources of information in order to increase the validity of a study
These sources are likely to be stakeholders in a program - participants, other researchers, program staff, other community members, and so on.
Then we put all data in single framework & apply various statistical tools to find out the dynamic on the market.
During the analysis stage, feedback from the stakeholder groups would be compared to determine areas of agreement as well as areas of divergence