

Key Insights
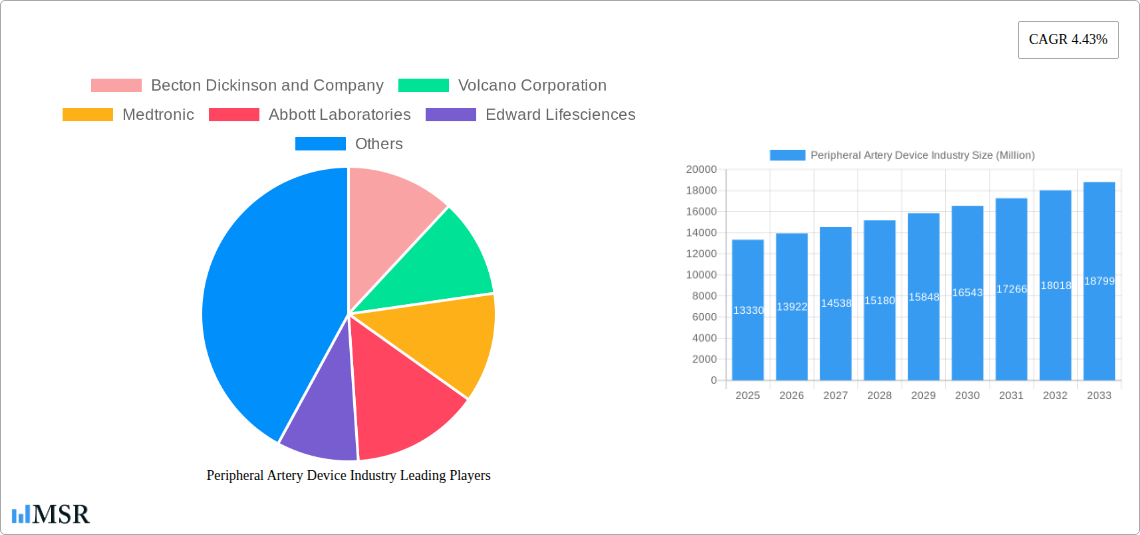
The Peripheral Artery Disease (PAD) device market, valued at approximately $13.33 billion in 2025, is projected to experience steady growth, driven by a rising prevalence of PAD, particularly in aging populations. Technological advancements in minimally invasive procedures, such as improved stent designs, and the increasing adoption of advanced imaging techniques for accurate diagnosis are key drivers. Growth is further fueled by a rising awareness of PAD symptoms and improved patient access to specialized healthcare. While the market faces restraints such as high procedure costs and potential complications associated with interventions, the overall growth trajectory remains positive. The segments within the market demonstrate varied growth potential. Peripheral vascular stents and PTA balloon catheters are expected to maintain a significant market share due to their widespread use, although atherectomy devices and embolic protection devices are experiencing faster growth, reflecting the increasing preference for more complex procedures offering better outcomes. The geographic distribution of the market showcases significant potential in regions like Asia Pacific, driven by increasing healthcare expenditure and growing awareness of cardiovascular diseases. North America and Europe will continue to hold substantial shares due to established healthcare infrastructure and high prevalence rates.
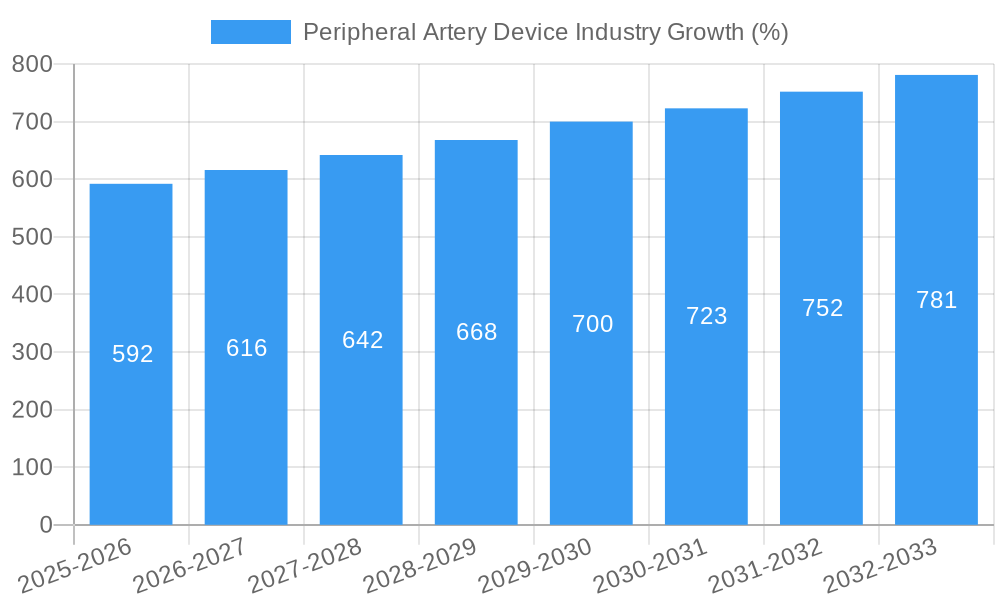
The forecast period (2025-2033) anticipates a continued expansion, with a Compound Annual Growth Rate (CAGR) of 4.43%. This growth will be influenced by continued technological innovation, expanding healthcare access in developing economies, and a greater emphasis on preventative care and early diagnosis of PAD. However, pricing pressures, regulatory hurdles, and the potential impact of new treatment modalities will influence the market's development. Competition among major players like Becton Dickinson, Medtronic, and Boston Scientific will likely intensify, driving innovation and potential consolidation within the industry. Future market success will depend on companies' ability to develop innovative products, expand their market reach, and offer comprehensive solutions to healthcare providers and patients alike.
Peripheral Artery Device Industry Market Report: 2019-2033
This comprehensive report provides an in-depth analysis of the Peripheral Artery Device (PAD) industry, offering crucial insights for stakeholders, investors, and industry professionals. Covering the period from 2019 to 2033, with a focus on 2025, this report meticulously examines market dynamics, technological advancements, and key players shaping the future of PAD treatment. The market is projected to reach xx Million by 2033, exhibiting a CAGR of xx% during the forecast period (2025-2033).
Peripheral Artery Device Industry Market Concentration & Dynamics
The Peripheral Artery Device market is moderately concentrated, with key players like Becton Dickinson and Company, Volcano Corporation, Medtronic, Abbott Laboratories, Edward Lifesciences, Cook, Boston Scientific Corporation, and Cordis Corporation holding significant market share. However, the presence of smaller, innovative companies indicates a dynamic competitive landscape. Market share distribution fluctuates based on product innovation, regulatory approvals, and strategic partnerships. The industry is characterized by a robust innovation ecosystem, driven by advancements in minimally invasive procedures and drug-eluting technologies. Stringent regulatory frameworks, primarily governed by the FDA, influence product development and market entry. Substitute products, such as surgical interventions, exist but are often less preferred due to invasiveness and longer recovery times. End-user trends show a growing preference for less invasive procedures and improved patient outcomes. M&A activities in the sector are frequent, reflecting consolidation and expansion strategies among major players. The number of M&A deals in the last five years totaled xx, with an average deal value of approximately xx Million.
- Market Concentration: Moderately concentrated with significant players holding xx% combined market share.
- Innovation Ecosystem: Strong, driven by advancements in minimally invasive techniques and drug-eluting stents.
- Regulatory Framework: Stringent, primarily influenced by FDA approvals.
- Substitute Products: Surgical interventions, less preferred due to invasiveness.
- M&A Activity: High, with xx deals recorded over the past five years, indicating consolidation.
Peripheral Artery Device Industry Industry Insights & Trends
The Peripheral Artery Device market is experiencing robust growth driven by increasing prevalence of peripheral artery disease (PAD), an aging global population, and rising healthcare expenditure. Technological advancements, including drug-eluting stents, novel atherectomy devices, and improved imaging techniques, are further fueling market expansion. Consumer behavior reflects a growing demand for minimally invasive procedures and faster recovery times. The market size reached xx Million in 2024 and is projected to reach xx Million by 2033, demonstrating significant growth potential. This growth is further fueled by increased awareness and early diagnosis of PAD and the rising adoption of advanced treatment modalities. The industry is also witnessing a shift towards personalized medicine and targeted therapies, tailoring treatment approaches based on individual patient needs. The CAGR for the period 2025-2033 is estimated at xx%.
Key Markets & Segments Leading Peripheral Artery Device Industry
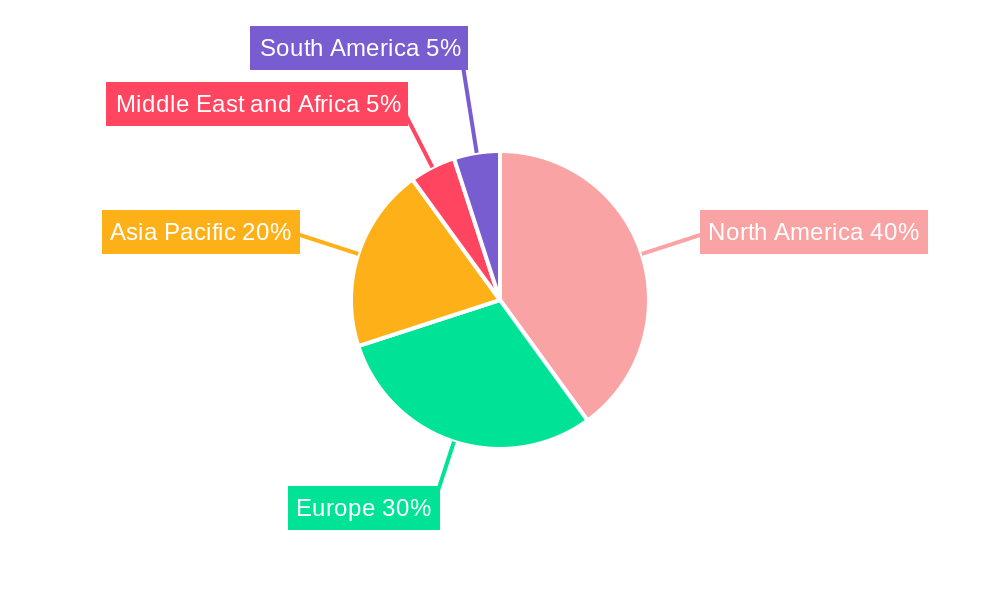
North America currently dominates the Peripheral Artery Device market due to high healthcare expenditure, advanced medical infrastructure, and a large patient pool. Within device types, Peripheral Vascular Stents hold the largest segment share, followed by Peripheral Transluminal Angioplasty (PTA) Balloon Catheters.
Drivers of North American Dominance:
- High healthcare expenditure.
- Advanced medical infrastructure.
- High prevalence of PAD.
- Early adoption of innovative devices.
Segment Analysis:
- Peripheral Vascular Stents: Largest market segment due to its effectiveness in treating PAD. The market is expected to grow at a xx% CAGR driven by technological advancements in drug-eluting stents and improved stent design.
- Peripheral Transluminal Angioplasty (PTA) Balloon Catheters: Significant market share due to wide adoption in minimally invasive procedures.
- Peripheral Transluminal Angioplasty (PTA) Guidewires: Essential components in PTA procedures contributing a stable market share.
- Atherectomy Devices: Growing segment driven by increasing demand for minimally invasive atherectomy procedures.
- Embolic Protection Devices: Expanding segment due to enhanced patient safety during endovascular procedures.
- Inferior Vena Cava Filters: Significant market share driven by the high prevalence of deep vein thrombosis.
- Other Device Types: Includes various accessories and supporting devices, showing moderate growth potential.
The European market is also a key contributor, experiencing steady growth driven by increasing prevalence of PAD and rising healthcare spending. Asia-Pacific is projected to be the fastest-growing region due to rising disposable incomes, expanding healthcare infrastructure, and increasing awareness of PAD.
Peripheral Artery Device Industry Product Developments
Recent years have witnessed significant advancements in Peripheral Artery Devices, particularly in drug-eluting stents and minimally invasive atherectomy devices. These innovations enhance treatment efficacy, reduce complications, and improve patient outcomes. The focus is on developing smart devices with advanced features that allow for better precision and personalized treatment. Companies are actively investing in research and development to improve device designs and materials, leading to a more competitive market landscape.
Challenges in the Peripheral Artery Device Industry Market
The Peripheral Artery Device industry faces challenges such as stringent regulatory approvals, complex reimbursement processes, increasing competition, and supply chain disruptions. Regulatory hurdles can delay product launches, impacting market entry and revenue streams. Supply chain disruptions and material shortages can affect manufacturing and device availability. The increasing price pressure from payers and intense competition among major players further add to the challenges impacting profitability and market share.
Forces Driving Peripheral Artery Device Industry Growth
The industry's growth is fueled by several factors: a rising geriatric population, a surge in prevalence of PAD, technological advancements in less invasive procedures, and increased healthcare expenditure. Government initiatives promoting early diagnosis and treatment of PAD further stimulate market growth. Investments in R&D are driving innovation in device design and functionality, leading to improved patient outcomes.
Challenges in the Peripheral Artery Device Industry Market
Long-term growth will hinge on overcoming regulatory hurdles, addressing supply chain vulnerabilities, and fostering strategic partnerships for research and development. Continued innovation in minimally invasive techniques, coupled with improved imaging technologies, will enhance treatment efficacy and market expansion.
Emerging Opportunities in Peripheral Artery Device Industry
Emerging opportunities lie in developing novel drug-eluting stents, minimally invasive atherectomy devices, and personalized treatment strategies. Expansion into untapped markets, particularly in developing economies, offers significant growth potential. The focus on improved patient outcomes and enhanced device safety will drive future market expansion.
Leading Players in the Peripheral Artery Device Industry Sector
- Becton Dickinson and Company
- Volcano Corporation
- Medtronic
- Abbott Laboratories
- Edward Lifesciences
- Cook
- Boston Scientific Corporation
- Cordis Corporation
Key Milestones in Peripheral Artery Device Industry Industry
- June 2022: Cardio Flow, Inc. receives FDA approval for FreedomFlow Peripheral Guidewire. This milestone signifies advancements in minimally invasive procedures for PAD.
- January 2022: Cook Medical receives FDA breakthrough device designation for a new drug-eluting stent for BTK treatment. This accelerates the development and market entry of innovative solutions for limb-threatening ischemia.
Strategic Outlook for Peripheral Artery Device Industry Market
The Peripheral Artery Device market shows strong potential for continued growth driven by technological innovation, an expanding elderly population, and rising healthcare expenditure. Strategic partnerships, focused R&D investments, and expansion into emerging markets will be key for companies to capitalize on the market's growth trajectory and secure a leading position in this dynamic sector.
Peripheral Artery Device Industry Segmentation
-
1. Device Type
- 1.1. Peripheral Vascular Stents
- 1.2. Peripher
- 1.3. Peripher
- 1.4. Atherectomy Devices
- 1.5. Embolic Protection Devices
- 1.6. Inferior Vena Cava Filters
- 1.7. Other Device Types
Peripheral Artery Device Industry Segmentation By Geography
-
1. North America
- 1.1. United States
- 1.2. Canada
- 1.3. Mexico
-
2. Europe
- 2.1. Germany
- 2.2. United Kingdom
- 2.3. France
- 2.4. Italy
- 2.5. Spain
- 2.6. Rest of Europe
-
3. Asia Pacific
- 3.1. China
- 3.2. Japan
- 3.3. India
- 3.4. Australia
- 3.5. South Korea
- 3.6. Rest of Asia Pacific
-
4. Middle East and Africa
- 4.1. GCC
- 4.2. South Africa
- 4.3. Rest of Middle East and Africa
-
5. South America
- 5.1. Brazil
- 5.2. Argentina
- 5.3. Rest of South America
Peripheral Artery Device Industry REPORT HIGHLIGHTS
| Aspects | Details |
|---|---|
| Study Period | 2019-2033 |
| Base Year | 2024 |
| Estimated Year | 2025 |
| Forecast Period | 2025-2033 |
| Historical Period | 2019-2024 |
| Growth Rate | CAGR of 4.43% from 2019-2033 |
| Segmentation |
|
Table of Contents
- 1. Introduction
- 1.1. Research Scope
- 1.2. Market Segmentation
- 1.3. Research Methodology
- 1.4. Definitions and Assumptions
- 2. Executive Summary
- 2.1. Introduction
- 3. Market Dynamics
- 3.1. Introduction
- 3.2. Market Drivers
- 3.2.1. Rising Demand for Minimally-invasive Procedures; Increase in Incidence of Peripheral Arterial Disease (PAD)
- 3.3. Market Restrains
- 3.3.1. Stringent Regulation Related to Peripheral Vascular Devices
- 3.4. Market Trends
- 3.4.1. Peripheral Vascular Stents are expected to witness growth over the forecast period
- 4. Market Factor Analysis
- 4.1. Porters Five Forces
- 4.2. Supply/Value Chain
- 4.3. PESTEL analysis
- 4.4. Market Entropy
- 4.5. Patent/Trademark Analysis
- 5. Global Peripheral Artery Device Industry Analysis, Insights and Forecast, 2019-2031
- 5.1. Market Analysis, Insights and Forecast - by Device Type
- 5.1.1. Peripheral Vascular Stents
- 5.1.2. Peripher
- 5.1.3. Peripher
- 5.1.4. Atherectomy Devices
- 5.1.5. Embolic Protection Devices
- 5.1.6. Inferior Vena Cava Filters
- 5.1.7. Other Device Types
- 5.2. Market Analysis, Insights and Forecast - by Region
- 5.2.1. North America
- 5.2.2. Europe
- 5.2.3. Asia Pacific
- 5.2.4. Middle East and Africa
- 5.2.5. South America
- 5.1. Market Analysis, Insights and Forecast - by Device Type
- 6. North America Peripheral Artery Device Industry Analysis, Insights and Forecast, 2019-2031
- 6.1. Market Analysis, Insights and Forecast - by Device Type
- 6.1.1. Peripheral Vascular Stents
- 6.1.2. Peripher
- 6.1.3. Peripher
- 6.1.4. Atherectomy Devices
- 6.1.5. Embolic Protection Devices
- 6.1.6. Inferior Vena Cava Filters
- 6.1.7. Other Device Types
- 6.1. Market Analysis, Insights and Forecast - by Device Type
- 7. Europe Peripheral Artery Device Industry Analysis, Insights and Forecast, 2019-2031
- 7.1. Market Analysis, Insights and Forecast - by Device Type
- 7.1.1. Peripheral Vascular Stents
- 7.1.2. Peripher
- 7.1.3. Peripher
- 7.1.4. Atherectomy Devices
- 7.1.5. Embolic Protection Devices
- 7.1.6. Inferior Vena Cava Filters
- 7.1.7. Other Device Types
- 7.1. Market Analysis, Insights and Forecast - by Device Type
- 8. Asia Pacific Peripheral Artery Device Industry Analysis, Insights and Forecast, 2019-2031
- 8.1. Market Analysis, Insights and Forecast - by Device Type
- 8.1.1. Peripheral Vascular Stents
- 8.1.2. Peripher
- 8.1.3. Peripher
- 8.1.4. Atherectomy Devices
- 8.1.5. Embolic Protection Devices
- 8.1.6. Inferior Vena Cava Filters
- 8.1.7. Other Device Types
- 8.1. Market Analysis, Insights and Forecast - by Device Type
- 9. Middle East and Africa Peripheral Artery Device Industry Analysis, Insights and Forecast, 2019-2031
- 9.1. Market Analysis, Insights and Forecast - by Device Type
- 9.1.1. Peripheral Vascular Stents
- 9.1.2. Peripher
- 9.1.3. Peripher
- 9.1.4. Atherectomy Devices
- 9.1.5. Embolic Protection Devices
- 9.1.6. Inferior Vena Cava Filters
- 9.1.7. Other Device Types
- 9.1. Market Analysis, Insights and Forecast - by Device Type
- 10. South America Peripheral Artery Device Industry Analysis, Insights and Forecast, 2019-2031
- 10.1. Market Analysis, Insights and Forecast - by Device Type
- 10.1.1. Peripheral Vascular Stents
- 10.1.2. Peripher
- 10.1.3. Peripher
- 10.1.4. Atherectomy Devices
- 10.1.5. Embolic Protection Devices
- 10.1.6. Inferior Vena Cava Filters
- 10.1.7. Other Device Types
- 10.1. Market Analysis, Insights and Forecast - by Device Type
- 11. North America Peripheral Artery Device Industry Analysis, Insights and Forecast, 2019-2031
- 11.1. Market Analysis, Insights and Forecast - By Country/Sub-region
- 11.1.1 United States
- 11.1.2 Canada
- 11.1.3 Mexico
- 12. Europe Peripheral Artery Device Industry Analysis, Insights and Forecast, 2019-2031
- 12.1. Market Analysis, Insights and Forecast - By Country/Sub-region
- 12.1.1 Germany
- 12.1.2 United Kingdom
- 12.1.3 France
- 12.1.4 Italy
- 12.1.5 Spain
- 12.1.6 Rest of Europe
- 13. Asia Pacific Peripheral Artery Device Industry Analysis, Insights and Forecast, 2019-2031
- 13.1. Market Analysis, Insights and Forecast - By Country/Sub-region
- 13.1.1 China
- 13.1.2 Japan
- 13.1.3 India
- 13.1.4 Australia
- 13.1.5 South Korea
- 13.1.6 Rest of Asia Pacific
- 14. Middle East and Africa Peripheral Artery Device Industry Analysis, Insights and Forecast, 2019-2031
- 14.1. Market Analysis, Insights and Forecast - By Country/Sub-region
- 14.1.1 GCC
- 14.1.2 South Africa
- 14.1.3 Rest of Middle East and Africa
- 15. South America Peripheral Artery Device Industry Analysis, Insights and Forecast, 2019-2031
- 15.1. Market Analysis, Insights and Forecast - By Country/Sub-region
- 15.1.1 Brazil
- 15.1.2 Argentina
- 15.1.3 Rest of South America
- 16. Competitive Analysis
- 16.1. Global Market Share Analysis 2024
- 16.2. Company Profiles
- 16.2.1 Becton Dickinson and Company
- 16.2.1.1. Overview
- 16.2.1.2. Products
- 16.2.1.3. SWOT Analysis
- 16.2.1.4. Recent Developments
- 16.2.1.5. Financials (Based on Availability)
- 16.2.2 Volcano Corporation
- 16.2.2.1. Overview
- 16.2.2.2. Products
- 16.2.2.3. SWOT Analysis
- 16.2.2.4. Recent Developments
- 16.2.2.5. Financials (Based on Availability)
- 16.2.3 Medtronic
- 16.2.3.1. Overview
- 16.2.3.2. Products
- 16.2.3.3. SWOT Analysis
- 16.2.3.4. Recent Developments
- 16.2.3.5. Financials (Based on Availability)
- 16.2.4 Abbott Laboratories
- 16.2.4.1. Overview
- 16.2.4.2. Products
- 16.2.4.3. SWOT Analysis
- 16.2.4.4. Recent Developments
- 16.2.4.5. Financials (Based on Availability)
- 16.2.5 Edward Lifesciences
- 16.2.5.1. Overview
- 16.2.5.2. Products
- 16.2.5.3. SWOT Analysis
- 16.2.5.4. Recent Developments
- 16.2.5.5. Financials (Based on Availability)
- 16.2.6 Cook
- 16.2.6.1. Overview
- 16.2.6.2. Products
- 16.2.6.3. SWOT Analysis
- 16.2.6.4. Recent Developments
- 16.2.6.5. Financials (Based on Availability)
- 16.2.7 Boston Scientific Corporation
- 16.2.7.1. Overview
- 16.2.7.2. Products
- 16.2.7.3. SWOT Analysis
- 16.2.7.4. Recent Developments
- 16.2.7.5. Financials (Based on Availability)
- 16.2.8 Cordis Corporation
- 16.2.8.1. Overview
- 16.2.8.2. Products
- 16.2.8.3. SWOT Analysis
- 16.2.8.4. Recent Developments
- 16.2.8.5. Financials (Based on Availability)
- 16.2.1 Becton Dickinson and Company
List of Figures
- Figure 1: Global Peripheral Artery Device Industry Revenue Breakdown (Million, %) by Region 2024 & 2032
- Figure 2: Global Peripheral Artery Device Industry Volume Breakdown (K Units, %) by Region 2024 & 2032
- Figure 3: North America Peripheral Artery Device Industry Revenue (Million), by Country 2024 & 2032
- Figure 4: North America Peripheral Artery Device Industry Volume (K Units), by Country 2024 & 2032
- Figure 5: North America Peripheral Artery Device Industry Revenue Share (%), by Country 2024 & 2032
- Figure 6: North America Peripheral Artery Device Industry Volume Share (%), by Country 2024 & 2032
- Figure 7: Europe Peripheral Artery Device Industry Revenue (Million), by Country 2024 & 2032
- Figure 8: Europe Peripheral Artery Device Industry Volume (K Units), by Country 2024 & 2032
- Figure 9: Europe Peripheral Artery Device Industry Revenue Share (%), by Country 2024 & 2032
- Figure 10: Europe Peripheral Artery Device Industry Volume Share (%), by Country 2024 & 2032
- Figure 11: Asia Pacific Peripheral Artery Device Industry Revenue (Million), by Country 2024 & 2032
- Figure 12: Asia Pacific Peripheral Artery Device Industry Volume (K Units), by Country 2024 & 2032
- Figure 13: Asia Pacific Peripheral Artery Device Industry Revenue Share (%), by Country 2024 & 2032
- Figure 14: Asia Pacific Peripheral Artery Device Industry Volume Share (%), by Country 2024 & 2032
- Figure 15: Middle East and Africa Peripheral Artery Device Industry Revenue (Million), by Country 2024 & 2032
- Figure 16: Middle East and Africa Peripheral Artery Device Industry Volume (K Units), by Country 2024 & 2032
- Figure 17: Middle East and Africa Peripheral Artery Device Industry Revenue Share (%), by Country 2024 & 2032
- Figure 18: Middle East and Africa Peripheral Artery Device Industry Volume Share (%), by Country 2024 & 2032
- Figure 19: South America Peripheral Artery Device Industry Revenue (Million), by Country 2024 & 2032
- Figure 20: South America Peripheral Artery Device Industry Volume (K Units), by Country 2024 & 2032
- Figure 21: South America Peripheral Artery Device Industry Revenue Share (%), by Country 2024 & 2032
- Figure 22: South America Peripheral Artery Device Industry Volume Share (%), by Country 2024 & 2032
- Figure 23: North America Peripheral Artery Device Industry Revenue (Million), by Device Type 2024 & 2032
- Figure 24: North America Peripheral Artery Device Industry Volume (K Units), by Device Type 2024 & 2032
- Figure 25: North America Peripheral Artery Device Industry Revenue Share (%), by Device Type 2024 & 2032
- Figure 26: North America Peripheral Artery Device Industry Volume Share (%), by Device Type 2024 & 2032
- Figure 27: North America Peripheral Artery Device Industry Revenue (Million), by Country 2024 & 2032
- Figure 28: North America Peripheral Artery Device Industry Volume (K Units), by Country 2024 & 2032
- Figure 29: North America Peripheral Artery Device Industry Revenue Share (%), by Country 2024 & 2032
- Figure 30: North America Peripheral Artery Device Industry Volume Share (%), by Country 2024 & 2032
- Figure 31: Europe Peripheral Artery Device Industry Revenue (Million), by Device Type 2024 & 2032
- Figure 32: Europe Peripheral Artery Device Industry Volume (K Units), by Device Type 2024 & 2032
- Figure 33: Europe Peripheral Artery Device Industry Revenue Share (%), by Device Type 2024 & 2032
- Figure 34: Europe Peripheral Artery Device Industry Volume Share (%), by Device Type 2024 & 2032
- Figure 35: Europe Peripheral Artery Device Industry Revenue (Million), by Country 2024 & 2032
- Figure 36: Europe Peripheral Artery Device Industry Volume (K Units), by Country 2024 & 2032
- Figure 37: Europe Peripheral Artery Device Industry Revenue Share (%), by Country 2024 & 2032
- Figure 38: Europe Peripheral Artery Device Industry Volume Share (%), by Country 2024 & 2032
- Figure 39: Asia Pacific Peripheral Artery Device Industry Revenue (Million), by Device Type 2024 & 2032
- Figure 40: Asia Pacific Peripheral Artery Device Industry Volume (K Units), by Device Type 2024 & 2032
- Figure 41: Asia Pacific Peripheral Artery Device Industry Revenue Share (%), by Device Type 2024 & 2032
- Figure 42: Asia Pacific Peripheral Artery Device Industry Volume Share (%), by Device Type 2024 & 2032
- Figure 43: Asia Pacific Peripheral Artery Device Industry Revenue (Million), by Country 2024 & 2032
- Figure 44: Asia Pacific Peripheral Artery Device Industry Volume (K Units), by Country 2024 & 2032
- Figure 45: Asia Pacific Peripheral Artery Device Industry Revenue Share (%), by Country 2024 & 2032
- Figure 46: Asia Pacific Peripheral Artery Device Industry Volume Share (%), by Country 2024 & 2032
- Figure 47: Middle East and Africa Peripheral Artery Device Industry Revenue (Million), by Device Type 2024 & 2032
- Figure 48: Middle East and Africa Peripheral Artery Device Industry Volume (K Units), by Device Type 2024 & 2032
- Figure 49: Middle East and Africa Peripheral Artery Device Industry Revenue Share (%), by Device Type 2024 & 2032
- Figure 50: Middle East and Africa Peripheral Artery Device Industry Volume Share (%), by Device Type 2024 & 2032
- Figure 51: Middle East and Africa Peripheral Artery Device Industry Revenue (Million), by Country 2024 & 2032
- Figure 52: Middle East and Africa Peripheral Artery Device Industry Volume (K Units), by Country 2024 & 2032
- Figure 53: Middle East and Africa Peripheral Artery Device Industry Revenue Share (%), by Country 2024 & 2032
- Figure 54: Middle East and Africa Peripheral Artery Device Industry Volume Share (%), by Country 2024 & 2032
- Figure 55: South America Peripheral Artery Device Industry Revenue (Million), by Device Type 2024 & 2032
- Figure 56: South America Peripheral Artery Device Industry Volume (K Units), by Device Type 2024 & 2032
- Figure 57: South America Peripheral Artery Device Industry Revenue Share (%), by Device Type 2024 & 2032
- Figure 58: South America Peripheral Artery Device Industry Volume Share (%), by Device Type 2024 & 2032
- Figure 59: South America Peripheral Artery Device Industry Revenue (Million), by Country 2024 & 2032
- Figure 60: South America Peripheral Artery Device Industry Volume (K Units), by Country 2024 & 2032
- Figure 61: South America Peripheral Artery Device Industry Revenue Share (%), by Country 2024 & 2032
- Figure 62: South America Peripheral Artery Device Industry Volume Share (%), by Country 2024 & 2032
List of Tables
- Table 1: Global Peripheral Artery Device Industry Revenue Million Forecast, by Region 2019 & 2032
- Table 2: Global Peripheral Artery Device Industry Volume K Units Forecast, by Region 2019 & 2032
- Table 3: Global Peripheral Artery Device Industry Revenue Million Forecast, by Device Type 2019 & 2032
- Table 4: Global Peripheral Artery Device Industry Volume K Units Forecast, by Device Type 2019 & 2032
- Table 5: Global Peripheral Artery Device Industry Revenue Million Forecast, by Region 2019 & 2032
- Table 6: Global Peripheral Artery Device Industry Volume K Units Forecast, by Region 2019 & 2032
- Table 7: Global Peripheral Artery Device Industry Revenue Million Forecast, by Country 2019 & 2032
- Table 8: Global Peripheral Artery Device Industry Volume K Units Forecast, by Country 2019 & 2032
- Table 9: United States Peripheral Artery Device Industry Revenue (Million) Forecast, by Application 2019 & 2032
- Table 10: United States Peripheral Artery Device Industry Volume (K Units) Forecast, by Application 2019 & 2032
- Table 11: Canada Peripheral Artery Device Industry Revenue (Million) Forecast, by Application 2019 & 2032
- Table 12: Canada Peripheral Artery Device Industry Volume (K Units) Forecast, by Application 2019 & 2032
- Table 13: Mexico Peripheral Artery Device Industry Revenue (Million) Forecast, by Application 2019 & 2032
- Table 14: Mexico Peripheral Artery Device Industry Volume (K Units) Forecast, by Application 2019 & 2032
- Table 15: Global Peripheral Artery Device Industry Revenue Million Forecast, by Country 2019 & 2032
- Table 16: Global Peripheral Artery Device Industry Volume K Units Forecast, by Country 2019 & 2032
- Table 17: Germany Peripheral Artery Device Industry Revenue (Million) Forecast, by Application 2019 & 2032
- Table 18: Germany Peripheral Artery Device Industry Volume (K Units) Forecast, by Application 2019 & 2032
- Table 19: United Kingdom Peripheral Artery Device Industry Revenue (Million) Forecast, by Application 2019 & 2032
- Table 20: United Kingdom Peripheral Artery Device Industry Volume (K Units) Forecast, by Application 2019 & 2032
- Table 21: France Peripheral Artery Device Industry Revenue (Million) Forecast, by Application 2019 & 2032
- Table 22: France Peripheral Artery Device Industry Volume (K Units) Forecast, by Application 2019 & 2032
- Table 23: Italy Peripheral Artery Device Industry Revenue (Million) Forecast, by Application 2019 & 2032
- Table 24: Italy Peripheral Artery Device Industry Volume (K Units) Forecast, by Application 2019 & 2032
- Table 25: Spain Peripheral Artery Device Industry Revenue (Million) Forecast, by Application 2019 & 2032
- Table 26: Spain Peripheral Artery Device Industry Volume (K Units) Forecast, by Application 2019 & 2032
- Table 27: Rest of Europe Peripheral Artery Device Industry Revenue (Million) Forecast, by Application 2019 & 2032
- Table 28: Rest of Europe Peripheral Artery Device Industry Volume (K Units) Forecast, by Application 2019 & 2032
- Table 29: Global Peripheral Artery Device Industry Revenue Million Forecast, by Country 2019 & 2032
- Table 30: Global Peripheral Artery Device Industry Volume K Units Forecast, by Country 2019 & 2032
- Table 31: China Peripheral Artery Device Industry Revenue (Million) Forecast, by Application 2019 & 2032
- Table 32: China Peripheral Artery Device Industry Volume (K Units) Forecast, by Application 2019 & 2032
- Table 33: Japan Peripheral Artery Device Industry Revenue (Million) Forecast, by Application 2019 & 2032
- Table 34: Japan Peripheral Artery Device Industry Volume (K Units) Forecast, by Application 2019 & 2032
- Table 35: India Peripheral Artery Device Industry Revenue (Million) Forecast, by Application 2019 & 2032
- Table 36: India Peripheral Artery Device Industry Volume (K Units) Forecast, by Application 2019 & 2032
- Table 37: Australia Peripheral Artery Device Industry Revenue (Million) Forecast, by Application 2019 & 2032
- Table 38: Australia Peripheral Artery Device Industry Volume (K Units) Forecast, by Application 2019 & 2032
- Table 39: South Korea Peripheral Artery Device Industry Revenue (Million) Forecast, by Application 2019 & 2032
- Table 40: South Korea Peripheral Artery Device Industry Volume (K Units) Forecast, by Application 2019 & 2032
- Table 41: Rest of Asia Pacific Peripheral Artery Device Industry Revenue (Million) Forecast, by Application 2019 & 2032
- Table 42: Rest of Asia Pacific Peripheral Artery Device Industry Volume (K Units) Forecast, by Application 2019 & 2032
- Table 43: Global Peripheral Artery Device Industry Revenue Million Forecast, by Country 2019 & 2032
- Table 44: Global Peripheral Artery Device Industry Volume K Units Forecast, by Country 2019 & 2032
- Table 45: GCC Peripheral Artery Device Industry Revenue (Million) Forecast, by Application 2019 & 2032
- Table 46: GCC Peripheral Artery Device Industry Volume (K Units) Forecast, by Application 2019 & 2032
- Table 47: South Africa Peripheral Artery Device Industry Revenue (Million) Forecast, by Application 2019 & 2032
- Table 48: South Africa Peripheral Artery Device Industry Volume (K Units) Forecast, by Application 2019 & 2032
- Table 49: Rest of Middle East and Africa Peripheral Artery Device Industry Revenue (Million) Forecast, by Application 2019 & 2032
- Table 50: Rest of Middle East and Africa Peripheral Artery Device Industry Volume (K Units) Forecast, by Application 2019 & 2032
- Table 51: Global Peripheral Artery Device Industry Revenue Million Forecast, by Country 2019 & 2032
- Table 52: Global Peripheral Artery Device Industry Volume K Units Forecast, by Country 2019 & 2032
- Table 53: Brazil Peripheral Artery Device Industry Revenue (Million) Forecast, by Application 2019 & 2032
- Table 54: Brazil Peripheral Artery Device Industry Volume (K Units) Forecast, by Application 2019 & 2032
- Table 55: Argentina Peripheral Artery Device Industry Revenue (Million) Forecast, by Application 2019 & 2032
- Table 56: Argentina Peripheral Artery Device Industry Volume (K Units) Forecast, by Application 2019 & 2032
- Table 57: Rest of South America Peripheral Artery Device Industry Revenue (Million) Forecast, by Application 2019 & 2032
- Table 58: Rest of South America Peripheral Artery Device Industry Volume (K Units) Forecast, by Application 2019 & 2032
- Table 59: Global Peripheral Artery Device Industry Revenue Million Forecast, by Device Type 2019 & 2032
- Table 60: Global Peripheral Artery Device Industry Volume K Units Forecast, by Device Type 2019 & 2032
- Table 61: Global Peripheral Artery Device Industry Revenue Million Forecast, by Country 2019 & 2032
- Table 62: Global Peripheral Artery Device Industry Volume K Units Forecast, by Country 2019 & 2032
- Table 63: United States Peripheral Artery Device Industry Revenue (Million) Forecast, by Application 2019 & 2032
- Table 64: United States Peripheral Artery Device Industry Volume (K Units) Forecast, by Application 2019 & 2032
- Table 65: Canada Peripheral Artery Device Industry Revenue (Million) Forecast, by Application 2019 & 2032
- Table 66: Canada Peripheral Artery Device Industry Volume (K Units) Forecast, by Application 2019 & 2032
- Table 67: Mexico Peripheral Artery Device Industry Revenue (Million) Forecast, by Application 2019 & 2032
- Table 68: Mexico Peripheral Artery Device Industry Volume (K Units) Forecast, by Application 2019 & 2032
- Table 69: Global Peripheral Artery Device Industry Revenue Million Forecast, by Device Type 2019 & 2032
- Table 70: Global Peripheral Artery Device Industry Volume K Units Forecast, by Device Type 2019 & 2032
- Table 71: Global Peripheral Artery Device Industry Revenue Million Forecast, by Country 2019 & 2032
- Table 72: Global Peripheral Artery Device Industry Volume K Units Forecast, by Country 2019 & 2032
- Table 73: Germany Peripheral Artery Device Industry Revenue (Million) Forecast, by Application 2019 & 2032
- Table 74: Germany Peripheral Artery Device Industry Volume (K Units) Forecast, by Application 2019 & 2032
- Table 75: United Kingdom Peripheral Artery Device Industry Revenue (Million) Forecast, by Application 2019 & 2032
- Table 76: United Kingdom Peripheral Artery Device Industry Volume (K Units) Forecast, by Application 2019 & 2032
- Table 77: France Peripheral Artery Device Industry Revenue (Million) Forecast, by Application 2019 & 2032
- Table 78: France Peripheral Artery Device Industry Volume (K Units) Forecast, by Application 2019 & 2032
- Table 79: Italy Peripheral Artery Device Industry Revenue (Million) Forecast, by Application 2019 & 2032
- Table 80: Italy Peripheral Artery Device Industry Volume (K Units) Forecast, by Application 2019 & 2032
- Table 81: Spain Peripheral Artery Device Industry Revenue (Million) Forecast, by Application 2019 & 2032
- Table 82: Spain Peripheral Artery Device Industry Volume (K Units) Forecast, by Application 2019 & 2032
- Table 83: Rest of Europe Peripheral Artery Device Industry Revenue (Million) Forecast, by Application 2019 & 2032
- Table 84: Rest of Europe Peripheral Artery Device Industry Volume (K Units) Forecast, by Application 2019 & 2032
- Table 85: Global Peripheral Artery Device Industry Revenue Million Forecast, by Device Type 2019 & 2032
- Table 86: Global Peripheral Artery Device Industry Volume K Units Forecast, by Device Type 2019 & 2032
- Table 87: Global Peripheral Artery Device Industry Revenue Million Forecast, by Country 2019 & 2032
- Table 88: Global Peripheral Artery Device Industry Volume K Units Forecast, by Country 2019 & 2032
- Table 89: China Peripheral Artery Device Industry Revenue (Million) Forecast, by Application 2019 & 2032
- Table 90: China Peripheral Artery Device Industry Volume (K Units) Forecast, by Application 2019 & 2032
- Table 91: Japan Peripheral Artery Device Industry Revenue (Million) Forecast, by Application 2019 & 2032
- Table 92: Japan Peripheral Artery Device Industry Volume (K Units) Forecast, by Application 2019 & 2032
- Table 93: India Peripheral Artery Device Industry Revenue (Million) Forecast, by Application 2019 & 2032
- Table 94: India Peripheral Artery Device Industry Volume (K Units) Forecast, by Application 2019 & 2032
- Table 95: Australia Peripheral Artery Device Industry Revenue (Million) Forecast, by Application 2019 & 2032
- Table 96: Australia Peripheral Artery Device Industry Volume (K Units) Forecast, by Application 2019 & 2032
- Table 97: South Korea Peripheral Artery Device Industry Revenue (Million) Forecast, by Application 2019 & 2032
- Table 98: South Korea Peripheral Artery Device Industry Volume (K Units) Forecast, by Application 2019 & 2032
- Table 99: Rest of Asia Pacific Peripheral Artery Device Industry Revenue (Million) Forecast, by Application 2019 & 2032
- Table 100: Rest of Asia Pacific Peripheral Artery Device Industry Volume (K Units) Forecast, by Application 2019 & 2032
- Table 101: Global Peripheral Artery Device Industry Revenue Million Forecast, by Device Type 2019 & 2032
- Table 102: Global Peripheral Artery Device Industry Volume K Units Forecast, by Device Type 2019 & 2032
- Table 103: Global Peripheral Artery Device Industry Revenue Million Forecast, by Country 2019 & 2032
- Table 104: Global Peripheral Artery Device Industry Volume K Units Forecast, by Country 2019 & 2032
- Table 105: GCC Peripheral Artery Device Industry Revenue (Million) Forecast, by Application 2019 & 2032
- Table 106: GCC Peripheral Artery Device Industry Volume (K Units) Forecast, by Application 2019 & 2032
- Table 107: South Africa Peripheral Artery Device Industry Revenue (Million) Forecast, by Application 2019 & 2032
- Table 108: South Africa Peripheral Artery Device Industry Volume (K Units) Forecast, by Application 2019 & 2032
- Table 109: Rest of Middle East and Africa Peripheral Artery Device Industry Revenue (Million) Forecast, by Application 2019 & 2032
- Table 110: Rest of Middle East and Africa Peripheral Artery Device Industry Volume (K Units) Forecast, by Application 2019 & 2032
- Table 111: Global Peripheral Artery Device Industry Revenue Million Forecast, by Device Type 2019 & 2032
- Table 112: Global Peripheral Artery Device Industry Volume K Units Forecast, by Device Type 2019 & 2032
- Table 113: Global Peripheral Artery Device Industry Revenue Million Forecast, by Country 2019 & 2032
- Table 114: Global Peripheral Artery Device Industry Volume K Units Forecast, by Country 2019 & 2032
- Table 115: Brazil Peripheral Artery Device Industry Revenue (Million) Forecast, by Application 2019 & 2032
- Table 116: Brazil Peripheral Artery Device Industry Volume (K Units) Forecast, by Application 2019 & 2032
- Table 117: Argentina Peripheral Artery Device Industry Revenue (Million) Forecast, by Application 2019 & 2032
- Table 118: Argentina Peripheral Artery Device Industry Volume (K Units) Forecast, by Application 2019 & 2032
- Table 119: Rest of South America Peripheral Artery Device Industry Revenue (Million) Forecast, by Application 2019 & 2032
- Table 120: Rest of South America Peripheral Artery Device Industry Volume (K Units) Forecast, by Application 2019 & 2032
Frequently Asked Questions
1. What is the projected Compound Annual Growth Rate (CAGR) of the Peripheral Artery Device Industry?
The projected CAGR is approximately 4.43%.
2. Which companies are prominent players in the Peripheral Artery Device Industry?
Key companies in the market include Becton Dickinson and Company, Volcano Corporation, Medtronic, Abbott Laboratories, Edward Lifesciences, Cook, Boston Scientific Corporation, Cordis Corporation.
3. What are the main segments of the Peripheral Artery Device Industry?
The market segments include Device Type.
4. Can you provide details about the market size?
The market size is estimated to be USD 13.33 Million as of 2022.
5. What are some drivers contributing to market growth?
Rising Demand for Minimally-invasive Procedures; Increase in Incidence of Peripheral Arterial Disease (PAD).
6. What are the notable trends driving market growth?
Peripheral Vascular Stents are expected to witness growth over the forecast period.
7. Are there any restraints impacting market growth?
Stringent Regulation Related to Peripheral Vascular Devices.
8. Can you provide examples of recent developments in the market?
In June 2022, Cardio Flow, Inc., a medical device company and manufacturer of minimally invasive peripheral vascular devices to treat peripheral artery disease (PAD), announced United States Food and Drug Administration (FDA) approval for the company's FreedomFlow Peripheral Guidewire.
9. What pricing options are available for accessing the report?
Pricing options include single-user, multi-user, and enterprise licenses priced at USD 4750, USD 5250, and USD 8750 respectively.
10. Is the market size provided in terms of value or volume?
The market size is provided in terms of value, measured in Million and volume, measured in K Units.
11. Are there any specific market keywords associated with the report?
Yes, the market keyword associated with the report is "Peripheral Artery Device Industry," which aids in identifying and referencing the specific market segment covered.
12. How do I determine which pricing option suits my needs best?
The pricing options vary based on user requirements and access needs. Individual users may opt for single-user licenses, while businesses requiring broader access may choose multi-user or enterprise licenses for cost-effective access to the report.
13. Are there any additional resources or data provided in the Peripheral Artery Device Industry report?
While the report offers comprehensive insights, it's advisable to review the specific contents or supplementary materials provided to ascertain if additional resources or data are available.
14. How can I stay updated on further developments or reports in the Peripheral Artery Device Industry?
To stay informed about further developments, trends, and reports in the Peripheral Artery Device Industry, consider subscribing to industry newsletters, following relevant companies and organizations, or regularly checking reputable industry news sources and publications.
Methodology
Step 1 - Identification of Relevant Samples Size from Population Database


Step 2 - Approaches for Defining Global Market Size (Value, Volume* & Price*)

Note*: In applicable scenarios
Step 3 - Data Sources
Primary Research
- Web Analytics
- Survey Reports
- Research Institute
- Latest Research Reports
- Opinion Leaders
Secondary Research
- Annual Reports
- White Paper
- Latest Press Release
- Industry Association
- Paid Database
- Investor Presentations

Step 4 - Data Triangulation
Involves using different sources of information in order to increase the validity of a study
These sources are likely to be stakeholders in a program - participants, other researchers, program staff, other community members, and so on.
Then we put all data in single framework & apply various statistical tools to find out the dynamic on the market.
During the analysis stage, feedback from the stakeholder groups would be compared to determine areas of agreement as well as areas of divergence
