

Key Insights
The global Photoelectric Distributed Acoustic Sensing (PDAS) market is poised for significant expansion, projected to reach $7.88 billion by 2025, driven by an impressive Compound Annual Growth Rate (CAGR) of 7.92% through 2033. This robust growth is primarily fueled by the increasing adoption of PDAS in critical infrastructure monitoring, particularly within the oil and gas sector for enhanced reservoir surveillance, pipeline integrity management, and early leak detection. The transportation industry also presents substantial growth opportunities, with PDAS systems being increasingly deployed for monitoring road and rail infrastructure, detecting traffic anomalies, and ensuring structural safety. Technological advancements leading to more sensitive, cost-effective, and versatile PDAS solutions are further propelling market penetration, enabling real-time, continuous monitoring of vast areas with high spatial and temporal resolution.
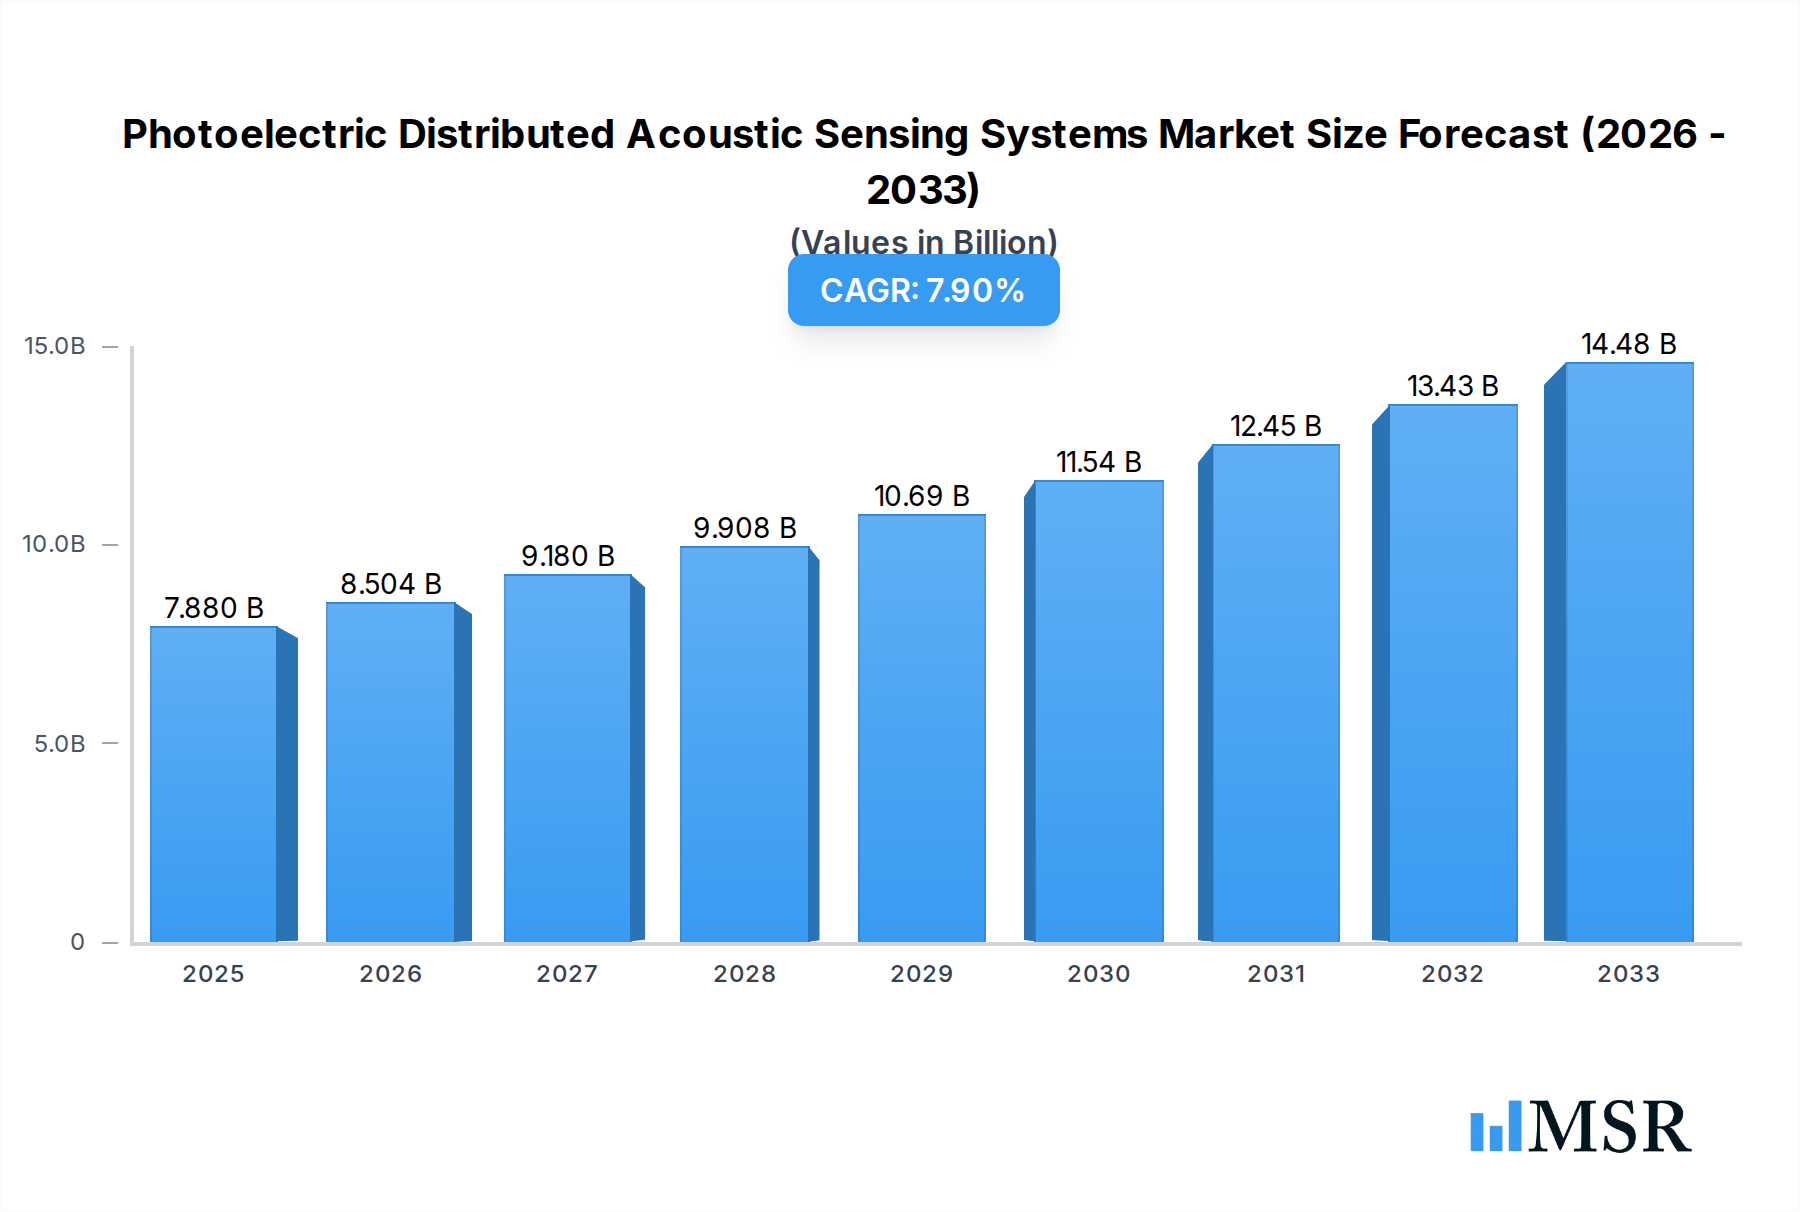
Photoelectric Distributed Acoustic Sensing Systems Market Size (In Billion)
While the market is experiencing dynamic growth, certain factors could influence its trajectory. The initial capital investment for sophisticated PDAS deployments can be a restraint for some organizations. However, the long-term cost savings and enhanced safety benefits often outweigh these upfront costs. The market is characterized by intense competition among leading players such as Halliburton, Omnisens, and Schlumberger, fostering innovation and a race to develop next-generation sensing technologies. The ongoing development of advanced signal processing algorithms and the integration of artificial intelligence with PDAS data are key trends that will shape the market, enabling more accurate data interpretation and predictive maintenance capabilities. The demand for PDAS solutions is expected to be particularly strong in regions with extensive oil and gas exploration and production activities, as well as those with aging or critical transportation infrastructure.

Photoelectric Distributed Acoustic Sensing Systems Company Market Share
This in-depth market research report delves into the dynamic landscape of Photoelectric Distributed Acoustic Sensing (DAS) Systems, offering invaluable insights for industry stakeholders. Spanning a study period from 2019 to 2033, with a base year of 2025 and a forecast period from 2025 to 2033, this report provides a definitive analysis of market concentration, key trends, growth drivers, challenges, and leading players. With an estimated market size poised to reach billions in valuation, this report is an essential resource for understanding the future of acoustic sensing technology.
Photoelectric Distributed Acoustic Sensing Systems Market Concentration & Dynamics
The Photoelectric Distributed Acoustic Sensing Systems market exhibits a moderate to high level of concentration, with several key players dominating the innovation and deployment landscape. Companies such as Halliburton, Omnisens, Future Fibre Technologies (Ava Group), Schlumberger, Yokogawa, and Baker Hughes (GE) are at the forefront, driving technological advancements and expanding market reach. The innovation ecosystem is characterized by significant R&D investments in improving sensitivity, resolution, and data processing capabilities for advanced fiber optic sensing. Regulatory frameworks, while evolving, are generally supportive, focusing on safety and performance standards in critical infrastructure monitoring. Substitute products, such as traditional vibration sensors, exist but struggle to match the spatial resolution and continuous monitoring capabilities of DAS. End-user trends are increasingly demanding integrated solutions for real-time threat detection and operational optimization. Mergers and acquisitions (M&A) activities are a notable dynamic, with a predicted XX number of significant deals projected to reshape market share and technological portfolios over the forecast period. For instance, the acquisition of smaller, specialized DAS providers by larger industrial conglomerates is expected to accelerate consolidation.
Photoelectric Distributed Acoustic Sensing Systems Industry Insights & Trends
The Photoelectric Distributed Acoustic Sensing Systems industry is poised for substantial growth, driven by increasing demand for advanced monitoring solutions across critical infrastructure and industrial applications. The market size is projected to expand from an estimated $X billion in the base year 2025 to over $XX billion by 2033, exhibiting a Compound Annual Growth Rate (CAGR) of approximately XX%. Technological disruptions, including advancements in interrogator units, fiber optic cable sensitivity, and AI-powered data analytics, are key growth drivers. These innovations enable higher fidelity acoustic data acquisition, allowing for more precise detection of events like leaks, intrusions, and seismic activity. Evolving consumer behaviors are characterized by a growing preference for integrated, real-time monitoring systems that enhance safety, security, and operational efficiency. The digitalization trend across industries further fuels the adoption of DAS for predictive maintenance and remote asset management. The integration of DAS with other sensing technologies, such as thermal and strain sensing, is also emerging as a significant trend, offering a more comprehensive understanding of asset health and environmental conditions. The increasing focus on environmental protection and compliance is also a significant driver, as DAS systems provide robust tools for monitoring pipelines, wellbores, and sensitive ecosystems.
Key Markets & Segments Leading Photoelectric Distributed Acoustic Sensing Systems
The Oil and Gas application segment is currently the dominant force in the Photoelectric Distributed Acoustic Sensing Systems market, largely due to the inherent need for continuous monitoring of vast pipeline networks, offshore platforms, and wellbore integrity. The extensive infrastructure in this sector, coupled with stringent safety and environmental regulations, necessitates robust and reliable sensing solutions.
- Drivers in Oil and Gas:
- Infrastructure Longevity & Maintenance: Aging oil and gas infrastructure requires constant surveillance for leaks, structural integrity issues, and unauthorized access.
- Environmental Compliance: Strict regulations regarding leak detection and prevention drive the adoption of advanced monitoring technologies.
- Operational Efficiency: Real-time data from DAS systems enables proactive maintenance, reduces downtime, and optimizes production.
- Security Concerns: Protecting valuable assets from sabotage or theft is a critical concern addressed by DAS.
The Transportation sector, encompassing rail infrastructure, roadways, and tunneling, is emerging as a significant growth area. The increasing complexity of transportation networks, coupled with rising security and safety concerns, is fueling the adoption of DAS for monitoring ground movement, structural stability, and potential threats.
- Drivers in Transportation:
- Infrastructure Monitoring: Ensuring the structural integrity of bridges, tunnels, and railway tracks.
- Security Enhancement: Detecting unauthorized access or suspicious activities along transportation corridors.
- Traffic Management: Utilizing acoustic data for traffic flow analysis and incident detection.
- Geotechnical Stability: Monitoring ground vibrations and potential landslides affecting transportation routes.
Within the Types of DAS systems, Longitudinal Wave Acoustic Sensing currently holds a larger market share due to its widespread application in detecting seismic events, fluid flow, and general vibrations. However, Transverse Wave Acoustic Sensing is gaining traction, particularly for its ability to detect shear waves, which can provide more detailed information about the physical state of the fiber and surrounding environment, opening up new applications in structural health monitoring and leak detection.
Photoelectric Distributed Acoustic Sensing Systems Product Developments
Recent product developments in Photoelectric Distributed Acoustic Sensing Systems are characterized by enhanced sensitivity, increased spatial resolution, and improved data processing capabilities. Innovations include the development of miniaturized interrogator units, advanced signal processing algorithms for noise reduction and event classification, and the integration of DAS with machine learning for predictive analytics. Companies are also focusing on ruggedized hardware for deployment in harsh environments and the development of specialized fiber optic cables optimized for specific sensing applications. These advancements are crucial for expanding the market relevance of DAS into new sectors and for reinforcing its dominance in existing applications by offering superior performance and cost-effectiveness.
Challenges in the Photoelectric Distributed Acoustic Sensing Systems Market
Despite robust growth, the Photoelectric Distributed Acoustic Sensing Systems market faces several challenges. High initial investment costs for advanced DAS systems can be a barrier for smaller enterprises. Technical expertise required for installation, calibration, and data interpretation can also limit widespread adoption. Supply chain disruptions affecting the availability of specialized fiber optic cables and optical components can impact project timelines and costs. Furthermore, standardization efforts across different DAS technologies and data formats are still in their nascent stages, posing integration challenges for diverse applications. Cybersecurity concerns related to data transmission and storage also require significant attention as more critical infrastructure relies on these systems.
Forces Driving Photoelectric Distributed Acoustic Sensing Systems Growth
Several forces are driving the growth of Photoelectric Distributed Acoustic Sensing Systems. Technological advancements in fiber optics and laser technology are continuously improving the performance and reducing the cost of DAS systems, making them more accessible. Increasing global investments in infrastructure development, particularly in oil and gas, transportation, and utilities, create a sustained demand for monitoring solutions. Growing awareness of safety and environmental regulations worldwide compels industries to adopt advanced leak detection and security monitoring systems. The digital transformation and the rise of the Industrial Internet of Things (IIoT) are further accelerating the adoption of DAS as a crucial component for real-time data acquisition and intelligent decision-making.
Long-term Growth Catalysts in the Photoelectric Distributed Acoustic Sensing Systems Market
Long-term growth catalysts for Photoelectric Distributed Acoustic Sensing Systems are rooted in continuous innovation and expanding application horizons. The development of multi-parameter sensing capabilities, integrating acoustic sensing with temperature, strain, and vibration monitoring on a single fiber, offers comprehensive asset health assessment. Advancements in artificial intelligence and machine learning algorithms will enable more sophisticated data analysis, leading to predictive maintenance and early anomaly detection. Expansion into emerging markets with significant infrastructure development needs, such as renewable energy projects and smart cities, presents substantial growth opportunities. Furthermore, strategic partnerships and collaborations between DAS providers, infrastructure operators, and technology integrators will foster wider adoption and the development of tailored solutions.
Emerging Opportunities in Photoelectric Distributed Acoustic Sensing Systems
Emerging opportunities in the Photoelectric Distributed Acoustic Sensing Systems market are diverse and promising. The expansion of DAS into renewable energy sectors, such as wind turbine monitoring for structural integrity and solar farm security, offers significant potential. The increasing focus on cybersecurity is driving demand for DAS in critical infrastructure protection and perimeter security applications. The development of cost-effective, portable DAS solutions will open doors for smaller-scale applications and the adoption by industries with tighter budgets. Furthermore, the integration of DAS with blockchain technology for secure and verifiable data logging presents an innovative opportunity for enhanced trust and traceability. The growing demand for geotechnical monitoring in urban development and mining operations is also a significant emerging area.
Leading Players in the Photoelectric Distributed Acoustic Sensing Systems Sector
- Halliburton
- Omnisens
- Future Fibre Technologies (Ava Group)
- Schlumberger
- Yokogawa
- Baker Hughes (GE)
- Hifi Engineering
- Silixa
- Ziebel
- AP Sensing
- Banweaver
- Fotech Solutions
- Optasense
- FibrisTerre
- OZ Optics
- Pruett Tech
- Optellios
- Polus-ST
- Luna Innovations
Key Milestones in Photoelectric Distributed Acoustic Sensing Systems Industry
- 2019: Significant advancements in interrogator unit speed and sensitivity, enabling higher spatial resolution for DAS.
- 2020: Increased adoption of DAS for pipeline integrity monitoring in response to environmental concerns.
- 2021: Development of AI-powered algorithms for automated anomaly detection in acoustic data.
- 2022: Expansion of DAS applications into the transportation sector for railway and tunnel monitoring.
- 2023: Introduction of integrated DAS solutions combining acoustic, temperature, and strain sensing.
- 2024: Growing interest in DAS for perimeter security and critical infrastructure protection.
Strategic Outlook for Photoelectric Distributed Acoustic Sensing Systems Market
The strategic outlook for the Photoelectric Distributed Acoustic Sensing Systems market is overwhelmingly positive, characterized by sustained growth and continuous innovation. Key growth accelerators include the ongoing digital transformation across industries, the escalating demand for enhanced safety and security, and stringent regulatory mandates. Future market potential will be driven by the development of more intelligent, integrated, and cost-effective DAS solutions. Strategic opportunities lie in expanding into new geographic regions with developing infrastructure, forging stronger partnerships with end-users to co-create tailored solutions, and focusing on R&D to unlock novel applications in sectors like smart grids, healthcare monitoring, and environmental surveillance. The market is expected to witness further consolidation and specialization, leading to more robust and comprehensive offerings.
Photoelectric Distributed Acoustic Sensing Systems Segmentation
-
1. Application
- 1.1. Oil and Gas
- 1.2. Transportation
- 1.3. Others
-
2. Types
- 2.1. Longitudinal Wave Acoustic Sensing
- 2.2. Transverse Wave Acoustic Sensing
Photoelectric Distributed Acoustic Sensing Systems Segmentation By Geography
-
1. North America
- 1.1. United States
- 1.2. Canada
- 1.3. Mexico
-
2. South America
- 2.1. Brazil
- 2.2. Argentina
- 2.3. Rest of South America
-
3. Europe
- 3.1. United Kingdom
- 3.2. Germany
- 3.3. France
- 3.4. Italy
- 3.5. Spain
- 3.6. Russia
- 3.7. Benelux
- 3.8. Nordics
- 3.9. Rest of Europe
-
4. Middle East & Africa
- 4.1. Turkey
- 4.2. Israel
- 4.3. GCC
- 4.4. North Africa
- 4.5. South Africa
- 4.6. Rest of Middle East & Africa
-
5. Asia Pacific
- 5.1. China
- 5.2. India
- 5.3. Japan
- 5.4. South Korea
- 5.5. ASEAN
- 5.6. Oceania
- 5.7. Rest of Asia Pacific
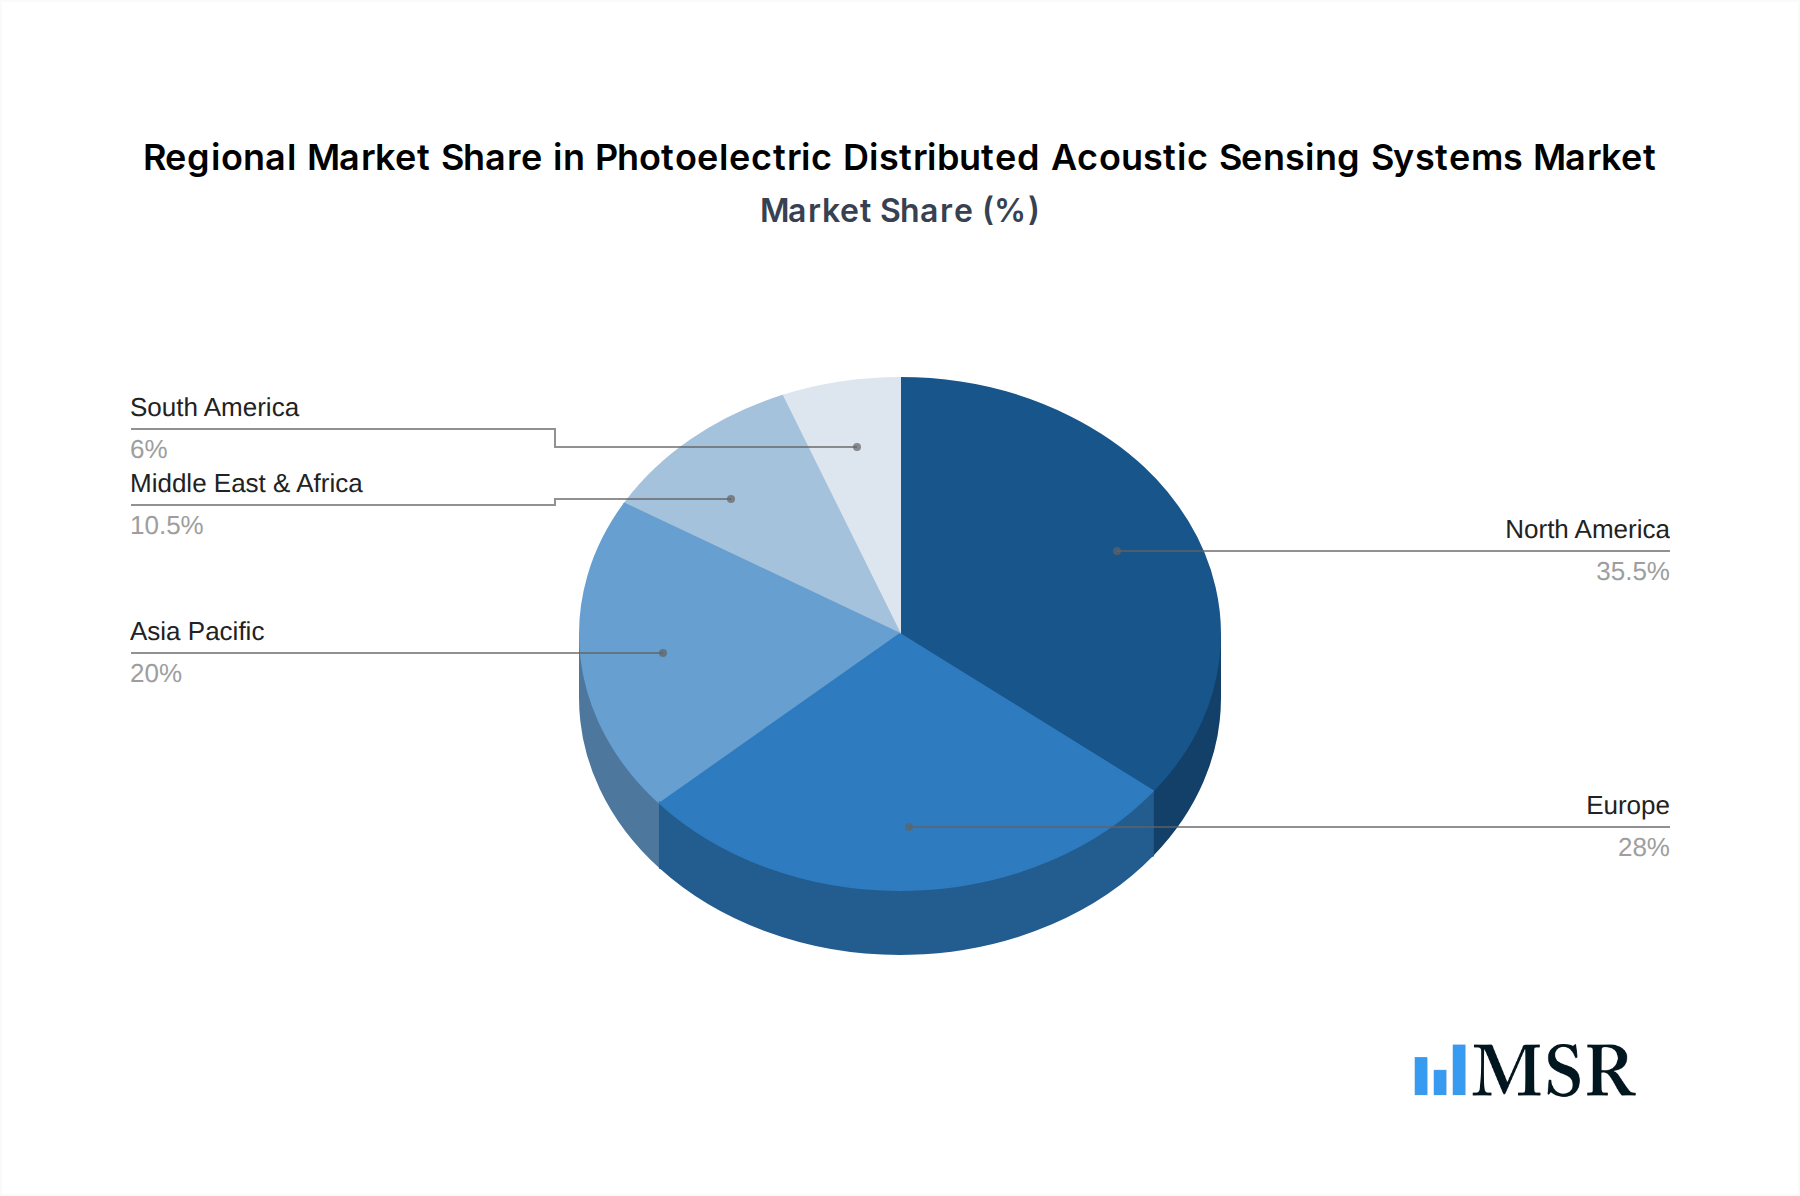
Photoelectric Distributed Acoustic Sensing Systems Regional Market Share
Geographic Coverage of Photoelectric Distributed Acoustic Sensing Systems
Photoelectric Distributed Acoustic Sensing Systems REPORT HIGHLIGHTS
| Aspects | Details |
|---|---|
| Study Period | 2020-2034 |
| Base Year | 2025 |
| Estimated Year | 2026 |
| Forecast Period | 2026-2034 |
| Historical Period | 2020-2025 |
| Growth Rate | CAGR of 7.92% from 2020-2034 |
| Segmentation |
|
Table of Contents
- 1. Introduction
- 1.1. Research Scope
- 1.2. Market Segmentation
- 1.3. Research Objective
- 1.4. Definitions and Assumptions
- 2. Executive Summary
- 2.1. Market Snapshot
- 3. Market Dynamics
- 3.1. Market Drivers
- 3.2. Market Restrains
- 3.3. Market Trends
- 3.4. Market Opportunities
- 4. Market Factor Analysis
- 4.1. Porters Five Forces
- 4.1.1. Bargaining Power of Suppliers
- 4.1.2. Bargaining Power of Buyers
- 4.1.3. Threat of New Entrants
- 4.1.4. Threat of Substitutes
- 4.1.5. Competitive Rivalry
- 4.2. PESTEL analysis
- 4.3. BCG Analysis
- 4.3.1. Stars (High Growth, High Market Share)
- 4.3.2. Cash Cows (Low Growth, High Market Share)
- 4.3.3. Question Mark (High Growth, Low Market Share)
- 4.3.4. Dogs (Low Growth, Low Market Share)
- 4.4. Ansoff Matrix Analysis
- 4.5. Supply Chain Analysis
- 4.6. Regulatory Landscape
- 4.7. Current Market Potential and Opportunity Assessment (TAM–SAM–SOM Framework)
- 4.8. MSR Analyst Note
- 4.1. Porters Five Forces
- 5. Market Analysis, Insights and Forecast 2021-2033
- 5.1. Market Analysis, Insights and Forecast - by Application
- 5.1.1. Oil and Gas
- 5.1.2. Transportation
- 5.1.3. Others
- 5.2. Market Analysis, Insights and Forecast - by Types
- 5.2.1. Longitudinal Wave Acoustic Sensing
- 5.2.2. Transverse Wave Acoustic Sensing
- 5.3. Market Analysis, Insights and Forecast - by Region
- 5.3.1. North America
- 5.3.2. South America
- 5.3.3. Europe
- 5.3.4. Middle East & Africa
- 5.3.5. Asia Pacific
- 5.1. Market Analysis, Insights and Forecast - by Application
- 6. Global Photoelectric Distributed Acoustic Sensing Systems Analysis, Insights and Forecast, 2021-2033
- 6.1. Market Analysis, Insights and Forecast - by Application
- 6.1.1. Oil and Gas
- 6.1.2. Transportation
- 6.1.3. Others
- 6.2. Market Analysis, Insights and Forecast - by Types
- 6.2.1. Longitudinal Wave Acoustic Sensing
- 6.2.2. Transverse Wave Acoustic Sensing
- 6.1. Market Analysis, Insights and Forecast - by Application
- 7. North America Photoelectric Distributed Acoustic Sensing Systems Analysis, Insights and Forecast, 2020-2032
- 7.1. Market Analysis, Insights and Forecast - by Application
- 7.1.1. Oil and Gas
- 7.1.2. Transportation
- 7.1.3. Others
- 7.2. Market Analysis, Insights and Forecast - by Types
- 7.2.1. Longitudinal Wave Acoustic Sensing
- 7.2.2. Transverse Wave Acoustic Sensing
- 7.1. Market Analysis, Insights and Forecast - by Application
- 8. South America Photoelectric Distributed Acoustic Sensing Systems Analysis, Insights and Forecast, 2020-2032
- 8.1. Market Analysis, Insights and Forecast - by Application
- 8.1.1. Oil and Gas
- 8.1.2. Transportation
- 8.1.3. Others
- 8.2. Market Analysis, Insights and Forecast - by Types
- 8.2.1. Longitudinal Wave Acoustic Sensing
- 8.2.2. Transverse Wave Acoustic Sensing
- 8.1. Market Analysis, Insights and Forecast - by Application
- 9. Europe Photoelectric Distributed Acoustic Sensing Systems Analysis, Insights and Forecast, 2020-2032
- 9.1. Market Analysis, Insights and Forecast - by Application
- 9.1.1. Oil and Gas
- 9.1.2. Transportation
- 9.1.3. Others
- 9.2. Market Analysis, Insights and Forecast - by Types
- 9.2.1. Longitudinal Wave Acoustic Sensing
- 9.2.2. Transverse Wave Acoustic Sensing
- 9.1. Market Analysis, Insights and Forecast - by Application
- 10. Middle East & Africa Photoelectric Distributed Acoustic Sensing Systems Analysis, Insights and Forecast, 2020-2032
- 10.1. Market Analysis, Insights and Forecast - by Application
- 10.1.1. Oil and Gas
- 10.1.2. Transportation
- 10.1.3. Others
- 10.2. Market Analysis, Insights and Forecast - by Types
- 10.2.1. Longitudinal Wave Acoustic Sensing
- 10.2.2. Transverse Wave Acoustic Sensing
- 10.1. Market Analysis, Insights and Forecast - by Application
- 11. Asia Pacific Photoelectric Distributed Acoustic Sensing Systems Analysis, Insights and Forecast, 2020-2032
- 11.1. Market Analysis, Insights and Forecast - by Application
- 11.1.1. Oil and Gas
- 11.1.2. Transportation
- 11.1.3. Others
- 11.2. Market Analysis, Insights and Forecast - by Types
- 11.2.1. Longitudinal Wave Acoustic Sensing
- 11.2.2. Transverse Wave Acoustic Sensing
- 11.1. Market Analysis, Insights and Forecast - by Application
- 12. Competitive Analysis
- 12.1. Company Profiles
- 12.1.1 Halliburton
- 12.1.1.1. Company Overview
- 12.1.1.2. Products
- 12.1.1.3. Company Financials
- 12.1.1.4. SWOT Analysis
- 12.1.2 Omnisens
- 12.1.2.1. Company Overview
- 12.1.2.2. Products
- 12.1.2.3. Company Financials
- 12.1.2.4. SWOT Analysis
- 12.1.3 Future Fibre Technologies (Ava Group)
- 12.1.3.1. Company Overview
- 12.1.3.2. Products
- 12.1.3.3. Company Financials
- 12.1.3.4. SWOT Analysis
- 12.1.4 Schlumberger
- 12.1.4.1. Company Overview
- 12.1.4.2. Products
- 12.1.4.3. Company Financials
- 12.1.4.4. SWOT Analysis
- 12.1.5 Yokogawa
- 12.1.5.1. Company Overview
- 12.1.5.2. Products
- 12.1.5.3. Company Financials
- 12.1.5.4. SWOT Analysis
- 12.1.6 Baker Hughes (GE)
- 12.1.6.1. Company Overview
- 12.1.6.2. Products
- 12.1.6.3. Company Financials
- 12.1.6.4. SWOT Analysis
- 12.1.7 Hifi Engineering
- 12.1.7.1. Company Overview
- 12.1.7.2. Products
- 12.1.7.3. Company Financials
- 12.1.7.4. SWOT Analysis
- 12.1.8 Silixa
- 12.1.8.1. Company Overview
- 12.1.8.2. Products
- 12.1.8.3. Company Financials
- 12.1.8.4. SWOT Analysis
- 12.1.9 Ziebel
- 12.1.9.1. Company Overview
- 12.1.9.2. Products
- 12.1.9.3. Company Financials
- 12.1.9.4. SWOT Analysis
- 12.1.10 AP Sensing
- 12.1.10.1. Company Overview
- 12.1.10.2. Products
- 12.1.10.3. Company Financials
- 12.1.10.4. SWOT Analysis
- 12.1.11 Banweaver
- 12.1.11.1. Company Overview
- 12.1.11.2. Products
- 12.1.11.3. Company Financials
- 12.1.11.4. SWOT Analysis
- 12.1.12 Fotech Solutions
- 12.1.12.1. Company Overview
- 12.1.12.2. Products
- 12.1.12.3. Company Financials
- 12.1.12.4. SWOT Analysis
- 12.1.13 Optasense
- 12.1.13.1. Company Overview
- 12.1.13.2. Products
- 12.1.13.3. Company Financials
- 12.1.13.4. SWOT Analysis
- 12.1.14 FibrisTerre
- 12.1.14.1. Company Overview
- 12.1.14.2. Products
- 12.1.14.3. Company Financials
- 12.1.14.4. SWOT Analysis
- 12.1.15 OZ Optics
- 12.1.15.1. Company Overview
- 12.1.15.2. Products
- 12.1.15.3. Company Financials
- 12.1.15.4. SWOT Analysis
- 12.1.16 Pruett Tech
- 12.1.16.1. Company Overview
- 12.1.16.2. Products
- 12.1.16.3. Company Financials
- 12.1.16.4. SWOT Analysis
- 12.1.17 Optellios
- 12.1.17.1. Company Overview
- 12.1.17.2. Products
- 12.1.17.3. Company Financials
- 12.1.17.4. SWOT Analysis
- 12.1.18 Polus-ST
- 12.1.18.1. Company Overview
- 12.1.18.2. Products
- 12.1.18.3. Company Financials
- 12.1.18.4. SWOT Analysis
- 12.1.19 Luna Innovations
- 12.1.19.1. Company Overview
- 12.1.19.2. Products
- 12.1.19.3. Company Financials
- 12.1.19.4. SWOT Analysis
- 12.1.1 Halliburton
- 12.2. Market Entropy
- 12.2.1 Company's Key Areas Served
- 12.2.2 Recent Developments
- 12.3. Company Market Share Analysis 2025
- 12.3.1 Top 5 Companies Market Share Analysis
- 12.3.2 Top 3 Companies Market Share Analysis
- 12.4. List of Potential Customers
- 13. Research Methodology
List of Figures
- Figure 1: Global Photoelectric Distributed Acoustic Sensing Systems Revenue Breakdown (billion, %) by Region 2025 & 2033
- Figure 2: Global Photoelectric Distributed Acoustic Sensing Systems Volume Breakdown (K, %) by Region 2025 & 2033
- Figure 3: North America Photoelectric Distributed Acoustic Sensing Systems Revenue (billion), by Application 2025 & 2033
- Figure 4: North America Photoelectric Distributed Acoustic Sensing Systems Volume (K), by Application 2025 & 2033
- Figure 5: North America Photoelectric Distributed Acoustic Sensing Systems Revenue Share (%), by Application 2025 & 2033
- Figure 6: North America Photoelectric Distributed Acoustic Sensing Systems Volume Share (%), by Application 2025 & 2033
- Figure 7: North America Photoelectric Distributed Acoustic Sensing Systems Revenue (billion), by Types 2025 & 2033
- Figure 8: North America Photoelectric Distributed Acoustic Sensing Systems Volume (K), by Types 2025 & 2033
- Figure 9: North America Photoelectric Distributed Acoustic Sensing Systems Revenue Share (%), by Types 2025 & 2033
- Figure 10: North America Photoelectric Distributed Acoustic Sensing Systems Volume Share (%), by Types 2025 & 2033
- Figure 11: North America Photoelectric Distributed Acoustic Sensing Systems Revenue (billion), by Country 2025 & 2033
- Figure 12: North America Photoelectric Distributed Acoustic Sensing Systems Volume (K), by Country 2025 & 2033
- Figure 13: North America Photoelectric Distributed Acoustic Sensing Systems Revenue Share (%), by Country 2025 & 2033
- Figure 14: North America Photoelectric Distributed Acoustic Sensing Systems Volume Share (%), by Country 2025 & 2033
- Figure 15: South America Photoelectric Distributed Acoustic Sensing Systems Revenue (billion), by Application 2025 & 2033
- Figure 16: South America Photoelectric Distributed Acoustic Sensing Systems Volume (K), by Application 2025 & 2033
- Figure 17: South America Photoelectric Distributed Acoustic Sensing Systems Revenue Share (%), by Application 2025 & 2033
- Figure 18: South America Photoelectric Distributed Acoustic Sensing Systems Volume Share (%), by Application 2025 & 2033
- Figure 19: South America Photoelectric Distributed Acoustic Sensing Systems Revenue (billion), by Types 2025 & 2033
- Figure 20: South America Photoelectric Distributed Acoustic Sensing Systems Volume (K), by Types 2025 & 2033
- Figure 21: South America Photoelectric Distributed Acoustic Sensing Systems Revenue Share (%), by Types 2025 & 2033
- Figure 22: South America Photoelectric Distributed Acoustic Sensing Systems Volume Share (%), by Types 2025 & 2033
- Figure 23: South America Photoelectric Distributed Acoustic Sensing Systems Revenue (billion), by Country 2025 & 2033
- Figure 24: South America Photoelectric Distributed Acoustic Sensing Systems Volume (K), by Country 2025 & 2033
- Figure 25: South America Photoelectric Distributed Acoustic Sensing Systems Revenue Share (%), by Country 2025 & 2033
- Figure 26: South America Photoelectric Distributed Acoustic Sensing Systems Volume Share (%), by Country 2025 & 2033
- Figure 27: Europe Photoelectric Distributed Acoustic Sensing Systems Revenue (billion), by Application 2025 & 2033
- Figure 28: Europe Photoelectric Distributed Acoustic Sensing Systems Volume (K), by Application 2025 & 2033
- Figure 29: Europe Photoelectric Distributed Acoustic Sensing Systems Revenue Share (%), by Application 2025 & 2033
- Figure 30: Europe Photoelectric Distributed Acoustic Sensing Systems Volume Share (%), by Application 2025 & 2033
- Figure 31: Europe Photoelectric Distributed Acoustic Sensing Systems Revenue (billion), by Types 2025 & 2033
- Figure 32: Europe Photoelectric Distributed Acoustic Sensing Systems Volume (K), by Types 2025 & 2033
- Figure 33: Europe Photoelectric Distributed Acoustic Sensing Systems Revenue Share (%), by Types 2025 & 2033
- Figure 34: Europe Photoelectric Distributed Acoustic Sensing Systems Volume Share (%), by Types 2025 & 2033
- Figure 35: Europe Photoelectric Distributed Acoustic Sensing Systems Revenue (billion), by Country 2025 & 2033
- Figure 36: Europe Photoelectric Distributed Acoustic Sensing Systems Volume (K), by Country 2025 & 2033
- Figure 37: Europe Photoelectric Distributed Acoustic Sensing Systems Revenue Share (%), by Country 2025 & 2033
- Figure 38: Europe Photoelectric Distributed Acoustic Sensing Systems Volume Share (%), by Country 2025 & 2033
- Figure 39: Middle East & Africa Photoelectric Distributed Acoustic Sensing Systems Revenue (billion), by Application 2025 & 2033
- Figure 40: Middle East & Africa Photoelectric Distributed Acoustic Sensing Systems Volume (K), by Application 2025 & 2033
- Figure 41: Middle East & Africa Photoelectric Distributed Acoustic Sensing Systems Revenue Share (%), by Application 2025 & 2033
- Figure 42: Middle East & Africa Photoelectric Distributed Acoustic Sensing Systems Volume Share (%), by Application 2025 & 2033
- Figure 43: Middle East & Africa Photoelectric Distributed Acoustic Sensing Systems Revenue (billion), by Types 2025 & 2033
- Figure 44: Middle East & Africa Photoelectric Distributed Acoustic Sensing Systems Volume (K), by Types 2025 & 2033
- Figure 45: Middle East & Africa Photoelectric Distributed Acoustic Sensing Systems Revenue Share (%), by Types 2025 & 2033
- Figure 46: Middle East & Africa Photoelectric Distributed Acoustic Sensing Systems Volume Share (%), by Types 2025 & 2033
- Figure 47: Middle East & Africa Photoelectric Distributed Acoustic Sensing Systems Revenue (billion), by Country 2025 & 2033
- Figure 48: Middle East & Africa Photoelectric Distributed Acoustic Sensing Systems Volume (K), by Country 2025 & 2033
- Figure 49: Middle East & Africa Photoelectric Distributed Acoustic Sensing Systems Revenue Share (%), by Country 2025 & 2033
- Figure 50: Middle East & Africa Photoelectric Distributed Acoustic Sensing Systems Volume Share (%), by Country 2025 & 2033
- Figure 51: Asia Pacific Photoelectric Distributed Acoustic Sensing Systems Revenue (billion), by Application 2025 & 2033
- Figure 52: Asia Pacific Photoelectric Distributed Acoustic Sensing Systems Volume (K), by Application 2025 & 2033
- Figure 53: Asia Pacific Photoelectric Distributed Acoustic Sensing Systems Revenue Share (%), by Application 2025 & 2033
- Figure 54: Asia Pacific Photoelectric Distributed Acoustic Sensing Systems Volume Share (%), by Application 2025 & 2033
- Figure 55: Asia Pacific Photoelectric Distributed Acoustic Sensing Systems Revenue (billion), by Types 2025 & 2033
- Figure 56: Asia Pacific Photoelectric Distributed Acoustic Sensing Systems Volume (K), by Types 2025 & 2033
- Figure 57: Asia Pacific Photoelectric Distributed Acoustic Sensing Systems Revenue Share (%), by Types 2025 & 2033
- Figure 58: Asia Pacific Photoelectric Distributed Acoustic Sensing Systems Volume Share (%), by Types 2025 & 2033
- Figure 59: Asia Pacific Photoelectric Distributed Acoustic Sensing Systems Revenue (billion), by Country 2025 & 2033
- Figure 60: Asia Pacific Photoelectric Distributed Acoustic Sensing Systems Volume (K), by Country 2025 & 2033
- Figure 61: Asia Pacific Photoelectric Distributed Acoustic Sensing Systems Revenue Share (%), by Country 2025 & 2033
- Figure 62: Asia Pacific Photoelectric Distributed Acoustic Sensing Systems Volume Share (%), by Country 2025 & 2033
List of Tables
- Table 1: Global Photoelectric Distributed Acoustic Sensing Systems Revenue billion Forecast, by Application 2020 & 2033
- Table 2: Global Photoelectric Distributed Acoustic Sensing Systems Volume K Forecast, by Application 2020 & 2033
- Table 3: Global Photoelectric Distributed Acoustic Sensing Systems Revenue billion Forecast, by Types 2020 & 2033
- Table 4: Global Photoelectric Distributed Acoustic Sensing Systems Volume K Forecast, by Types 2020 & 2033
- Table 5: Global Photoelectric Distributed Acoustic Sensing Systems Revenue billion Forecast, by Region 2020 & 2033
- Table 6: Global Photoelectric Distributed Acoustic Sensing Systems Volume K Forecast, by Region 2020 & 2033
- Table 7: Global Photoelectric Distributed Acoustic Sensing Systems Revenue billion Forecast, by Application 2020 & 2033
- Table 8: Global Photoelectric Distributed Acoustic Sensing Systems Volume K Forecast, by Application 2020 & 2033
- Table 9: Global Photoelectric Distributed Acoustic Sensing Systems Revenue billion Forecast, by Types 2020 & 2033
- Table 10: Global Photoelectric Distributed Acoustic Sensing Systems Volume K Forecast, by Types 2020 & 2033
- Table 11: Global Photoelectric Distributed Acoustic Sensing Systems Revenue billion Forecast, by Country 2020 & 2033
- Table 12: Global Photoelectric Distributed Acoustic Sensing Systems Volume K Forecast, by Country 2020 & 2033
- Table 13: United States Photoelectric Distributed Acoustic Sensing Systems Revenue (billion) Forecast, by Application 2020 & 2033
- Table 14: United States Photoelectric Distributed Acoustic Sensing Systems Volume (K) Forecast, by Application 2020 & 2033
- Table 15: Canada Photoelectric Distributed Acoustic Sensing Systems Revenue (billion) Forecast, by Application 2020 & 2033
- Table 16: Canada Photoelectric Distributed Acoustic Sensing Systems Volume (K) Forecast, by Application 2020 & 2033
- Table 17: Mexico Photoelectric Distributed Acoustic Sensing Systems Revenue (billion) Forecast, by Application 2020 & 2033
- Table 18: Mexico Photoelectric Distributed Acoustic Sensing Systems Volume (K) Forecast, by Application 2020 & 2033
- Table 19: Global Photoelectric Distributed Acoustic Sensing Systems Revenue billion Forecast, by Application 2020 & 2033
- Table 20: Global Photoelectric Distributed Acoustic Sensing Systems Volume K Forecast, by Application 2020 & 2033
- Table 21: Global Photoelectric Distributed Acoustic Sensing Systems Revenue billion Forecast, by Types 2020 & 2033
- Table 22: Global Photoelectric Distributed Acoustic Sensing Systems Volume K Forecast, by Types 2020 & 2033
- Table 23: Global Photoelectric Distributed Acoustic Sensing Systems Revenue billion Forecast, by Country 2020 & 2033
- Table 24: Global Photoelectric Distributed Acoustic Sensing Systems Volume K Forecast, by Country 2020 & 2033
- Table 25: Brazil Photoelectric Distributed Acoustic Sensing Systems Revenue (billion) Forecast, by Application 2020 & 2033
- Table 26: Brazil Photoelectric Distributed Acoustic Sensing Systems Volume (K) Forecast, by Application 2020 & 2033
- Table 27: Argentina Photoelectric Distributed Acoustic Sensing Systems Revenue (billion) Forecast, by Application 2020 & 2033
- Table 28: Argentina Photoelectric Distributed Acoustic Sensing Systems Volume (K) Forecast, by Application 2020 & 2033
- Table 29: Rest of South America Photoelectric Distributed Acoustic Sensing Systems Revenue (billion) Forecast, by Application 2020 & 2033
- Table 30: Rest of South America Photoelectric Distributed Acoustic Sensing Systems Volume (K) Forecast, by Application 2020 & 2033
- Table 31: Global Photoelectric Distributed Acoustic Sensing Systems Revenue billion Forecast, by Application 2020 & 2033
- Table 32: Global Photoelectric Distributed Acoustic Sensing Systems Volume K Forecast, by Application 2020 & 2033
- Table 33: Global Photoelectric Distributed Acoustic Sensing Systems Revenue billion Forecast, by Types 2020 & 2033
- Table 34: Global Photoelectric Distributed Acoustic Sensing Systems Volume K Forecast, by Types 2020 & 2033
- Table 35: Global Photoelectric Distributed Acoustic Sensing Systems Revenue billion Forecast, by Country 2020 & 2033
- Table 36: Global Photoelectric Distributed Acoustic Sensing Systems Volume K Forecast, by Country 2020 & 2033
- Table 37: United Kingdom Photoelectric Distributed Acoustic Sensing Systems Revenue (billion) Forecast, by Application 2020 & 2033
- Table 38: United Kingdom Photoelectric Distributed Acoustic Sensing Systems Volume (K) Forecast, by Application 2020 & 2033
- Table 39: Germany Photoelectric Distributed Acoustic Sensing Systems Revenue (billion) Forecast, by Application 2020 & 2033
- Table 40: Germany Photoelectric Distributed Acoustic Sensing Systems Volume (K) Forecast, by Application 2020 & 2033
- Table 41: France Photoelectric Distributed Acoustic Sensing Systems Revenue (billion) Forecast, by Application 2020 & 2033
- Table 42: France Photoelectric Distributed Acoustic Sensing Systems Volume (K) Forecast, by Application 2020 & 2033
- Table 43: Italy Photoelectric Distributed Acoustic Sensing Systems Revenue (billion) Forecast, by Application 2020 & 2033
- Table 44: Italy Photoelectric Distributed Acoustic Sensing Systems Volume (K) Forecast, by Application 2020 & 2033
- Table 45: Spain Photoelectric Distributed Acoustic Sensing Systems Revenue (billion) Forecast, by Application 2020 & 2033
- Table 46: Spain Photoelectric Distributed Acoustic Sensing Systems Volume (K) Forecast, by Application 2020 & 2033
- Table 47: Russia Photoelectric Distributed Acoustic Sensing Systems Revenue (billion) Forecast, by Application 2020 & 2033
- Table 48: Russia Photoelectric Distributed Acoustic Sensing Systems Volume (K) Forecast, by Application 2020 & 2033
- Table 49: Benelux Photoelectric Distributed Acoustic Sensing Systems Revenue (billion) Forecast, by Application 2020 & 2033
- Table 50: Benelux Photoelectric Distributed Acoustic Sensing Systems Volume (K) Forecast, by Application 2020 & 2033
- Table 51: Nordics Photoelectric Distributed Acoustic Sensing Systems Revenue (billion) Forecast, by Application 2020 & 2033
- Table 52: Nordics Photoelectric Distributed Acoustic Sensing Systems Volume (K) Forecast, by Application 2020 & 2033
- Table 53: Rest of Europe Photoelectric Distributed Acoustic Sensing Systems Revenue (billion) Forecast, by Application 2020 & 2033
- Table 54: Rest of Europe Photoelectric Distributed Acoustic Sensing Systems Volume (K) Forecast, by Application 2020 & 2033
- Table 55: Global Photoelectric Distributed Acoustic Sensing Systems Revenue billion Forecast, by Application 2020 & 2033
- Table 56: Global Photoelectric Distributed Acoustic Sensing Systems Volume K Forecast, by Application 2020 & 2033
- Table 57: Global Photoelectric Distributed Acoustic Sensing Systems Revenue billion Forecast, by Types 2020 & 2033
- Table 58: Global Photoelectric Distributed Acoustic Sensing Systems Volume K Forecast, by Types 2020 & 2033
- Table 59: Global Photoelectric Distributed Acoustic Sensing Systems Revenue billion Forecast, by Country 2020 & 2033
- Table 60: Global Photoelectric Distributed Acoustic Sensing Systems Volume K Forecast, by Country 2020 & 2033
- Table 61: Turkey Photoelectric Distributed Acoustic Sensing Systems Revenue (billion) Forecast, by Application 2020 & 2033
- Table 62: Turkey Photoelectric Distributed Acoustic Sensing Systems Volume (K) Forecast, by Application 2020 & 2033
- Table 63: Israel Photoelectric Distributed Acoustic Sensing Systems Revenue (billion) Forecast, by Application 2020 & 2033
- Table 64: Israel Photoelectric Distributed Acoustic Sensing Systems Volume (K) Forecast, by Application 2020 & 2033
- Table 65: GCC Photoelectric Distributed Acoustic Sensing Systems Revenue (billion) Forecast, by Application 2020 & 2033
- Table 66: GCC Photoelectric Distributed Acoustic Sensing Systems Volume (K) Forecast, by Application 2020 & 2033
- Table 67: North Africa Photoelectric Distributed Acoustic Sensing Systems Revenue (billion) Forecast, by Application 2020 & 2033
- Table 68: North Africa Photoelectric Distributed Acoustic Sensing Systems Volume (K) Forecast, by Application 2020 & 2033
- Table 69: South Africa Photoelectric Distributed Acoustic Sensing Systems Revenue (billion) Forecast, by Application 2020 & 2033
- Table 70: South Africa Photoelectric Distributed Acoustic Sensing Systems Volume (K) Forecast, by Application 2020 & 2033
- Table 71: Rest of Middle East & Africa Photoelectric Distributed Acoustic Sensing Systems Revenue (billion) Forecast, by Application 2020 & 2033
- Table 72: Rest of Middle East & Africa Photoelectric Distributed Acoustic Sensing Systems Volume (K) Forecast, by Application 2020 & 2033
- Table 73: Global Photoelectric Distributed Acoustic Sensing Systems Revenue billion Forecast, by Application 2020 & 2033
- Table 74: Global Photoelectric Distributed Acoustic Sensing Systems Volume K Forecast, by Application 2020 & 2033
- Table 75: Global Photoelectric Distributed Acoustic Sensing Systems Revenue billion Forecast, by Types 2020 & 2033
- Table 76: Global Photoelectric Distributed Acoustic Sensing Systems Volume K Forecast, by Types 2020 & 2033
- Table 77: Global Photoelectric Distributed Acoustic Sensing Systems Revenue billion Forecast, by Country 2020 & 2033
- Table 78: Global Photoelectric Distributed Acoustic Sensing Systems Volume K Forecast, by Country 2020 & 2033
- Table 79: China Photoelectric Distributed Acoustic Sensing Systems Revenue (billion) Forecast, by Application 2020 & 2033
- Table 80: China Photoelectric Distributed Acoustic Sensing Systems Volume (K) Forecast, by Application 2020 & 2033
- Table 81: India Photoelectric Distributed Acoustic Sensing Systems Revenue (billion) Forecast, by Application 2020 & 2033
- Table 82: India Photoelectric Distributed Acoustic Sensing Systems Volume (K) Forecast, by Application 2020 & 2033
- Table 83: Japan Photoelectric Distributed Acoustic Sensing Systems Revenue (billion) Forecast, by Application 2020 & 2033
- Table 84: Japan Photoelectric Distributed Acoustic Sensing Systems Volume (K) Forecast, by Application 2020 & 2033
- Table 85: South Korea Photoelectric Distributed Acoustic Sensing Systems Revenue (billion) Forecast, by Application 2020 & 2033
- Table 86: South Korea Photoelectric Distributed Acoustic Sensing Systems Volume (K) Forecast, by Application 2020 & 2033
- Table 87: ASEAN Photoelectric Distributed Acoustic Sensing Systems Revenue (billion) Forecast, by Application 2020 & 2033
- Table 88: ASEAN Photoelectric Distributed Acoustic Sensing Systems Volume (K) Forecast, by Application 2020 & 2033
- Table 89: Oceania Photoelectric Distributed Acoustic Sensing Systems Revenue (billion) Forecast, by Application 2020 & 2033
- Table 90: Oceania Photoelectric Distributed Acoustic Sensing Systems Volume (K) Forecast, by Application 2020 & 2033
- Table 91: Rest of Asia Pacific Photoelectric Distributed Acoustic Sensing Systems Revenue (billion) Forecast, by Application 2020 & 2033
- Table 92: Rest of Asia Pacific Photoelectric Distributed Acoustic Sensing Systems Volume (K) Forecast, by Application 2020 & 2033
Frequently Asked Questions
1. What is the projected Compound Annual Growth Rate (CAGR) of the Photoelectric Distributed Acoustic Sensing Systems?
The projected CAGR is approximately 7.92%.
2. Which companies are prominent players in the Photoelectric Distributed Acoustic Sensing Systems?
Key companies in the market include Halliburton, Omnisens, Future Fibre Technologies (Ava Group), Schlumberger, Yokogawa, Baker Hughes (GE), Hifi Engineering, Silixa, Ziebel, AP Sensing, Banweaver, Fotech Solutions, Optasense, FibrisTerre, OZ Optics, Pruett Tech, Optellios, Polus-ST, Luna Innovations.
3. What are the main segments of the Photoelectric Distributed Acoustic Sensing Systems?
The market segments include Application, Types.
4. Can you provide details about the market size?
The market size is estimated to be USD 7.88 billion as of 2022.
5. What are some drivers contributing to market growth?
N/A
6. What are the notable trends driving market growth?
N/A
7. Are there any restraints impacting market growth?
N/A
8. Can you provide examples of recent developments in the market?
N/A
9. What pricing options are available for accessing the report?
Pricing options include single-user, multi-user, and enterprise licenses priced at USD 3350.00, USD 5025.00, and USD 6700.00 respectively.
10. Is the market size provided in terms of value or volume?
The market size is provided in terms of value, measured in billion and volume, measured in K.
11. Are there any specific market keywords associated with the report?
Yes, the market keyword associated with the report is "Photoelectric Distributed Acoustic Sensing Systems," which aids in identifying and referencing the specific market segment covered.
12. How do I determine which pricing option suits my needs best?
The pricing options vary based on user requirements and access needs. Individual users may opt for single-user licenses, while businesses requiring broader access may choose multi-user or enterprise licenses for cost-effective access to the report.
13. Are there any additional resources or data provided in the Photoelectric Distributed Acoustic Sensing Systems report?
While the report offers comprehensive insights, it's advisable to review the specific contents or supplementary materials provided to ascertain if additional resources or data are available.
14. How can I stay updated on further developments or reports in the Photoelectric Distributed Acoustic Sensing Systems?
To stay informed about further developments, trends, and reports in the Photoelectric Distributed Acoustic Sensing Systems, consider subscribing to industry newsletters, following relevant companies and organizations, or regularly checking reputable industry news sources and publications.
Methodology
Step 1 - Identification of Relevant Samples Size from Population Database


Step 2 - Approaches for Defining Global Market Size (Value, Volume* & Price*)

Note*: In applicable scenarios
Step 3 - Data Sources
Primary Research
- Web Analytics
- Survey Reports
- Research Institute
- Latest Research Reports
- Opinion Leaders
Secondary Research
- Annual Reports
- White Paper
- Latest Press Release
- Industry Association
- Paid Database
- Investor Presentations

Step 4 - Data Triangulation
Involves using different sources of information in order to increase the validity of a study
These sources are likely to be stakeholders in a program - participants, other researchers, program staff, other community members, and so on.
Then we put all data in single framework & apply various statistical tools to find out the dynamic on the market.
During the analysis stage, feedback from the stakeholder groups would be compared to determine areas of agreement as well as areas of divergence