

Key Insights
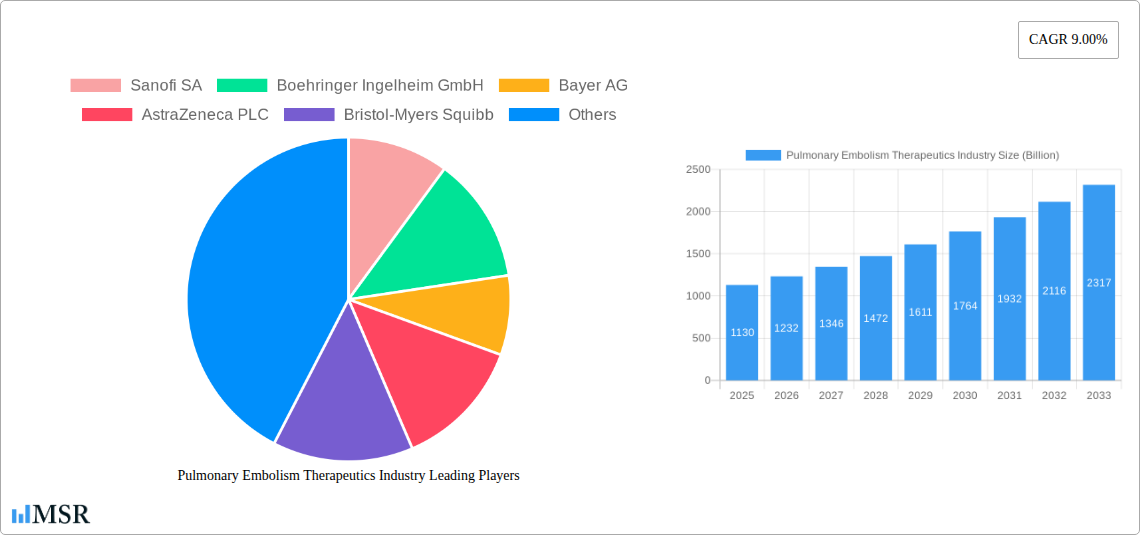
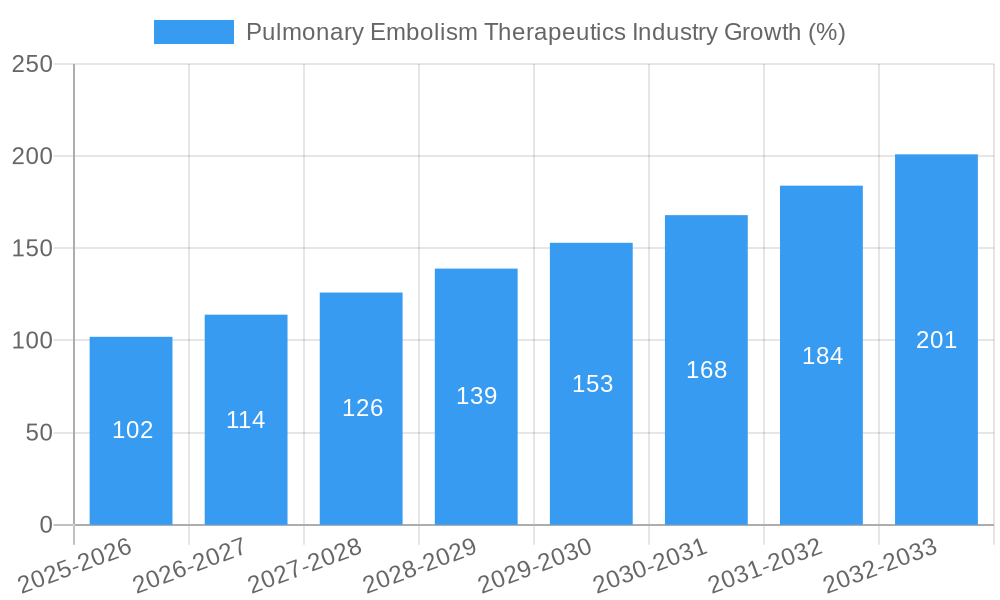
The Pulmonary Embolism (PE) Therapeutics market, valued at approximately $1.13 billion in 2025, is projected to experience robust growth, driven by a rising prevalence of PE globally, advancements in diagnostic techniques, and the introduction of novel therapies. The market's Compound Annual Growth Rate (CAGR) of 9% from 2025 to 2033 indicates a significant expansion. Key drivers include an aging population, increasing incidence of risk factors such as deep vein thrombosis (DVT), prolonged immobility, and cancer, all contributing to heightened PE susceptibility. Furthermore, the development of effective anticoagulants like Factor Xa inhibitors and newer direct thrombin inhibitors, offering improved efficacy and safety profiles compared to traditional heparin, fuels market growth. However, potential restraints include the high cost of innovative therapies, challenges in early PE diagnosis, and the risk of bleeding complications associated with anticoagulant treatment. The segment analysis reveals that Factor Xa inhibitors are expected to maintain market dominance due to their convenience and efficacy, while hospital pharmacies constitute the largest distribution channel owing to the acute nature of PE treatment.
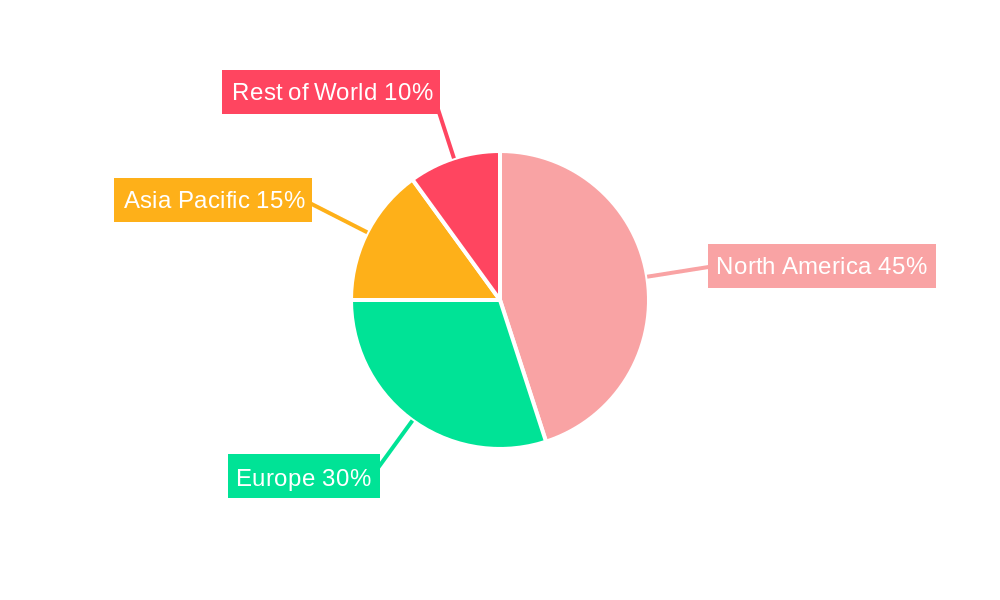
Geographic segmentation reveals significant regional variations. North America, particularly the United States, holds a substantial market share due to advanced healthcare infrastructure and high healthcare expenditure. Europe follows, driven by a growing awareness of PE and increasing adoption of effective therapies. Asia-Pacific presents a significant growth opportunity, fueled by improving healthcare access and expanding diagnostics capabilities, although market penetration remains relatively lower compared to developed regions. Competitive dynamics are shaped by major pharmaceutical companies like Sanofi, Boehringer Ingelheim, and Bayer, each striving for market leadership through robust R&D, strategic partnerships, and diversified product portfolios. The forecast period (2025-2033) promises continued market expansion, driven by technological advancements and increased focus on early diagnosis and prevention strategies.
Pulmonary Embolism Therapeutics Industry: A Comprehensive Market Report (2019-2033)
This in-depth report provides a comprehensive analysis of the Pulmonary Embolism Therapeutics market, projecting a market value exceeding $XX Billion by 2033. It offers invaluable insights for stakeholders, including pharmaceutical companies, investors, and healthcare professionals. The study period covers 2019-2033, with 2025 as the base and estimated year. Key segments analyzed include drug classes (Factor Xa Inhibitor, Heparin, P2Y12 Platelet Inhibitor, and others), disease types (Pulmonary Embolism, Atrial Fibrillation, Deep Vein Thrombosis, and others), and distribution channels (Hospital Pharmacies, Retail Pharmacies, and Online Pharmacies). Leading companies such as Sanofi SA, Boehringer Ingelheim GmbH, Bayer AG, AstraZeneca PLC, Bristol-Myers Squibb, Teva Pharmaceutical Industries Ltd, Johnson & Johnson, Swiss Pharma Pvt Ltd, Laurus Lab (Aspen Pharmacare Holdings Limited), and Pfizer Inc. are profiled, providing a competitive landscape analysis.
Pulmonary Embolism Therapeutics Industry Market Concentration & Dynamics
The Pulmonary Embolism Therapeutics market exhibits a moderately concentrated landscape, with a few major players holding significant market share. However, the presence of numerous smaller companies and ongoing innovation fosters a dynamic competitive environment. Market concentration is further shaped by regulatory frameworks governing drug approvals and pricing, as well as the emergence of substitute products and biosimilars. The industry witnesses consistent merger and acquisition (M&A) activity, driven by strategic expansion and portfolio diversification. In the historical period (2019-2024), an estimated xx M&A deals occurred, contributing to market consolidation and reshaping the competitive landscape.
- Market Share: Top 5 players hold approximately xx% of the market share in 2025.
- M&A Activity: A total of xx major M&A deals were observed during the period 2019-2024.
- Innovation Ecosystems: Significant investments in R&D are driving the development of novel therapeutics, particularly in the area of targeted therapies.
- Regulatory Frameworks: Stringent regulatory approvals influence market entry and competition.
- Substitute Products: The availability of alternative treatment options can affect market growth.
- End-User Trends: Increasing prevalence of thromboembolic diseases fuels demand for effective therapeutics.
Pulmonary Embolism Therapeutics Industry Industry Insights & Trends
The Pulmonary Embolism Therapeutics market is experiencing robust growth, driven by several factors. The rising prevalence of thromboembolic diseases like pulmonary embolism, atrial fibrillation, and deep vein thrombosis is a major catalyst. Furthermore, technological advancements in drug development, including targeted therapies and biosimilars, are expanding treatment options and improving patient outcomes. Changing consumer behavior, including increased health awareness and demand for convenient treatment options, further propels market expansion. The global market size is estimated at $XX Billion in 2025, with a projected Compound Annual Growth Rate (CAGR) of xx% during the forecast period (2025-2033). This growth is further fueled by increasing healthcare expenditure and the expansion of healthcare infrastructure, particularly in emerging economies. However, challenges remain, including high drug prices and potential side effects of some therapies.
Key Markets & Segments Leading Pulmonary Embolism Therapeutics Industry
North America currently dominates the Pulmonary Embolism Therapeutics market, owing to advanced healthcare infrastructure, high healthcare spending, and a large patient population. However, significant growth is anticipated in Asia-Pacific regions due to rising disease prevalence and increasing healthcare expenditure.
- Dominant Region: North America
- Dominant Drug Class: Factor Xa Inhibitors
- Dominant Disease Type: Pulmonary Embolism
- Dominant Distribution Channel: Hospital Pharmacies
Drivers for Growth:
- North America: Advanced healthcare infrastructure, high healthcare spending, strong regulatory frameworks.
- Asia-Pacific: Rising disease prevalence, increasing healthcare expenditure, growing awareness.
- Europe: Well-established healthcare systems, significant R&D investments.
Detailed Dominance Analysis: Factor Xa inhibitors currently lead in the drug class segment due to their efficacy and safety profile. The Pulmonary Embolism segment dominates the disease type classification due to its high prevalence and substantial unmet medical need. Hospital pharmacies remain the primary distribution channel due to the nature of the treatment regimen.
Pulmonary Embolism Therapeutics Industry Product Developments
The Pulmonary Embolism Therapeutics market witnesses continuous innovation, with the development of novel drug classes and improved formulations offering enhanced efficacy and safety. Significant advancements include the introduction of targeted therapies with improved selectivity and reduced side effects, as well as the development of biosimilars offering cost-effective treatment options. These advancements are significantly impacting the competitive landscape, driving market expansion, and improving patient care.
Challenges in the Pulmonary Embolism Therapeutics Industry Market
Several challenges hinder the growth of the Pulmonary Embolism Therapeutics market. Stringent regulatory pathways and lengthy approval processes create significant hurdles for new drug launches. Furthermore, high manufacturing and distribution costs influence drug prices and access for patients. Intense competition among established pharmaceutical players and the emergence of biosimilars also put pressure on profit margins. These factors contribute to a complex and challenging market dynamic. For example, the average time for regulatory approval is approximately xx months, delaying market entry for innovative products.
Forces Driving Pulmonary Embolism Therapeutics Industry Growth
Technological advancements, particularly in drug delivery systems and personalized medicine, are major growth drivers. The rising prevalence of thromboembolic diseases coupled with increased healthcare expenditure further fuels market expansion. Favorable regulatory landscapes and government initiatives to improve healthcare access are also significant catalysts. For instance, the FDA's fast-track designation program accelerates the approval process for promising new drugs, thereby stimulating innovation.
Long-Term Growth Catalysts in Pulmonary Embolism Therapeutics Industry
Long-term growth is fueled by continued innovation in drug development, including the exploration of novel therapeutic targets and the development of combination therapies. Strategic collaborations and partnerships between pharmaceutical companies and research institutions accelerate the development and commercialization of new products. Expansion into emerging markets and untapped patient populations offers significant growth potential.
Emerging Opportunities in Pulmonary Embolism Therapeutics Industry
Emerging opportunities include the development of personalized medicine approaches tailored to specific patient characteristics, improving treatment efficacy and minimizing side effects. The growing adoption of telemedicine and remote patient monitoring offers opportunities for enhanced treatment delivery and patient management. Expansion into underserved markets and the development of cost-effective biosimilars will further shape market growth.
Leading Players in the Pulmonary Embolism Therapeutics Industry Sector
- Sanofi SA
- Boehringer Ingelheim GmbH
- Bayer AG
- AstraZeneca PLC
- Bristol-Myers Squibb
- Teva Pharmaceutical Industries Ltd
- Johnson & Johnson
- Swiss Pharma Pvt Ltd
- Laurus Lab (Aspen Pharmacare Holdings Limited)
- Pfizer Inc
Key Milestones in Pulmonary Embolism Therapeutics Industry Industry
- July 2022: The FDA granted abelacimab (Anthos Therapeutics) a fast-track designation for cancer-related thrombosis. This accelerated the development and approval process for a critical unmet need.
- February 2023: Bayer initiated the OCEANIC clinical trial program for asundexian (BAY2433334), an investigational oral Factor XIa inhibitor, for atrial fibrillation and ischemic stroke. This signifies a significant investment in the development of novel anticoagulants.
Strategic Outlook for Pulmonary Embolism Therapeutics Industry Market
The future of the Pulmonary Embolism Therapeutics market is promising, driven by continuous innovation, expanding treatment options, and the rising prevalence of thromboembolic diseases. Strategic partnerships, collaborations, and investments in R&D will be crucial for maintaining a competitive edge. Focus on personalized medicine, improved drug delivery systems, and expansion into new markets will be key drivers of future market growth and profitability.
Pulmonary Embolism Therapeutics Industry Segmentation
-
1. Drug Class
- 1.1. Factor Xa Inhibitor
- 1.2. Heparin
- 1.3. P2Y12 Platelet Inhibitor
- 1.4. Other Drug Classes
-
2. Disease Type
- 2.1. Pulmonary Embolism
- 2.2. Atrial Fibrillation
- 2.3. Deep Vein Thrombosis
- 2.4. Other Disease Types
-
3. Distribution Channel
- 3.1. Hospital Pharmacies
- 3.2. Retail Pharmacies
- 3.3. Online Pharmacies
Pulmonary Embolism Therapeutics Industry Segmentation By Geography
-
1. North America
- 1.1. United States
- 1.2. Canada
- 1.3. Mexico
-
2. Europe
- 2.1. Germany
- 2.2. United Kingdom
- 2.3. France
- 2.4. Italy
- 2.5. Spain
- 2.6. Rest of Europe
-
3. Asia Pacific
- 3.1. China
- 3.2. Japan
- 3.3. India
- 3.4. Australia
- 3.5. South Korea
- 3.6. Rest of Asia Pacific
-
4. Middle East and Africa
- 4.1. GCC
- 4.2. South Africa
- 4.3. Rest of Middle East and Africa
-
5. South America
- 5.1. Brazil
- 5.2. Argentina
- 5.3. Rest of South America
Pulmonary Embolism Therapeutics Industry REPORT HIGHLIGHTS
| Aspects | Details |
|---|---|
| Study Period | 2019-2033 |
| Base Year | 2024 |
| Estimated Year | 2025 |
| Forecast Period | 2025-2033 |
| Historical Period | 2019-2024 |
| Growth Rate | CAGR of 9.00% from 2019-2033 |
| Segmentation |
|
Table of Contents
- 1. Introduction
- 1.1. Research Scope
- 1.2. Market Segmentation
- 1.3. Research Methodology
- 1.4. Definitions and Assumptions
- 2. Executive Summary
- 2.1. Introduction
- 3. Market Dynamics
- 3.1. Introduction
- 3.2. Market Drivers
- 3.2.1. Growing Geriatric and Obese Population; Increasing Burden of Cardiovascular and Trauma Cases; Increasing Technological Advancements in Hematology
- 3.3. Market Restrains
- 3.3.1 Lack of Awareness about Venous Thromboembolism Conditions; Side Effects Caused
- 3.3.2 due to Thrombosis Drugs
- 3.4. Market Trends
- 3.4.1. Deep Vein Thrombosis (DVT) Segment is Expected to Register a Significant Growth during the Forecast Period
- 4. Market Factor Analysis
- 4.1. Porters Five Forces
- 4.2. Supply/Value Chain
- 4.3. PESTEL analysis
- 4.4. Market Entropy
- 4.5. Patent/Trademark Analysis
- 5. Global Pulmonary Embolism Therapeutics Industry Analysis, Insights and Forecast, 2019-2031
- 5.1. Market Analysis, Insights and Forecast - by Drug Class
- 5.1.1. Factor Xa Inhibitor
- 5.1.2. Heparin
- 5.1.3. P2Y12 Platelet Inhibitor
- 5.1.4. Other Drug Classes
- 5.2. Market Analysis, Insights and Forecast - by Disease Type
- 5.2.1. Pulmonary Embolism
- 5.2.2. Atrial Fibrillation
- 5.2.3. Deep Vein Thrombosis
- 5.2.4. Other Disease Types
- 5.3. Market Analysis, Insights and Forecast - by Distribution Channel
- 5.3.1. Hospital Pharmacies
- 5.3.2. Retail Pharmacies
- 5.3.3. Online Pharmacies
- 5.4. Market Analysis, Insights and Forecast - by Region
- 5.4.1. North America
- 5.4.2. Europe
- 5.4.3. Asia Pacific
- 5.4.4. Middle East and Africa
- 5.4.5. South America
- 5.1. Market Analysis, Insights and Forecast - by Drug Class
- 6. North America Pulmonary Embolism Therapeutics Industry Analysis, Insights and Forecast, 2019-2031
- 6.1. Market Analysis, Insights and Forecast - by Drug Class
- 6.1.1. Factor Xa Inhibitor
- 6.1.2. Heparin
- 6.1.3. P2Y12 Platelet Inhibitor
- 6.1.4. Other Drug Classes
- 6.2. Market Analysis, Insights and Forecast - by Disease Type
- 6.2.1. Pulmonary Embolism
- 6.2.2. Atrial Fibrillation
- 6.2.3. Deep Vein Thrombosis
- 6.2.4. Other Disease Types
- 6.3. Market Analysis, Insights and Forecast - by Distribution Channel
- 6.3.1. Hospital Pharmacies
- 6.3.2. Retail Pharmacies
- 6.3.3. Online Pharmacies
- 6.1. Market Analysis, Insights and Forecast - by Drug Class
- 7. Europe Pulmonary Embolism Therapeutics Industry Analysis, Insights and Forecast, 2019-2031
- 7.1. Market Analysis, Insights and Forecast - by Drug Class
- 7.1.1. Factor Xa Inhibitor
- 7.1.2. Heparin
- 7.1.3. P2Y12 Platelet Inhibitor
- 7.1.4. Other Drug Classes
- 7.2. Market Analysis, Insights and Forecast - by Disease Type
- 7.2.1. Pulmonary Embolism
- 7.2.2. Atrial Fibrillation
- 7.2.3. Deep Vein Thrombosis
- 7.2.4. Other Disease Types
- 7.3. Market Analysis, Insights and Forecast - by Distribution Channel
- 7.3.1. Hospital Pharmacies
- 7.3.2. Retail Pharmacies
- 7.3.3. Online Pharmacies
- 7.1. Market Analysis, Insights and Forecast - by Drug Class
- 8. Asia Pacific Pulmonary Embolism Therapeutics Industry Analysis, Insights and Forecast, 2019-2031
- 8.1. Market Analysis, Insights and Forecast - by Drug Class
- 8.1.1. Factor Xa Inhibitor
- 8.1.2. Heparin
- 8.1.3. P2Y12 Platelet Inhibitor
- 8.1.4. Other Drug Classes
- 8.2. Market Analysis, Insights and Forecast - by Disease Type
- 8.2.1. Pulmonary Embolism
- 8.2.2. Atrial Fibrillation
- 8.2.3. Deep Vein Thrombosis
- 8.2.4. Other Disease Types
- 8.3. Market Analysis, Insights and Forecast - by Distribution Channel
- 8.3.1. Hospital Pharmacies
- 8.3.2. Retail Pharmacies
- 8.3.3. Online Pharmacies
- 8.1. Market Analysis, Insights and Forecast - by Drug Class
- 9. Middle East and Africa Pulmonary Embolism Therapeutics Industry Analysis, Insights and Forecast, 2019-2031
- 9.1. Market Analysis, Insights and Forecast - by Drug Class
- 9.1.1. Factor Xa Inhibitor
- 9.1.2. Heparin
- 9.1.3. P2Y12 Platelet Inhibitor
- 9.1.4. Other Drug Classes
- 9.2. Market Analysis, Insights and Forecast - by Disease Type
- 9.2.1. Pulmonary Embolism
- 9.2.2. Atrial Fibrillation
- 9.2.3. Deep Vein Thrombosis
- 9.2.4. Other Disease Types
- 9.3. Market Analysis, Insights and Forecast - by Distribution Channel
- 9.3.1. Hospital Pharmacies
- 9.3.2. Retail Pharmacies
- 9.3.3. Online Pharmacies
- 9.1. Market Analysis, Insights and Forecast - by Drug Class
- 10. South America Pulmonary Embolism Therapeutics Industry Analysis, Insights and Forecast, 2019-2031
- 10.1. Market Analysis, Insights and Forecast - by Drug Class
- 10.1.1. Factor Xa Inhibitor
- 10.1.2. Heparin
- 10.1.3. P2Y12 Platelet Inhibitor
- 10.1.4. Other Drug Classes
- 10.2. Market Analysis, Insights and Forecast - by Disease Type
- 10.2.1. Pulmonary Embolism
- 10.2.2. Atrial Fibrillation
- 10.2.3. Deep Vein Thrombosis
- 10.2.4. Other Disease Types
- 10.3. Market Analysis, Insights and Forecast - by Distribution Channel
- 10.3.1. Hospital Pharmacies
- 10.3.2. Retail Pharmacies
- 10.3.3. Online Pharmacies
- 10.1. Market Analysis, Insights and Forecast - by Drug Class
- 11. North America Pulmonary Embolism Therapeutics Industry Analysis, Insights and Forecast, 2019-2031
- 11.1. Market Analysis, Insights and Forecast - By Country/Sub-region
- 11.1.1 United States
- 11.1.2 Canada
- 11.1.3 Mexico
- 12. Europe Pulmonary Embolism Therapeutics Industry Analysis, Insights and Forecast, 2019-2031
- 12.1. Market Analysis, Insights and Forecast - By Country/Sub-region
- 12.1.1 Germany
- 12.1.2 United Kingdom
- 12.1.3 France
- 12.1.4 Italy
- 12.1.5 Spain
- 12.1.6 Rest of Europe
- 13. Asia Pacific Pulmonary Embolism Therapeutics Industry Analysis, Insights and Forecast, 2019-2031
- 13.1. Market Analysis, Insights and Forecast - By Country/Sub-region
- 13.1.1 China
- 13.1.2 Japan
- 13.1.3 India
- 13.1.4 Australia
- 13.1.5 South Korea
- 13.1.6 Rest of Asia Pacific
- 14. Middle East and Africa Pulmonary Embolism Therapeutics Industry Analysis, Insights and Forecast, 2019-2031
- 14.1. Market Analysis, Insights and Forecast - By Country/Sub-region
- 14.1.1 GCC
- 14.1.2 South Africa
- 14.1.3 Rest of Middle East and Africa
- 15. South America Pulmonary Embolism Therapeutics Industry Analysis, Insights and Forecast, 2019-2031
- 15.1. Market Analysis, Insights and Forecast - By Country/Sub-region
- 15.1.1 Brazil
- 15.1.2 Argentina
- 15.1.3 Rest of South America
- 16. Competitive Analysis
- 16.1. Global Market Share Analysis 2024
- 16.2. Company Profiles
- 16.2.1 Sanofi SA
- 16.2.1.1. Overview
- 16.2.1.2. Products
- 16.2.1.3. SWOT Analysis
- 16.2.1.4. Recent Developments
- 16.2.1.5. Financials (Based on Availability)
- 16.2.2 Boehringer Ingelheim GmbH
- 16.2.2.1. Overview
- 16.2.2.2. Products
- 16.2.2.3. SWOT Analysis
- 16.2.2.4. Recent Developments
- 16.2.2.5. Financials (Based on Availability)
- 16.2.3 Bayer AG
- 16.2.3.1. Overview
- 16.2.3.2. Products
- 16.2.3.3. SWOT Analysis
- 16.2.3.4. Recent Developments
- 16.2.3.5. Financials (Based on Availability)
- 16.2.4 AstraZeneca PLC
- 16.2.4.1. Overview
- 16.2.4.2. Products
- 16.2.4.3. SWOT Analysis
- 16.2.4.4. Recent Developments
- 16.2.4.5. Financials (Based on Availability)
- 16.2.5 Bristol-Myers Squibb
- 16.2.5.1. Overview
- 16.2.5.2. Products
- 16.2.5.3. SWOT Analysis
- 16.2.5.4. Recent Developments
- 16.2.5.5. Financials (Based on Availability)
- 16.2.6 Teva Pharmaceutical Industries Ltd
- 16.2.6.1. Overview
- 16.2.6.2. Products
- 16.2.6.3. SWOT Analysis
- 16.2.6.4. Recent Developments
- 16.2.6.5. Financials (Based on Availability)
- 16.2.7 Johnson & Johnson
- 16.2.7.1. Overview
- 16.2.7.2. Products
- 16.2.7.3. SWOT Analysis
- 16.2.7.4. Recent Developments
- 16.2.7.5. Financials (Based on Availability)
- 16.2.8 Swiss Pharma Pvt Ltd*List Not Exhaustive
- 16.2.8.1. Overview
- 16.2.8.2. Products
- 16.2.8.3. SWOT Analysis
- 16.2.8.4. Recent Developments
- 16.2.8.5. Financials (Based on Availability)
- 16.2.9 Laurus Lab (Aspen Pharmacare Holdings Limited)
- 16.2.9.1. Overview
- 16.2.9.2. Products
- 16.2.9.3. SWOT Analysis
- 16.2.9.4. Recent Developments
- 16.2.9.5. Financials (Based on Availability)
- 16.2.10 Pfizer Inc
- 16.2.10.1. Overview
- 16.2.10.2. Products
- 16.2.10.3. SWOT Analysis
- 16.2.10.4. Recent Developments
- 16.2.10.5. Financials (Based on Availability)
- 16.2.1 Sanofi SA
List of Figures
- Figure 1: Global Pulmonary Embolism Therapeutics Industry Revenue Breakdown (Billion, %) by Region 2024 & 2032
- Figure 2: Global Pulmonary Embolism Therapeutics Industry Volume Breakdown (mg, %) by Region 2024 & 2032
- Figure 3: North America Pulmonary Embolism Therapeutics Industry Revenue (Billion), by Country 2024 & 2032
- Figure 4: North America Pulmonary Embolism Therapeutics Industry Volume (mg), by Country 2024 & 2032
- Figure 5: North America Pulmonary Embolism Therapeutics Industry Revenue Share (%), by Country 2024 & 2032
- Figure 6: North America Pulmonary Embolism Therapeutics Industry Volume Share (%), by Country 2024 & 2032
- Figure 7: Europe Pulmonary Embolism Therapeutics Industry Revenue (Billion), by Country 2024 & 2032
- Figure 8: Europe Pulmonary Embolism Therapeutics Industry Volume (mg), by Country 2024 & 2032
- Figure 9: Europe Pulmonary Embolism Therapeutics Industry Revenue Share (%), by Country 2024 & 2032
- Figure 10: Europe Pulmonary Embolism Therapeutics Industry Volume Share (%), by Country 2024 & 2032
- Figure 11: Asia Pacific Pulmonary Embolism Therapeutics Industry Revenue (Billion), by Country 2024 & 2032
- Figure 12: Asia Pacific Pulmonary Embolism Therapeutics Industry Volume (mg), by Country 2024 & 2032
- Figure 13: Asia Pacific Pulmonary Embolism Therapeutics Industry Revenue Share (%), by Country 2024 & 2032
- Figure 14: Asia Pacific Pulmonary Embolism Therapeutics Industry Volume Share (%), by Country 2024 & 2032
- Figure 15: Middle East and Africa Pulmonary Embolism Therapeutics Industry Revenue (Billion), by Country 2024 & 2032
- Figure 16: Middle East and Africa Pulmonary Embolism Therapeutics Industry Volume (mg), by Country 2024 & 2032
- Figure 17: Middle East and Africa Pulmonary Embolism Therapeutics Industry Revenue Share (%), by Country 2024 & 2032
- Figure 18: Middle East and Africa Pulmonary Embolism Therapeutics Industry Volume Share (%), by Country 2024 & 2032
- Figure 19: South America Pulmonary Embolism Therapeutics Industry Revenue (Billion), by Country 2024 & 2032
- Figure 20: South America Pulmonary Embolism Therapeutics Industry Volume (mg), by Country 2024 & 2032
- Figure 21: South America Pulmonary Embolism Therapeutics Industry Revenue Share (%), by Country 2024 & 2032
- Figure 22: South America Pulmonary Embolism Therapeutics Industry Volume Share (%), by Country 2024 & 2032
- Figure 23: North America Pulmonary Embolism Therapeutics Industry Revenue (Billion), by Drug Class 2024 & 2032
- Figure 24: North America Pulmonary Embolism Therapeutics Industry Volume (mg), by Drug Class 2024 & 2032
- Figure 25: North America Pulmonary Embolism Therapeutics Industry Revenue Share (%), by Drug Class 2024 & 2032
- Figure 26: North America Pulmonary Embolism Therapeutics Industry Volume Share (%), by Drug Class 2024 & 2032
- Figure 27: North America Pulmonary Embolism Therapeutics Industry Revenue (Billion), by Disease Type 2024 & 2032
- Figure 28: North America Pulmonary Embolism Therapeutics Industry Volume (mg), by Disease Type 2024 & 2032
- Figure 29: North America Pulmonary Embolism Therapeutics Industry Revenue Share (%), by Disease Type 2024 & 2032
- Figure 30: North America Pulmonary Embolism Therapeutics Industry Volume Share (%), by Disease Type 2024 & 2032
- Figure 31: North America Pulmonary Embolism Therapeutics Industry Revenue (Billion), by Distribution Channel 2024 & 2032
- Figure 32: North America Pulmonary Embolism Therapeutics Industry Volume (mg), by Distribution Channel 2024 & 2032
- Figure 33: North America Pulmonary Embolism Therapeutics Industry Revenue Share (%), by Distribution Channel 2024 & 2032
- Figure 34: North America Pulmonary Embolism Therapeutics Industry Volume Share (%), by Distribution Channel 2024 & 2032
- Figure 35: North America Pulmonary Embolism Therapeutics Industry Revenue (Billion), by Country 2024 & 2032
- Figure 36: North America Pulmonary Embolism Therapeutics Industry Volume (mg), by Country 2024 & 2032
- Figure 37: North America Pulmonary Embolism Therapeutics Industry Revenue Share (%), by Country 2024 & 2032
- Figure 38: North America Pulmonary Embolism Therapeutics Industry Volume Share (%), by Country 2024 & 2032
- Figure 39: Europe Pulmonary Embolism Therapeutics Industry Revenue (Billion), by Drug Class 2024 & 2032
- Figure 40: Europe Pulmonary Embolism Therapeutics Industry Volume (mg), by Drug Class 2024 & 2032
- Figure 41: Europe Pulmonary Embolism Therapeutics Industry Revenue Share (%), by Drug Class 2024 & 2032
- Figure 42: Europe Pulmonary Embolism Therapeutics Industry Volume Share (%), by Drug Class 2024 & 2032
- Figure 43: Europe Pulmonary Embolism Therapeutics Industry Revenue (Billion), by Disease Type 2024 & 2032
- Figure 44: Europe Pulmonary Embolism Therapeutics Industry Volume (mg), by Disease Type 2024 & 2032
- Figure 45: Europe Pulmonary Embolism Therapeutics Industry Revenue Share (%), by Disease Type 2024 & 2032
- Figure 46: Europe Pulmonary Embolism Therapeutics Industry Volume Share (%), by Disease Type 2024 & 2032
- Figure 47: Europe Pulmonary Embolism Therapeutics Industry Revenue (Billion), by Distribution Channel 2024 & 2032
- Figure 48: Europe Pulmonary Embolism Therapeutics Industry Volume (mg), by Distribution Channel 2024 & 2032
- Figure 49: Europe Pulmonary Embolism Therapeutics Industry Revenue Share (%), by Distribution Channel 2024 & 2032
- Figure 50: Europe Pulmonary Embolism Therapeutics Industry Volume Share (%), by Distribution Channel 2024 & 2032
- Figure 51: Europe Pulmonary Embolism Therapeutics Industry Revenue (Billion), by Country 2024 & 2032
- Figure 52: Europe Pulmonary Embolism Therapeutics Industry Volume (mg), by Country 2024 & 2032
- Figure 53: Europe Pulmonary Embolism Therapeutics Industry Revenue Share (%), by Country 2024 & 2032
- Figure 54: Europe Pulmonary Embolism Therapeutics Industry Volume Share (%), by Country 2024 & 2032
- Figure 55: Asia Pacific Pulmonary Embolism Therapeutics Industry Revenue (Billion), by Drug Class 2024 & 2032
- Figure 56: Asia Pacific Pulmonary Embolism Therapeutics Industry Volume (mg), by Drug Class 2024 & 2032
- Figure 57: Asia Pacific Pulmonary Embolism Therapeutics Industry Revenue Share (%), by Drug Class 2024 & 2032
- Figure 58: Asia Pacific Pulmonary Embolism Therapeutics Industry Volume Share (%), by Drug Class 2024 & 2032
- Figure 59: Asia Pacific Pulmonary Embolism Therapeutics Industry Revenue (Billion), by Disease Type 2024 & 2032
- Figure 60: Asia Pacific Pulmonary Embolism Therapeutics Industry Volume (mg), by Disease Type 2024 & 2032
- Figure 61: Asia Pacific Pulmonary Embolism Therapeutics Industry Revenue Share (%), by Disease Type 2024 & 2032
- Figure 62: Asia Pacific Pulmonary Embolism Therapeutics Industry Volume Share (%), by Disease Type 2024 & 2032
- Figure 63: Asia Pacific Pulmonary Embolism Therapeutics Industry Revenue (Billion), by Distribution Channel 2024 & 2032
- Figure 64: Asia Pacific Pulmonary Embolism Therapeutics Industry Volume (mg), by Distribution Channel 2024 & 2032
- Figure 65: Asia Pacific Pulmonary Embolism Therapeutics Industry Revenue Share (%), by Distribution Channel 2024 & 2032
- Figure 66: Asia Pacific Pulmonary Embolism Therapeutics Industry Volume Share (%), by Distribution Channel 2024 & 2032
- Figure 67: Asia Pacific Pulmonary Embolism Therapeutics Industry Revenue (Billion), by Country 2024 & 2032
- Figure 68: Asia Pacific Pulmonary Embolism Therapeutics Industry Volume (mg), by Country 2024 & 2032
- Figure 69: Asia Pacific Pulmonary Embolism Therapeutics Industry Revenue Share (%), by Country 2024 & 2032
- Figure 70: Asia Pacific Pulmonary Embolism Therapeutics Industry Volume Share (%), by Country 2024 & 2032
- Figure 71: Middle East and Africa Pulmonary Embolism Therapeutics Industry Revenue (Billion), by Drug Class 2024 & 2032
- Figure 72: Middle East and Africa Pulmonary Embolism Therapeutics Industry Volume (mg), by Drug Class 2024 & 2032
- Figure 73: Middle East and Africa Pulmonary Embolism Therapeutics Industry Revenue Share (%), by Drug Class 2024 & 2032
- Figure 74: Middle East and Africa Pulmonary Embolism Therapeutics Industry Volume Share (%), by Drug Class 2024 & 2032
- Figure 75: Middle East and Africa Pulmonary Embolism Therapeutics Industry Revenue (Billion), by Disease Type 2024 & 2032
- Figure 76: Middle East and Africa Pulmonary Embolism Therapeutics Industry Volume (mg), by Disease Type 2024 & 2032
- Figure 77: Middle East and Africa Pulmonary Embolism Therapeutics Industry Revenue Share (%), by Disease Type 2024 & 2032
- Figure 78: Middle East and Africa Pulmonary Embolism Therapeutics Industry Volume Share (%), by Disease Type 2024 & 2032
- Figure 79: Middle East and Africa Pulmonary Embolism Therapeutics Industry Revenue (Billion), by Distribution Channel 2024 & 2032
- Figure 80: Middle East and Africa Pulmonary Embolism Therapeutics Industry Volume (mg), by Distribution Channel 2024 & 2032
- Figure 81: Middle East and Africa Pulmonary Embolism Therapeutics Industry Revenue Share (%), by Distribution Channel 2024 & 2032
- Figure 82: Middle East and Africa Pulmonary Embolism Therapeutics Industry Volume Share (%), by Distribution Channel 2024 & 2032
- Figure 83: Middle East and Africa Pulmonary Embolism Therapeutics Industry Revenue (Billion), by Country 2024 & 2032
- Figure 84: Middle East and Africa Pulmonary Embolism Therapeutics Industry Volume (mg), by Country 2024 & 2032
- Figure 85: Middle East and Africa Pulmonary Embolism Therapeutics Industry Revenue Share (%), by Country 2024 & 2032
- Figure 86: Middle East and Africa Pulmonary Embolism Therapeutics Industry Volume Share (%), by Country 2024 & 2032
- Figure 87: South America Pulmonary Embolism Therapeutics Industry Revenue (Billion), by Drug Class 2024 & 2032
- Figure 88: South America Pulmonary Embolism Therapeutics Industry Volume (mg), by Drug Class 2024 & 2032
- Figure 89: South America Pulmonary Embolism Therapeutics Industry Revenue Share (%), by Drug Class 2024 & 2032
- Figure 90: South America Pulmonary Embolism Therapeutics Industry Volume Share (%), by Drug Class 2024 & 2032
- Figure 91: South America Pulmonary Embolism Therapeutics Industry Revenue (Billion), by Disease Type 2024 & 2032
- Figure 92: South America Pulmonary Embolism Therapeutics Industry Volume (mg), by Disease Type 2024 & 2032
- Figure 93: South America Pulmonary Embolism Therapeutics Industry Revenue Share (%), by Disease Type 2024 & 2032
- Figure 94: South America Pulmonary Embolism Therapeutics Industry Volume Share (%), by Disease Type 2024 & 2032
- Figure 95: South America Pulmonary Embolism Therapeutics Industry Revenue (Billion), by Distribution Channel 2024 & 2032
- Figure 96: South America Pulmonary Embolism Therapeutics Industry Volume (mg), by Distribution Channel 2024 & 2032
- Figure 97: South America Pulmonary Embolism Therapeutics Industry Revenue Share (%), by Distribution Channel 2024 & 2032
- Figure 98: South America Pulmonary Embolism Therapeutics Industry Volume Share (%), by Distribution Channel 2024 & 2032
- Figure 99: South America Pulmonary Embolism Therapeutics Industry Revenue (Billion), by Country 2024 & 2032
- Figure 100: South America Pulmonary Embolism Therapeutics Industry Volume (mg), by Country 2024 & 2032
- Figure 101: South America Pulmonary Embolism Therapeutics Industry Revenue Share (%), by Country 2024 & 2032
- Figure 102: South America Pulmonary Embolism Therapeutics Industry Volume Share (%), by Country 2024 & 2032
List of Tables
- Table 1: Global Pulmonary Embolism Therapeutics Industry Revenue Billion Forecast, by Region 2019 & 2032
- Table 2: Global Pulmonary Embolism Therapeutics Industry Volume mg Forecast, by Region 2019 & 2032
- Table 3: Global Pulmonary Embolism Therapeutics Industry Revenue Billion Forecast, by Drug Class 2019 & 2032
- Table 4: Global Pulmonary Embolism Therapeutics Industry Volume mg Forecast, by Drug Class 2019 & 2032
- Table 5: Global Pulmonary Embolism Therapeutics Industry Revenue Billion Forecast, by Disease Type 2019 & 2032
- Table 6: Global Pulmonary Embolism Therapeutics Industry Volume mg Forecast, by Disease Type 2019 & 2032
- Table 7: Global Pulmonary Embolism Therapeutics Industry Revenue Billion Forecast, by Distribution Channel 2019 & 2032
- Table 8: Global Pulmonary Embolism Therapeutics Industry Volume mg Forecast, by Distribution Channel 2019 & 2032
- Table 9: Global Pulmonary Embolism Therapeutics Industry Revenue Billion Forecast, by Region 2019 & 2032
- Table 10: Global Pulmonary Embolism Therapeutics Industry Volume mg Forecast, by Region 2019 & 2032
- Table 11: Global Pulmonary Embolism Therapeutics Industry Revenue Billion Forecast, by Country 2019 & 2032
- Table 12: Global Pulmonary Embolism Therapeutics Industry Volume mg Forecast, by Country 2019 & 2032
- Table 13: United States Pulmonary Embolism Therapeutics Industry Revenue (Billion) Forecast, by Application 2019 & 2032
- Table 14: United States Pulmonary Embolism Therapeutics Industry Volume (mg) Forecast, by Application 2019 & 2032
- Table 15: Canada Pulmonary Embolism Therapeutics Industry Revenue (Billion) Forecast, by Application 2019 & 2032
- Table 16: Canada Pulmonary Embolism Therapeutics Industry Volume (mg) Forecast, by Application 2019 & 2032
- Table 17: Mexico Pulmonary Embolism Therapeutics Industry Revenue (Billion) Forecast, by Application 2019 & 2032
- Table 18: Mexico Pulmonary Embolism Therapeutics Industry Volume (mg) Forecast, by Application 2019 & 2032
- Table 19: Global Pulmonary Embolism Therapeutics Industry Revenue Billion Forecast, by Country 2019 & 2032
- Table 20: Global Pulmonary Embolism Therapeutics Industry Volume mg Forecast, by Country 2019 & 2032
- Table 21: Germany Pulmonary Embolism Therapeutics Industry Revenue (Billion) Forecast, by Application 2019 & 2032
- Table 22: Germany Pulmonary Embolism Therapeutics Industry Volume (mg) Forecast, by Application 2019 & 2032
- Table 23: United Kingdom Pulmonary Embolism Therapeutics Industry Revenue (Billion) Forecast, by Application 2019 & 2032
- Table 24: United Kingdom Pulmonary Embolism Therapeutics Industry Volume (mg) Forecast, by Application 2019 & 2032
- Table 25: France Pulmonary Embolism Therapeutics Industry Revenue (Billion) Forecast, by Application 2019 & 2032
- Table 26: France Pulmonary Embolism Therapeutics Industry Volume (mg) Forecast, by Application 2019 & 2032
- Table 27: Italy Pulmonary Embolism Therapeutics Industry Revenue (Billion) Forecast, by Application 2019 & 2032
- Table 28: Italy Pulmonary Embolism Therapeutics Industry Volume (mg) Forecast, by Application 2019 & 2032
- Table 29: Spain Pulmonary Embolism Therapeutics Industry Revenue (Billion) Forecast, by Application 2019 & 2032
- Table 30: Spain Pulmonary Embolism Therapeutics Industry Volume (mg) Forecast, by Application 2019 & 2032
- Table 31: Rest of Europe Pulmonary Embolism Therapeutics Industry Revenue (Billion) Forecast, by Application 2019 & 2032
- Table 32: Rest of Europe Pulmonary Embolism Therapeutics Industry Volume (mg) Forecast, by Application 2019 & 2032
- Table 33: Global Pulmonary Embolism Therapeutics Industry Revenue Billion Forecast, by Country 2019 & 2032
- Table 34: Global Pulmonary Embolism Therapeutics Industry Volume mg Forecast, by Country 2019 & 2032
- Table 35: China Pulmonary Embolism Therapeutics Industry Revenue (Billion) Forecast, by Application 2019 & 2032
- Table 36: China Pulmonary Embolism Therapeutics Industry Volume (mg) Forecast, by Application 2019 & 2032
- Table 37: Japan Pulmonary Embolism Therapeutics Industry Revenue (Billion) Forecast, by Application 2019 & 2032
- Table 38: Japan Pulmonary Embolism Therapeutics Industry Volume (mg) Forecast, by Application 2019 & 2032
- Table 39: India Pulmonary Embolism Therapeutics Industry Revenue (Billion) Forecast, by Application 2019 & 2032
- Table 40: India Pulmonary Embolism Therapeutics Industry Volume (mg) Forecast, by Application 2019 & 2032
- Table 41: Australia Pulmonary Embolism Therapeutics Industry Revenue (Billion) Forecast, by Application 2019 & 2032
- Table 42: Australia Pulmonary Embolism Therapeutics Industry Volume (mg) Forecast, by Application 2019 & 2032
- Table 43: South Korea Pulmonary Embolism Therapeutics Industry Revenue (Billion) Forecast, by Application 2019 & 2032
- Table 44: South Korea Pulmonary Embolism Therapeutics Industry Volume (mg) Forecast, by Application 2019 & 2032
- Table 45: Rest of Asia Pacific Pulmonary Embolism Therapeutics Industry Revenue (Billion) Forecast, by Application 2019 & 2032
- Table 46: Rest of Asia Pacific Pulmonary Embolism Therapeutics Industry Volume (mg) Forecast, by Application 2019 & 2032
- Table 47: Global Pulmonary Embolism Therapeutics Industry Revenue Billion Forecast, by Country 2019 & 2032
- Table 48: Global Pulmonary Embolism Therapeutics Industry Volume mg Forecast, by Country 2019 & 2032
- Table 49: GCC Pulmonary Embolism Therapeutics Industry Revenue (Billion) Forecast, by Application 2019 & 2032
- Table 50: GCC Pulmonary Embolism Therapeutics Industry Volume (mg) Forecast, by Application 2019 & 2032
- Table 51: South Africa Pulmonary Embolism Therapeutics Industry Revenue (Billion) Forecast, by Application 2019 & 2032
- Table 52: South Africa Pulmonary Embolism Therapeutics Industry Volume (mg) Forecast, by Application 2019 & 2032
- Table 53: Rest of Middle East and Africa Pulmonary Embolism Therapeutics Industry Revenue (Billion) Forecast, by Application 2019 & 2032
- Table 54: Rest of Middle East and Africa Pulmonary Embolism Therapeutics Industry Volume (mg) Forecast, by Application 2019 & 2032
- Table 55: Global Pulmonary Embolism Therapeutics Industry Revenue Billion Forecast, by Country 2019 & 2032
- Table 56: Global Pulmonary Embolism Therapeutics Industry Volume mg Forecast, by Country 2019 & 2032
- Table 57: Brazil Pulmonary Embolism Therapeutics Industry Revenue (Billion) Forecast, by Application 2019 & 2032
- Table 58: Brazil Pulmonary Embolism Therapeutics Industry Volume (mg) Forecast, by Application 2019 & 2032
- Table 59: Argentina Pulmonary Embolism Therapeutics Industry Revenue (Billion) Forecast, by Application 2019 & 2032
- Table 60: Argentina Pulmonary Embolism Therapeutics Industry Volume (mg) Forecast, by Application 2019 & 2032
- Table 61: Rest of South America Pulmonary Embolism Therapeutics Industry Revenue (Billion) Forecast, by Application 2019 & 2032
- Table 62: Rest of South America Pulmonary Embolism Therapeutics Industry Volume (mg) Forecast, by Application 2019 & 2032
- Table 63: Global Pulmonary Embolism Therapeutics Industry Revenue Billion Forecast, by Drug Class 2019 & 2032
- Table 64: Global Pulmonary Embolism Therapeutics Industry Volume mg Forecast, by Drug Class 2019 & 2032
- Table 65: Global Pulmonary Embolism Therapeutics Industry Revenue Billion Forecast, by Disease Type 2019 & 2032
- Table 66: Global Pulmonary Embolism Therapeutics Industry Volume mg Forecast, by Disease Type 2019 & 2032
- Table 67: Global Pulmonary Embolism Therapeutics Industry Revenue Billion Forecast, by Distribution Channel 2019 & 2032
- Table 68: Global Pulmonary Embolism Therapeutics Industry Volume mg Forecast, by Distribution Channel 2019 & 2032
- Table 69: Global Pulmonary Embolism Therapeutics Industry Revenue Billion Forecast, by Country 2019 & 2032
- Table 70: Global Pulmonary Embolism Therapeutics Industry Volume mg Forecast, by Country 2019 & 2032
- Table 71: United States Pulmonary Embolism Therapeutics Industry Revenue (Billion) Forecast, by Application 2019 & 2032
- Table 72: United States Pulmonary Embolism Therapeutics Industry Volume (mg) Forecast, by Application 2019 & 2032
- Table 73: Canada Pulmonary Embolism Therapeutics Industry Revenue (Billion) Forecast, by Application 2019 & 2032
- Table 74: Canada Pulmonary Embolism Therapeutics Industry Volume (mg) Forecast, by Application 2019 & 2032
- Table 75: Mexico Pulmonary Embolism Therapeutics Industry Revenue (Billion) Forecast, by Application 2019 & 2032
- Table 76: Mexico Pulmonary Embolism Therapeutics Industry Volume (mg) Forecast, by Application 2019 & 2032
- Table 77: Global Pulmonary Embolism Therapeutics Industry Revenue Billion Forecast, by Drug Class 2019 & 2032
- Table 78: Global Pulmonary Embolism Therapeutics Industry Volume mg Forecast, by Drug Class 2019 & 2032
- Table 79: Global Pulmonary Embolism Therapeutics Industry Revenue Billion Forecast, by Disease Type 2019 & 2032
- Table 80: Global Pulmonary Embolism Therapeutics Industry Volume mg Forecast, by Disease Type 2019 & 2032
- Table 81: Global Pulmonary Embolism Therapeutics Industry Revenue Billion Forecast, by Distribution Channel 2019 & 2032
- Table 82: Global Pulmonary Embolism Therapeutics Industry Volume mg Forecast, by Distribution Channel 2019 & 2032
- Table 83: Global Pulmonary Embolism Therapeutics Industry Revenue Billion Forecast, by Country 2019 & 2032
- Table 84: Global Pulmonary Embolism Therapeutics Industry Volume mg Forecast, by Country 2019 & 2032
- Table 85: Germany Pulmonary Embolism Therapeutics Industry Revenue (Billion) Forecast, by Application 2019 & 2032
- Table 86: Germany Pulmonary Embolism Therapeutics Industry Volume (mg) Forecast, by Application 2019 & 2032
- Table 87: United Kingdom Pulmonary Embolism Therapeutics Industry Revenue (Billion) Forecast, by Application 2019 & 2032
- Table 88: United Kingdom Pulmonary Embolism Therapeutics Industry Volume (mg) Forecast, by Application 2019 & 2032
- Table 89: France Pulmonary Embolism Therapeutics Industry Revenue (Billion) Forecast, by Application 2019 & 2032
- Table 90: France Pulmonary Embolism Therapeutics Industry Volume (mg) Forecast, by Application 2019 & 2032
- Table 91: Italy Pulmonary Embolism Therapeutics Industry Revenue (Billion) Forecast, by Application 2019 & 2032
- Table 92: Italy Pulmonary Embolism Therapeutics Industry Volume (mg) Forecast, by Application 2019 & 2032
- Table 93: Spain Pulmonary Embolism Therapeutics Industry Revenue (Billion) Forecast, by Application 2019 & 2032
- Table 94: Spain Pulmonary Embolism Therapeutics Industry Volume (mg) Forecast, by Application 2019 & 2032
- Table 95: Rest of Europe Pulmonary Embolism Therapeutics Industry Revenue (Billion) Forecast, by Application 2019 & 2032
- Table 96: Rest of Europe Pulmonary Embolism Therapeutics Industry Volume (mg) Forecast, by Application 2019 & 2032
- Table 97: Global Pulmonary Embolism Therapeutics Industry Revenue Billion Forecast, by Drug Class 2019 & 2032
- Table 98: Global Pulmonary Embolism Therapeutics Industry Volume mg Forecast, by Drug Class 2019 & 2032
- Table 99: Global Pulmonary Embolism Therapeutics Industry Revenue Billion Forecast, by Disease Type 2019 & 2032
- Table 100: Global Pulmonary Embolism Therapeutics Industry Volume mg Forecast, by Disease Type 2019 & 2032
- Table 101: Global Pulmonary Embolism Therapeutics Industry Revenue Billion Forecast, by Distribution Channel 2019 & 2032
- Table 102: Global Pulmonary Embolism Therapeutics Industry Volume mg Forecast, by Distribution Channel 2019 & 2032
- Table 103: Global Pulmonary Embolism Therapeutics Industry Revenue Billion Forecast, by Country 2019 & 2032
- Table 104: Global Pulmonary Embolism Therapeutics Industry Volume mg Forecast, by Country 2019 & 2032
- Table 105: China Pulmonary Embolism Therapeutics Industry Revenue (Billion) Forecast, by Application 2019 & 2032
- Table 106: China Pulmonary Embolism Therapeutics Industry Volume (mg) Forecast, by Application 2019 & 2032
- Table 107: Japan Pulmonary Embolism Therapeutics Industry Revenue (Billion) Forecast, by Application 2019 & 2032
- Table 108: Japan Pulmonary Embolism Therapeutics Industry Volume (mg) Forecast, by Application 2019 & 2032
- Table 109: India Pulmonary Embolism Therapeutics Industry Revenue (Billion) Forecast, by Application 2019 & 2032
- Table 110: India Pulmonary Embolism Therapeutics Industry Volume (mg) Forecast, by Application 2019 & 2032
- Table 111: Australia Pulmonary Embolism Therapeutics Industry Revenue (Billion) Forecast, by Application 2019 & 2032
- Table 112: Australia Pulmonary Embolism Therapeutics Industry Volume (mg) Forecast, by Application 2019 & 2032
- Table 113: South Korea Pulmonary Embolism Therapeutics Industry Revenue (Billion) Forecast, by Application 2019 & 2032
- Table 114: South Korea Pulmonary Embolism Therapeutics Industry Volume (mg) Forecast, by Application 2019 & 2032
- Table 115: Rest of Asia Pacific Pulmonary Embolism Therapeutics Industry Revenue (Billion) Forecast, by Application 2019 & 2032
- Table 116: Rest of Asia Pacific Pulmonary Embolism Therapeutics Industry Volume (mg) Forecast, by Application 2019 & 2032
- Table 117: Global Pulmonary Embolism Therapeutics Industry Revenue Billion Forecast, by Drug Class 2019 & 2032
- Table 118: Global Pulmonary Embolism Therapeutics Industry Volume mg Forecast, by Drug Class 2019 & 2032
- Table 119: Global Pulmonary Embolism Therapeutics Industry Revenue Billion Forecast, by Disease Type 2019 & 2032
- Table 120: Global Pulmonary Embolism Therapeutics Industry Volume mg Forecast, by Disease Type 2019 & 2032
- Table 121: Global Pulmonary Embolism Therapeutics Industry Revenue Billion Forecast, by Distribution Channel 2019 & 2032
- Table 122: Global Pulmonary Embolism Therapeutics Industry Volume mg Forecast, by Distribution Channel 2019 & 2032
- Table 123: Global Pulmonary Embolism Therapeutics Industry Revenue Billion Forecast, by Country 2019 & 2032
- Table 124: Global Pulmonary Embolism Therapeutics Industry Volume mg Forecast, by Country 2019 & 2032
- Table 125: GCC Pulmonary Embolism Therapeutics Industry Revenue (Billion) Forecast, by Application 2019 & 2032
- Table 126: GCC Pulmonary Embolism Therapeutics Industry Volume (mg) Forecast, by Application 2019 & 2032
- Table 127: South Africa Pulmonary Embolism Therapeutics Industry Revenue (Billion) Forecast, by Application 2019 & 2032
- Table 128: South Africa Pulmonary Embolism Therapeutics Industry Volume (mg) Forecast, by Application 2019 & 2032
- Table 129: Rest of Middle East and Africa Pulmonary Embolism Therapeutics Industry Revenue (Billion) Forecast, by Application 2019 & 2032
- Table 130: Rest of Middle East and Africa Pulmonary Embolism Therapeutics Industry Volume (mg) Forecast, by Application 2019 & 2032
- Table 131: Global Pulmonary Embolism Therapeutics Industry Revenue Billion Forecast, by Drug Class 2019 & 2032
- Table 132: Global Pulmonary Embolism Therapeutics Industry Volume mg Forecast, by Drug Class 2019 & 2032
- Table 133: Global Pulmonary Embolism Therapeutics Industry Revenue Billion Forecast, by Disease Type 2019 & 2032
- Table 134: Global Pulmonary Embolism Therapeutics Industry Volume mg Forecast, by Disease Type 2019 & 2032
- Table 135: Global Pulmonary Embolism Therapeutics Industry Revenue Billion Forecast, by Distribution Channel 2019 & 2032
- Table 136: Global Pulmonary Embolism Therapeutics Industry Volume mg Forecast, by Distribution Channel 2019 & 2032
- Table 137: Global Pulmonary Embolism Therapeutics Industry Revenue Billion Forecast, by Country 2019 & 2032
- Table 138: Global Pulmonary Embolism Therapeutics Industry Volume mg Forecast, by Country 2019 & 2032
- Table 139: Brazil Pulmonary Embolism Therapeutics Industry Revenue (Billion) Forecast, by Application 2019 & 2032
- Table 140: Brazil Pulmonary Embolism Therapeutics Industry Volume (mg) Forecast, by Application 2019 & 2032
- Table 141: Argentina Pulmonary Embolism Therapeutics Industry Revenue (Billion) Forecast, by Application 2019 & 2032
- Table 142: Argentina Pulmonary Embolism Therapeutics Industry Volume (mg) Forecast, by Application 2019 & 2032
- Table 143: Rest of South America Pulmonary Embolism Therapeutics Industry Revenue (Billion) Forecast, by Application 2019 & 2032
- Table 144: Rest of South America Pulmonary Embolism Therapeutics Industry Volume (mg) Forecast, by Application 2019 & 2032
Frequently Asked Questions
1. What is the projected Compound Annual Growth Rate (CAGR) of the Pulmonary Embolism Therapeutics Industry?
The projected CAGR is approximately 9.00%.
2. Which companies are prominent players in the Pulmonary Embolism Therapeutics Industry?
Key companies in the market include Sanofi SA, Boehringer Ingelheim GmbH, Bayer AG, AstraZeneca PLC, Bristol-Myers Squibb, Teva Pharmaceutical Industries Ltd, Johnson & Johnson, Swiss Pharma Pvt Ltd*List Not Exhaustive, Laurus Lab (Aspen Pharmacare Holdings Limited), Pfizer Inc.
3. What are the main segments of the Pulmonary Embolism Therapeutics Industry?
The market segments include Drug Class, Disease Type, Distribution Channel.
4. Can you provide details about the market size?
The market size is estimated to be USD 1.13 Billion as of 2022.
5. What are some drivers contributing to market growth?
Growing Geriatric and Obese Population; Increasing Burden of Cardiovascular and Trauma Cases; Increasing Technological Advancements in Hematology.
6. What are the notable trends driving market growth?
Deep Vein Thrombosis (DVT) Segment is Expected to Register a Significant Growth during the Forecast Period.
7. Are there any restraints impacting market growth?
Lack of Awareness about Venous Thromboembolism Conditions; Side Effects Caused. due to Thrombosis Drugs.
8. Can you provide examples of recent developments in the market?
February 2023: Bayer announced that first patients had been enrolled in the initial trials for its OCEANIC clinical trial program, designed to explore the use of asundexian (BAY2433334), an investigational oral Factor XIa (FXIa) inhibitor, in patients with atrial fibrillation (AF) and in patients with a non-cardioembolic ischemic stroke or high-risk transient ischemic attack (TIA), a temporary period of symptoms similar to those of a stroke.
9. What pricing options are available for accessing the report?
Pricing options include single-user, multi-user, and enterprise licenses priced at USD 4750, USD 5250, and USD 8750 respectively.
10. Is the market size provided in terms of value or volume?
The market size is provided in terms of value, measured in Billion and volume, measured in mg.
11. Are there any specific market keywords associated with the report?
Yes, the market keyword associated with the report is "Pulmonary Embolism Therapeutics Industry," which aids in identifying and referencing the specific market segment covered.
12. How do I determine which pricing option suits my needs best?
The pricing options vary based on user requirements and access needs. Individual users may opt for single-user licenses, while businesses requiring broader access may choose multi-user or enterprise licenses for cost-effective access to the report.
13. Are there any additional resources or data provided in the Pulmonary Embolism Therapeutics Industry report?
While the report offers comprehensive insights, it's advisable to review the specific contents or supplementary materials provided to ascertain if additional resources or data are available.
14. How can I stay updated on further developments or reports in the Pulmonary Embolism Therapeutics Industry?
To stay informed about further developments, trends, and reports in the Pulmonary Embolism Therapeutics Industry, consider subscribing to industry newsletters, following relevant companies and organizations, or regularly checking reputable industry news sources and publications.
Methodology
Step 1 - Identification of Relevant Samples Size from Population Database


Step 2 - Approaches for Defining Global Market Size (Value, Volume* & Price*)

Note*: In applicable scenarios
Step 3 - Data Sources
Primary Research
- Web Analytics
- Survey Reports
- Research Institute
- Latest Research Reports
- Opinion Leaders
Secondary Research
- Annual Reports
- White Paper
- Latest Press Release
- Industry Association
- Paid Database
- Investor Presentations

Step 4 - Data Triangulation
Involves using different sources of information in order to increase the validity of a study
These sources are likely to be stakeholders in a program - participants, other researchers, program staff, other community members, and so on.
Then we put all data in single framework & apply various statistical tools to find out the dynamic on the market.
During the analysis stage, feedback from the stakeholder groups would be compared to determine areas of agreement as well as areas of divergence
