

Key Insights
The global qPCR Reagent market is experiencing robust growth, driven by the increasing prevalence of infectious diseases, the rising demand for personalized medicine, and the expanding application of qPCR technology in various research and diagnostic settings. The market's 7.90% CAGR indicates significant potential for expansion throughout the forecast period (2025-2033). Key segments driving this growth include dye-based qPCR reagents, which offer cost-effectiveness, and probe-based qPCR reagents, providing superior sensitivity and specificity. qPCR core kits and master mixes are preferred packaging types, simplifying workflow and improving reproducibility for users. Hospitals and diagnostic centers remain the largest end-users, fueled by the need for rapid and accurate pathogen detection and disease monitoring. However, research laboratories and academic institutions also contribute significantly, driving innovation and the development of advanced qPCR applications. Geographic distribution shows strong performance in North America and Europe, due to well-established healthcare infrastructure and advanced research capabilities; however, the Asia-Pacific region is expected to witness substantial growth in the coming years due to increasing investments in healthcare and research facilities.
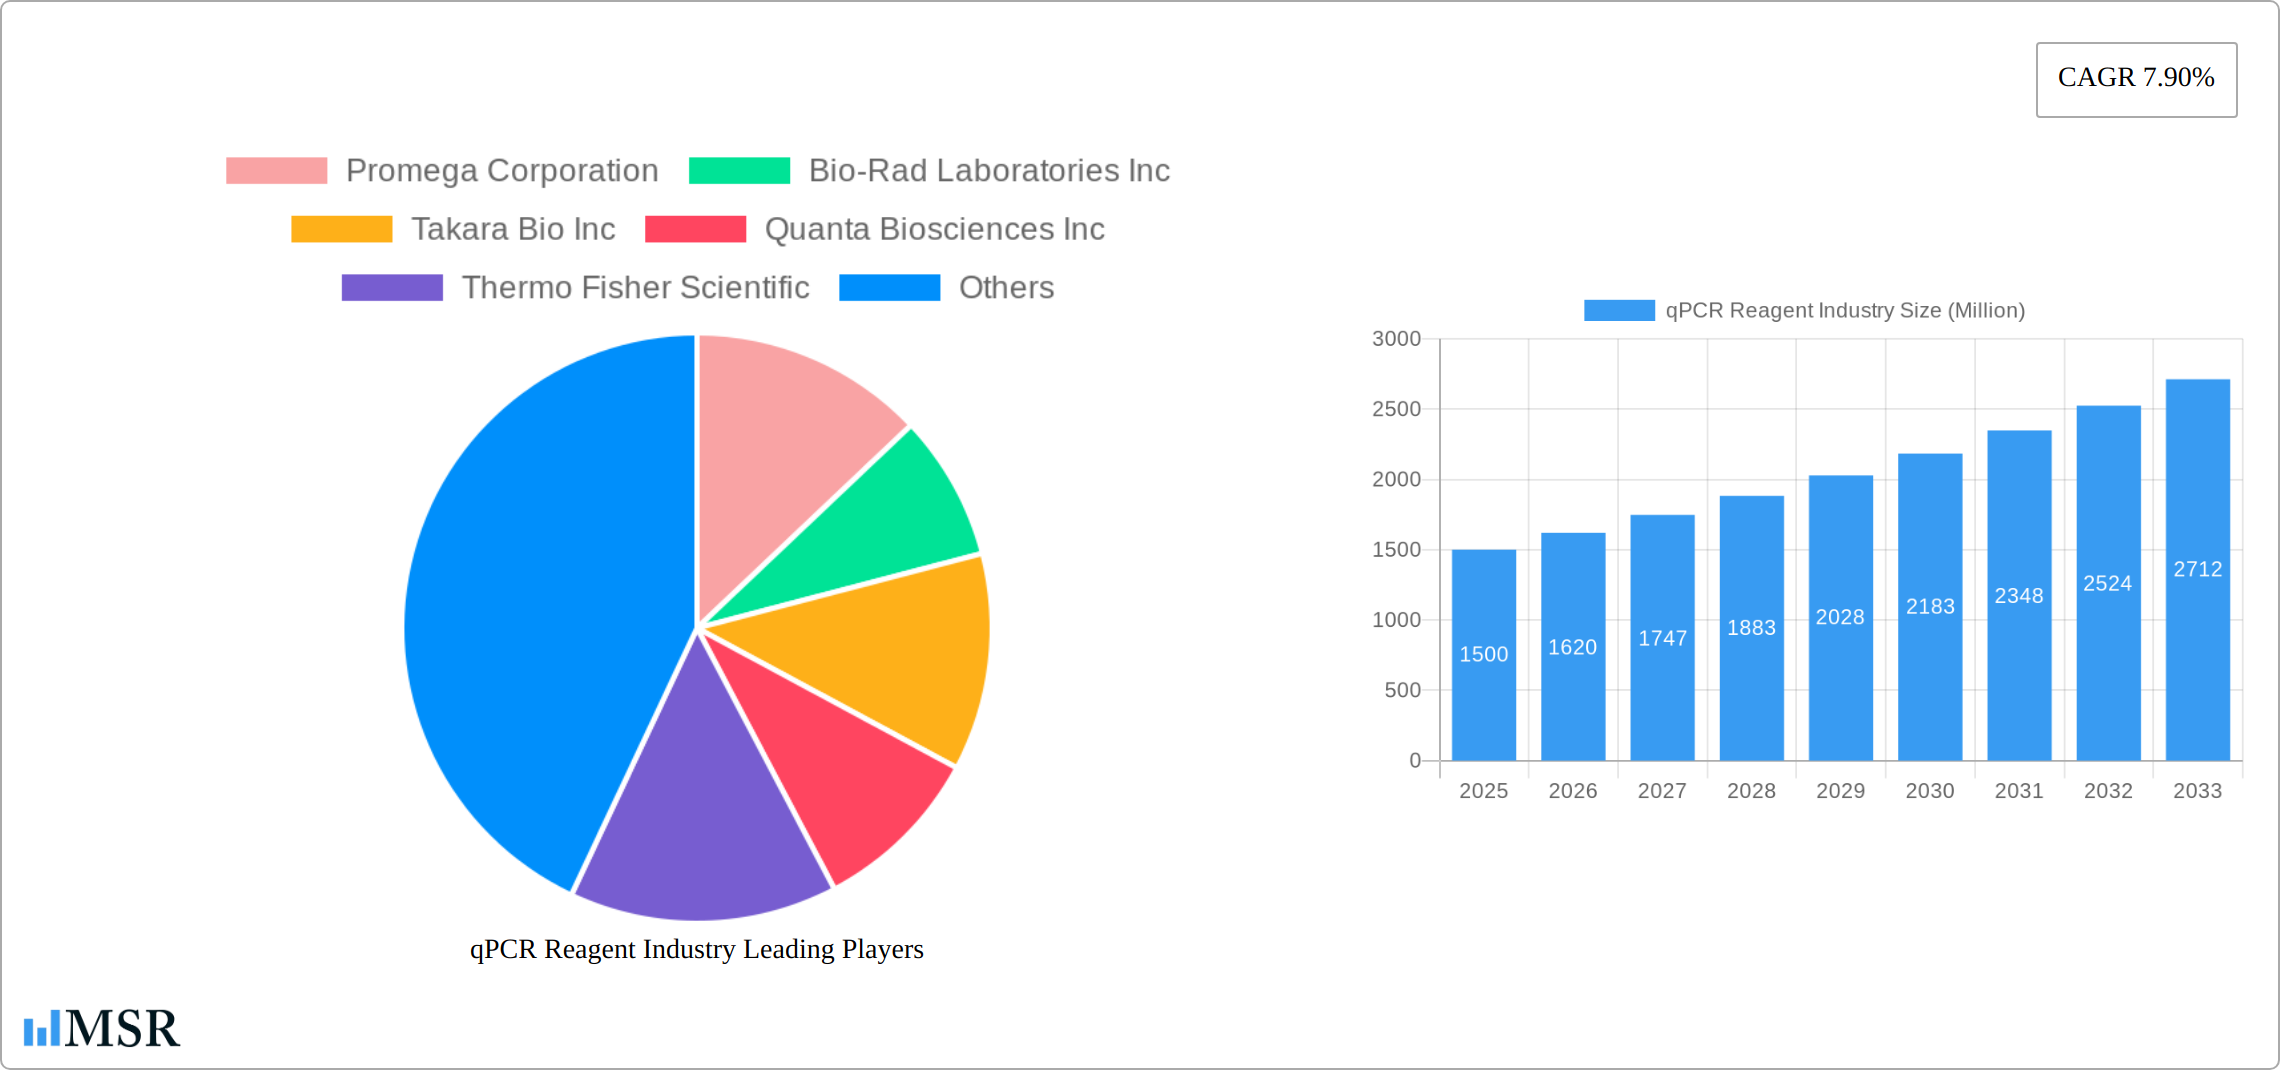
Competition in the qPCR reagent market is intense, with established players like Promega, Bio-Rad, Takara Bio, and Thermo Fisher Scientific holding significant market share. These companies continually invest in R&D to offer innovative products, improve performance, and expand their product portfolios. The market faces challenges, including the high cost of reagents and the need for specialized equipment. However, technological advancements, such as the development of multiplex qPCR assays and real-time PCR instruments integrated with advanced data analysis capabilities, are mitigating these restraints and opening new avenues for market expansion. The ongoing demand for sensitive, accurate, and high-throughput diagnostic tools will continue to be a primary driver of market growth, making qPCR reagents a crucial component of the global life sciences and healthcare industry.
qPCR Reagent Industry: A Comprehensive Market Report (2019-2033)
This comprehensive report provides a detailed analysis of the qPCR Reagent industry, offering invaluable insights for stakeholders seeking to navigate this dynamic market. Covering the period from 2019 to 2033, with a focus on 2025, this report analyzes market size, growth drivers, competitive landscape, and future trends, empowering informed decision-making. The global qPCR Reagent market is projected to reach xx Million by 2033, exhibiting a CAGR of xx% during the forecast period (2025-2033).
qPCR Reagent Industry Market Concentration & Dynamics
The qPCR reagent market exhibits a moderately concentrated landscape, dominated by a handful of multinational corporations alongside several specialized players. Market share distribution is dynamic, with ongoing competition fueled by innovation and mergers & acquisitions (M&A).
- Market Leaders: Promega Corporation, Bio-Rad Laboratories Inc, Takara Bio Inc, Quanta Biosciences Inc, Thermo Fisher Scientific, Sigma-Aldrich Corporation (Merck KGaA), Agilent Technologies Inc, F Hoffman-La Roche Ltd, Kaneka Eurogentec S A collectively hold approximately xx% of the market share.
- Innovation Ecosystems: Significant investments in R&D drive continuous improvements in reagent sensitivity, specificity, and multiplex capabilities. The emergence of digital PCR and next-generation sequencing technologies present both opportunities and challenges.
- Regulatory Frameworks: Stringent regulatory compliance requirements, particularly in healthcare and diagnostics, significantly impact market dynamics. Compliance costs and approval timelines can influence market entry and product lifecycles.
- Substitute Products: While qPCR remains the gold standard for many applications, alternative gene expression analysis methods, such as digital PCR and microarrays, pose a degree of competitive pressure.
- End-User Trends: The growing demand for personalized medicine, increased research activities in oncology, infectious diseases, and genomics are key drivers for market growth. The shift towards high-throughput screening further fuels demand for efficient and reliable qPCR reagents.
- M&A Activities: The number of M&A deals in the qPCR reagent sector has averaged xx per year during the historical period (2019-2024), reflecting strategic consolidation and expansion efforts by major players. This activity is projected to continue at a similar rate in the forecast period.
qPCR Reagent Industry Insights & Trends
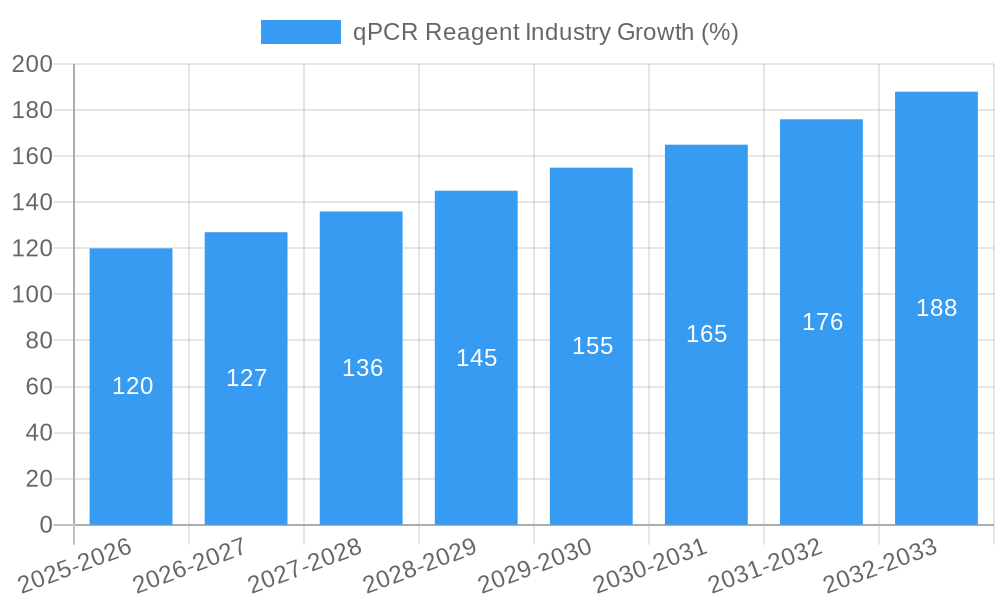
The qPCR reagent market demonstrates robust growth, driven by several key factors. The market size was valued at xx Million in 2024 and is anticipated to reach xx Million by 2033, reflecting a significant expansion. Technological advancements, including the development of more efficient and sensitive reagents, improved instrumentation, and automation capabilities, consistently propel market expansion. The increasing prevalence of infectious diseases and the rising need for rapid diagnostics have significantly boosted demand for qPCR-based tests. Moreover, the increasing adoption of qPCR in research settings, particularly within academic and pharmaceutical industries, contributes to the overall market expansion. These factors collectively contribute to the projected xx% CAGR. The rise of personalized medicine and the increasing use of qPCR in various applications across different end-user segments have further amplified the market’s growth trajectory.
Key Markets & Segments Leading qPCR Reagent Industry
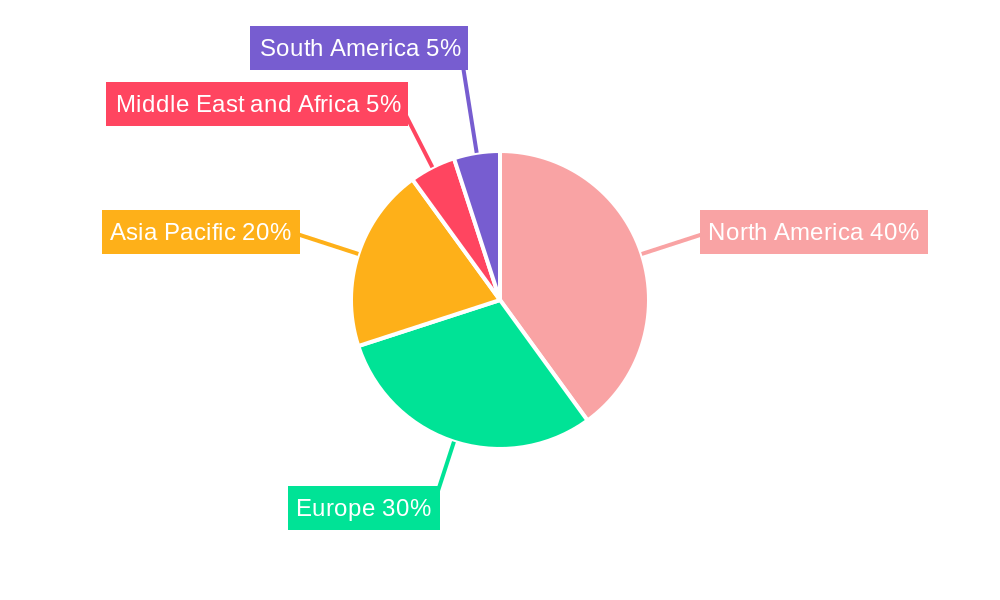
The North American region currently holds the largest market share within the qPCR reagent industry, followed by Europe and Asia Pacific. This dominance stems from several factors:
North America:
- Drivers: Strong research infrastructure, high healthcare expenditure, and a well-established diagnostic sector.
- Segments: Probes and Primer-Based qPCR Reagents and qPCR Mastermixes are the leading segments due to their high sensitivity and convenience. Hospitals & Diagnostic Centers represent a significant portion of end-user demand.
Europe:
- Drivers: Growing investment in research and development, particularly in life sciences, and a significant pharmaceutical industry.
- Segments: Similar to North America, Probes and Primer-Based qPCR Reagents and qPCR Mastermixes demonstrate robust growth, driven by advancements in the life sciences and diagnostic industry.
Asia Pacific:
- Drivers: Rapid economic growth, expanding healthcare infrastructure, and increased government spending on healthcare and research.
- Segments: While the market is growing rapidly, Dye-Based qPCR Reagents currently hold a larger market share due to their cost-effectiveness. Research Laboratories & Academic Institutes show significant growth potential.
Other Regions: The qPCR reagent market is also experiencing growth in other regions, although at a slower pace compared to North America and Europe. Factors such as economic conditions, regulatory frameworks, and healthcare infrastructure heavily influence market expansion in these regions.
qPCR Reagent Industry Product Developments
Recent product innovations showcase a strong emphasis on improved sensitivity, specificity, multiplexing capabilities, and ease of use. The launch of novel qPCR reagent mixes by PCR Biosystems (Clara family) and Integrated DNA Technologies' PrimeTime qPCR One-Step Master Mix highlight these advancements, offering improved performance and efficiency. These developments cater to increasing demands for high-throughput screening and faster turnaround times in clinical diagnostics and research laboratories. The competitive edge is gained through superior performance characteristics, user-friendly formats, and specific applications (e.g., viral research).
Challenges in the qPCR Reagent Industry Market
Several challenges impede the growth of the qPCR reagent market. Regulatory hurdles and stringent approval processes can delay product launches and increase costs. Supply chain disruptions, particularly those concerning raw materials and specialized components, can limit production and cause price fluctuations. Moreover, intense competition among established players and the emergence of new technologies present ongoing pressures on pricing and market share. These challenges collectively influence market dynamics and profitability. Estimates suggest that supply chain disruptions alone negatively affected market growth by approximately xx Million in 2022.
Forces Driving qPCR Reagent Industry Growth
Several factors drive the expansion of the qPCR reagent market. Technological advancements continuously improve reagent performance and broaden application areas. The increasing prevalence of infectious diseases and the need for rapid and accurate diagnostics significantly fuels demand. Government funding for research and development in the life sciences further stimulates market expansion. Economic growth, particularly in developing economies, boosts healthcare investment and contributes to the market's increasing size. These factors collectively foster a robust and expanding market.
Long-Term Growth Catalysts in the qPCR Reagent Industry
Long-term growth in the qPCR reagent market is fueled by continued technological innovation, strategic partnerships between reagent manufacturers and instrument providers, and expansion into new markets, particularly in emerging economies. The development of more user-friendly formats, automated workflows, and higher-throughput platforms will drive adoption and expansion. The focus on personalized medicine and the expanding applications of qPCR in various fields, such as environmental monitoring and food safety, promise continuous market growth for the foreseeable future.
Emerging Opportunities in qPCR Reagent Industry
Several emerging opportunities are shaping the future of the qPCR reagent market. The growing demand for point-of-care diagnostics, especially in resource-limited settings, presents significant opportunities for developing portable and user-friendly qPCR platforms. The application of qPCR in areas such as environmental monitoring and food safety is also expanding rapidly, creating new markets for specialized reagents. The development of novel chemistries and technologies that improve the sensitivity and specificity of qPCR assays will lead to new market entries and further market penetration.
Leading Players in the qPCR Reagent Industry Sector
- Promega Corporation
- Bio-Rad Laboratories Inc
- Takara Bio Inc
- Quanta Biosciences Inc
- Thermo Fisher Scientific
- Sigma-Aldrich Corporation (Merck KGaA)
- Agilent Technologies Inc
- F Hoffman-La Roche Ltd
- Kaneka Eurogentec S A
Key Milestones in qPCR Reagent Industry
- November 2022: PCR Biosystems launched the Clara family of qPCR reagent mixes (Clara Probe Mix, Clara Probe 1-Step Mix, and Clara HRM Mix), significantly enhancing performance capabilities and impacting the market by introducing a new standard for sensitivity and reliability.
- September 2022: Integrated DNA Technologies launched PrimeTime qPCR One-Step Master Mix, featuring a unique mutant enzyme, simplifying workflows and boosting efficiency, primarily impacting viral research and gene expression analysis applications.
Strategic Outlook for qPCR Reagent Industry Market
The qPCR reagent market is poised for continued growth, driven by technological advancements, expanding applications, and increasing investments in healthcare and research. Strategic opportunities lie in developing innovative products catering to emerging diagnostic needs, expanding into new geographical markets, and forging strategic collaborations to enhance market reach and influence. Focusing on personalized medicine, high-throughput solutions, and user-friendly platforms will be key to securing a robust market position in the years to come. The projected market expansion offers significant growth potential for existing players and newcomers alike.
qPCR Reagent Industry Segmentation
-
1. Detection Method
- 1.1. Dye-Based qPCR Reagents
- 1.2. Probes and Primer-Based qPCR Reagents
-
2. Packaging Type
- 2.1. qPCR Core Kits
- 2.2. qPCR Mastermixes
-
3. End-User
- 3.1. Hospitals & Diagnostic Centers
- 3.2. Research Laboratories & Academic Institutes
- 3.3. Others
qPCR Reagent Industry Segmentation By Geography
-
1. North America
- 1.1. United States
- 1.2. Canada
- 1.3. Mexico
-
2. Europe
- 2.1. Germany
- 2.2. United Kingdom
- 2.3. France
- 2.4. Italy
- 2.5. Spain
- 2.6. Rest of Europe
-
3. Asia Pacific
- 3.1. China
- 3.2. Japan
- 3.3. India
- 3.4. Australia
- 3.5. South Korea
- 3.6. Rest of Asia Pacific
-
4. Middle East and Africa
- 4.1. GCC
- 4.2. South Africa
- 4.3. Rest of Middle East and Africa
-
5. South America
- 5.1. Brazil
- 5.2. Argentina
- 5.3. Rest of South America
qPCR Reagent Industry REPORT HIGHLIGHTS
| Aspects | Details |
|---|---|
| Study Period | 2019-2033 |
| Base Year | 2024 |
| Estimated Year | 2025 |
| Forecast Period | 2025-2033 |
| Historical Period | 2019-2024 |
| Growth Rate | CAGR of 7.90% from 2019-2033 |
| Segmentation |
|
Table of Contents
- 1. Introduction
- 1.1. Research Scope
- 1.2. Market Segmentation
- 1.3. Research Methodology
- 1.4. Definitions and Assumptions
- 2. Executive Summary
- 2.1. Introduction
- 3. Market Dynamics
- 3.1. Introduction
- 3.2. Market Drivers
- 3.2.1. Rising Incidence of Infectious Diseases and Genetic Disorders; Growing Geriatric Population; Increasing Focus on Human Genome Projects
- 3.3. Market Restrains
- 3.3.1. High Cost of Reagents and qPCR Equipment; Lack of Technical Expertise to Operate the qPCR instrument
- 3.4. Market Trends
- 3.4.1. Dye-Based qPCR Reagents are Expected to Dominate the Market
- 4. Market Factor Analysis
- 4.1. Porters Five Forces
- 4.2. Supply/Value Chain
- 4.3. PESTEL analysis
- 4.4. Market Entropy
- 4.5. Patent/Trademark Analysis
- 5. Global qPCR Reagent Industry Analysis, Insights and Forecast, 2019-2031
- 5.1. Market Analysis, Insights and Forecast - by Detection Method
- 5.1.1. Dye-Based qPCR Reagents
- 5.1.2. Probes and Primer-Based qPCR Reagents
- 5.2. Market Analysis, Insights and Forecast - by Packaging Type
- 5.2.1. qPCR Core Kits
- 5.2.2. qPCR Mastermixes
- 5.3. Market Analysis, Insights and Forecast - by End-User
- 5.3.1. Hospitals & Diagnostic Centers
- 5.3.2. Research Laboratories & Academic Institutes
- 5.3.3. Others
- 5.4. Market Analysis, Insights and Forecast - by Region
- 5.4.1. North America
- 5.4.2. Europe
- 5.4.3. Asia Pacific
- 5.4.4. Middle East and Africa
- 5.4.5. South America
- 5.1. Market Analysis, Insights and Forecast - by Detection Method
- 6. North America qPCR Reagent Industry Analysis, Insights and Forecast, 2019-2031
- 6.1. Market Analysis, Insights and Forecast - by Detection Method
- 6.1.1. Dye-Based qPCR Reagents
- 6.1.2. Probes and Primer-Based qPCR Reagents
- 6.2. Market Analysis, Insights and Forecast - by Packaging Type
- 6.2.1. qPCR Core Kits
- 6.2.2. qPCR Mastermixes
- 6.3. Market Analysis, Insights and Forecast - by End-User
- 6.3.1. Hospitals & Diagnostic Centers
- 6.3.2. Research Laboratories & Academic Institutes
- 6.3.3. Others
- 6.1. Market Analysis, Insights and Forecast - by Detection Method
- 7. Europe qPCR Reagent Industry Analysis, Insights and Forecast, 2019-2031
- 7.1. Market Analysis, Insights and Forecast - by Detection Method
- 7.1.1. Dye-Based qPCR Reagents
- 7.1.2. Probes and Primer-Based qPCR Reagents
- 7.2. Market Analysis, Insights and Forecast - by Packaging Type
- 7.2.1. qPCR Core Kits
- 7.2.2. qPCR Mastermixes
- 7.3. Market Analysis, Insights and Forecast - by End-User
- 7.3.1. Hospitals & Diagnostic Centers
- 7.3.2. Research Laboratories & Academic Institutes
- 7.3.3. Others
- 7.1. Market Analysis, Insights and Forecast - by Detection Method
- 8. Asia Pacific qPCR Reagent Industry Analysis, Insights and Forecast, 2019-2031
- 8.1. Market Analysis, Insights and Forecast - by Detection Method
- 8.1.1. Dye-Based qPCR Reagents
- 8.1.2. Probes and Primer-Based qPCR Reagents
- 8.2. Market Analysis, Insights and Forecast - by Packaging Type
- 8.2.1. qPCR Core Kits
- 8.2.2. qPCR Mastermixes
- 8.3. Market Analysis, Insights and Forecast - by End-User
- 8.3.1. Hospitals & Diagnostic Centers
- 8.3.2. Research Laboratories & Academic Institutes
- 8.3.3. Others
- 8.1. Market Analysis, Insights and Forecast - by Detection Method
- 9. Middle East and Africa qPCR Reagent Industry Analysis, Insights and Forecast, 2019-2031
- 9.1. Market Analysis, Insights and Forecast - by Detection Method
- 9.1.1. Dye-Based qPCR Reagents
- 9.1.2. Probes and Primer-Based qPCR Reagents
- 9.2. Market Analysis, Insights and Forecast - by Packaging Type
- 9.2.1. qPCR Core Kits
- 9.2.2. qPCR Mastermixes
- 9.3. Market Analysis, Insights and Forecast - by End-User
- 9.3.1. Hospitals & Diagnostic Centers
- 9.3.2. Research Laboratories & Academic Institutes
- 9.3.3. Others
- 9.1. Market Analysis, Insights and Forecast - by Detection Method
- 10. South America qPCR Reagent Industry Analysis, Insights and Forecast, 2019-2031
- 10.1. Market Analysis, Insights and Forecast - by Detection Method
- 10.1.1. Dye-Based qPCR Reagents
- 10.1.2. Probes and Primer-Based qPCR Reagents
- 10.2. Market Analysis, Insights and Forecast - by Packaging Type
- 10.2.1. qPCR Core Kits
- 10.2.2. qPCR Mastermixes
- 10.3. Market Analysis, Insights and Forecast - by End-User
- 10.3.1. Hospitals & Diagnostic Centers
- 10.3.2. Research Laboratories & Academic Institutes
- 10.3.3. Others
- 10.1. Market Analysis, Insights and Forecast - by Detection Method
- 11. North America qPCR Reagent Industry Analysis, Insights and Forecast, 2019-2031
- 11.1. Market Analysis, Insights and Forecast - By Country/Sub-region
- 11.1.1 United States
- 11.1.2 Canada
- 11.1.3 Mexico
- 12. Europe qPCR Reagent Industry Analysis, Insights and Forecast, 2019-2031
- 12.1. Market Analysis, Insights and Forecast - By Country/Sub-region
- 12.1.1 Germany
- 12.1.2 United Kingdom
- 12.1.3 France
- 12.1.4 Italy
- 12.1.5 Spain
- 12.1.6 Rest of Europe
- 13. Asia Pacific qPCR Reagent Industry Analysis, Insights and Forecast, 2019-2031
- 13.1. Market Analysis, Insights and Forecast - By Country/Sub-region
- 13.1.1 China
- 13.1.2 Japan
- 13.1.3 India
- 13.1.4 Australia
- 13.1.5 South Korea
- 13.1.6 Rest of Asia Pacific
- 14. Middle East and Africa qPCR Reagent Industry Analysis, Insights and Forecast, 2019-2031
- 14.1. Market Analysis, Insights and Forecast - By Country/Sub-region
- 14.1.1 GCC
- 14.1.2 South Africa
- 14.1.3 Rest of Middle East and Africa
- 15. South America qPCR Reagent Industry Analysis, Insights and Forecast, 2019-2031
- 15.1. Market Analysis, Insights and Forecast - By Country/Sub-region
- 15.1.1 Brazil
- 15.1.2 Argentina
- 15.1.3 Rest of South America
- 16. Competitive Analysis
- 16.1. Global Market Share Analysis 2024
- 16.2. Company Profiles
- 16.2.1 Promega Corporation
- 16.2.1.1. Overview
- 16.2.1.2. Products
- 16.2.1.3. SWOT Analysis
- 16.2.1.4. Recent Developments
- 16.2.1.5. Financials (Based on Availability)
- 16.2.2 Bio-Rad Laboratories Inc
- 16.2.2.1. Overview
- 16.2.2.2. Products
- 16.2.2.3. SWOT Analysis
- 16.2.2.4. Recent Developments
- 16.2.2.5. Financials (Based on Availability)
- 16.2.3 Takara Bio Inc
- 16.2.3.1. Overview
- 16.2.3.2. Products
- 16.2.3.3. SWOT Analysis
- 16.2.3.4. Recent Developments
- 16.2.3.5. Financials (Based on Availability)
- 16.2.4 Quanta Biosciences Inc
- 16.2.4.1. Overview
- 16.2.4.2. Products
- 16.2.4.3. SWOT Analysis
- 16.2.4.4. Recent Developments
- 16.2.4.5. Financials (Based on Availability)
- 16.2.5 Thermo Fisher Scientific
- 16.2.5.1. Overview
- 16.2.5.2. Products
- 16.2.5.3. SWOT Analysis
- 16.2.5.4. Recent Developments
- 16.2.5.5. Financials (Based on Availability)
- 16.2.6 Sigma-Aldrich Corporation (Merck KGaA)
- 16.2.6.1. Overview
- 16.2.6.2. Products
- 16.2.6.3. SWOT Analysis
- 16.2.6.4. Recent Developments
- 16.2.6.5. Financials (Based on Availability)
- 16.2.7 Agilent Technologies Inc
- 16.2.7.1. Overview
- 16.2.7.2. Products
- 16.2.7.3. SWOT Analysis
- 16.2.7.4. Recent Developments
- 16.2.7.5. Financials (Based on Availability)
- 16.2.8 F Hoffman-La Roche Ltd
- 16.2.8.1. Overview
- 16.2.8.2. Products
- 16.2.8.3. SWOT Analysis
- 16.2.8.4. Recent Developments
- 16.2.8.5. Financials (Based on Availability)
- 16.2.9 Kaneka Eurogentec S A
- 16.2.9.1. Overview
- 16.2.9.2. Products
- 16.2.9.3. SWOT Analysis
- 16.2.9.4. Recent Developments
- 16.2.9.5. Financials (Based on Availability)
- 16.2.1 Promega Corporation
List of Figures
- Figure 1: Global qPCR Reagent Industry Revenue Breakdown (Million, %) by Region 2024 & 2032
- Figure 2: North America qPCR Reagent Industry Revenue (Million), by Country 2024 & 2032
- Figure 3: North America qPCR Reagent Industry Revenue Share (%), by Country 2024 & 2032
- Figure 4: Europe qPCR Reagent Industry Revenue (Million), by Country 2024 & 2032
- Figure 5: Europe qPCR Reagent Industry Revenue Share (%), by Country 2024 & 2032
- Figure 6: Asia Pacific qPCR Reagent Industry Revenue (Million), by Country 2024 & 2032
- Figure 7: Asia Pacific qPCR Reagent Industry Revenue Share (%), by Country 2024 & 2032
- Figure 8: Middle East and Africa qPCR Reagent Industry Revenue (Million), by Country 2024 & 2032
- Figure 9: Middle East and Africa qPCR Reagent Industry Revenue Share (%), by Country 2024 & 2032
- Figure 10: South America qPCR Reagent Industry Revenue (Million), by Country 2024 & 2032
- Figure 11: South America qPCR Reagent Industry Revenue Share (%), by Country 2024 & 2032
- Figure 12: North America qPCR Reagent Industry Revenue (Million), by Detection Method 2024 & 2032
- Figure 13: North America qPCR Reagent Industry Revenue Share (%), by Detection Method 2024 & 2032
- Figure 14: North America qPCR Reagent Industry Revenue (Million), by Packaging Type 2024 & 2032
- Figure 15: North America qPCR Reagent Industry Revenue Share (%), by Packaging Type 2024 & 2032
- Figure 16: North America qPCR Reagent Industry Revenue (Million), by End-User 2024 & 2032
- Figure 17: North America qPCR Reagent Industry Revenue Share (%), by End-User 2024 & 2032
- Figure 18: North America qPCR Reagent Industry Revenue (Million), by Country 2024 & 2032
- Figure 19: North America qPCR Reagent Industry Revenue Share (%), by Country 2024 & 2032
- Figure 20: Europe qPCR Reagent Industry Revenue (Million), by Detection Method 2024 & 2032
- Figure 21: Europe qPCR Reagent Industry Revenue Share (%), by Detection Method 2024 & 2032
- Figure 22: Europe qPCR Reagent Industry Revenue (Million), by Packaging Type 2024 & 2032
- Figure 23: Europe qPCR Reagent Industry Revenue Share (%), by Packaging Type 2024 & 2032
- Figure 24: Europe qPCR Reagent Industry Revenue (Million), by End-User 2024 & 2032
- Figure 25: Europe qPCR Reagent Industry Revenue Share (%), by End-User 2024 & 2032
- Figure 26: Europe qPCR Reagent Industry Revenue (Million), by Country 2024 & 2032
- Figure 27: Europe qPCR Reagent Industry Revenue Share (%), by Country 2024 & 2032
- Figure 28: Asia Pacific qPCR Reagent Industry Revenue (Million), by Detection Method 2024 & 2032
- Figure 29: Asia Pacific qPCR Reagent Industry Revenue Share (%), by Detection Method 2024 & 2032
- Figure 30: Asia Pacific qPCR Reagent Industry Revenue (Million), by Packaging Type 2024 & 2032
- Figure 31: Asia Pacific qPCR Reagent Industry Revenue Share (%), by Packaging Type 2024 & 2032
- Figure 32: Asia Pacific qPCR Reagent Industry Revenue (Million), by End-User 2024 & 2032
- Figure 33: Asia Pacific qPCR Reagent Industry Revenue Share (%), by End-User 2024 & 2032
- Figure 34: Asia Pacific qPCR Reagent Industry Revenue (Million), by Country 2024 & 2032
- Figure 35: Asia Pacific qPCR Reagent Industry Revenue Share (%), by Country 2024 & 2032
- Figure 36: Middle East and Africa qPCR Reagent Industry Revenue (Million), by Detection Method 2024 & 2032
- Figure 37: Middle East and Africa qPCR Reagent Industry Revenue Share (%), by Detection Method 2024 & 2032
- Figure 38: Middle East and Africa qPCR Reagent Industry Revenue (Million), by Packaging Type 2024 & 2032
- Figure 39: Middle East and Africa qPCR Reagent Industry Revenue Share (%), by Packaging Type 2024 & 2032
- Figure 40: Middle East and Africa qPCR Reagent Industry Revenue (Million), by End-User 2024 & 2032
- Figure 41: Middle East and Africa qPCR Reagent Industry Revenue Share (%), by End-User 2024 & 2032
- Figure 42: Middle East and Africa qPCR Reagent Industry Revenue (Million), by Country 2024 & 2032
- Figure 43: Middle East and Africa qPCR Reagent Industry Revenue Share (%), by Country 2024 & 2032
- Figure 44: South America qPCR Reagent Industry Revenue (Million), by Detection Method 2024 & 2032
- Figure 45: South America qPCR Reagent Industry Revenue Share (%), by Detection Method 2024 & 2032
- Figure 46: South America qPCR Reagent Industry Revenue (Million), by Packaging Type 2024 & 2032
- Figure 47: South America qPCR Reagent Industry Revenue Share (%), by Packaging Type 2024 & 2032
- Figure 48: South America qPCR Reagent Industry Revenue (Million), by End-User 2024 & 2032
- Figure 49: South America qPCR Reagent Industry Revenue Share (%), by End-User 2024 & 2032
- Figure 50: South America qPCR Reagent Industry Revenue (Million), by Country 2024 & 2032
- Figure 51: South America qPCR Reagent Industry Revenue Share (%), by Country 2024 & 2032
List of Tables
- Table 1: Global qPCR Reagent Industry Revenue Million Forecast, by Region 2019 & 2032
- Table 2: Global qPCR Reagent Industry Revenue Million Forecast, by Detection Method 2019 & 2032
- Table 3: Global qPCR Reagent Industry Revenue Million Forecast, by Packaging Type 2019 & 2032
- Table 4: Global qPCR Reagent Industry Revenue Million Forecast, by End-User 2019 & 2032
- Table 5: Global qPCR Reagent Industry Revenue Million Forecast, by Region 2019 & 2032
- Table 6: Global qPCR Reagent Industry Revenue Million Forecast, by Country 2019 & 2032
- Table 7: United States qPCR Reagent Industry Revenue (Million) Forecast, by Application 2019 & 2032
- Table 8: Canada qPCR Reagent Industry Revenue (Million) Forecast, by Application 2019 & 2032
- Table 9: Mexico qPCR Reagent Industry Revenue (Million) Forecast, by Application 2019 & 2032
- Table 10: Global qPCR Reagent Industry Revenue Million Forecast, by Country 2019 & 2032
- Table 11: Germany qPCR Reagent Industry Revenue (Million) Forecast, by Application 2019 & 2032
- Table 12: United Kingdom qPCR Reagent Industry Revenue (Million) Forecast, by Application 2019 & 2032
- Table 13: France qPCR Reagent Industry Revenue (Million) Forecast, by Application 2019 & 2032
- Table 14: Italy qPCR Reagent Industry Revenue (Million) Forecast, by Application 2019 & 2032
- Table 15: Spain qPCR Reagent Industry Revenue (Million) Forecast, by Application 2019 & 2032
- Table 16: Rest of Europe qPCR Reagent Industry Revenue (Million) Forecast, by Application 2019 & 2032
- Table 17: Global qPCR Reagent Industry Revenue Million Forecast, by Country 2019 & 2032
- Table 18: China qPCR Reagent Industry Revenue (Million) Forecast, by Application 2019 & 2032
- Table 19: Japan qPCR Reagent Industry Revenue (Million) Forecast, by Application 2019 & 2032
- Table 20: India qPCR Reagent Industry Revenue (Million) Forecast, by Application 2019 & 2032
- Table 21: Australia qPCR Reagent Industry Revenue (Million) Forecast, by Application 2019 & 2032
- Table 22: South Korea qPCR Reagent Industry Revenue (Million) Forecast, by Application 2019 & 2032
- Table 23: Rest of Asia Pacific qPCR Reagent Industry Revenue (Million) Forecast, by Application 2019 & 2032
- Table 24: Global qPCR Reagent Industry Revenue Million Forecast, by Country 2019 & 2032
- Table 25: GCC qPCR Reagent Industry Revenue (Million) Forecast, by Application 2019 & 2032
- Table 26: South Africa qPCR Reagent Industry Revenue (Million) Forecast, by Application 2019 & 2032
- Table 27: Rest of Middle East and Africa qPCR Reagent Industry Revenue (Million) Forecast, by Application 2019 & 2032
- Table 28: Global qPCR Reagent Industry Revenue Million Forecast, by Country 2019 & 2032
- Table 29: Brazil qPCR Reagent Industry Revenue (Million) Forecast, by Application 2019 & 2032
- Table 30: Argentina qPCR Reagent Industry Revenue (Million) Forecast, by Application 2019 & 2032
- Table 31: Rest of South America qPCR Reagent Industry Revenue (Million) Forecast, by Application 2019 & 2032
- Table 32: Global qPCR Reagent Industry Revenue Million Forecast, by Detection Method 2019 & 2032
- Table 33: Global qPCR Reagent Industry Revenue Million Forecast, by Packaging Type 2019 & 2032
- Table 34: Global qPCR Reagent Industry Revenue Million Forecast, by End-User 2019 & 2032
- Table 35: Global qPCR Reagent Industry Revenue Million Forecast, by Country 2019 & 2032
- Table 36: United States qPCR Reagent Industry Revenue (Million) Forecast, by Application 2019 & 2032
- Table 37: Canada qPCR Reagent Industry Revenue (Million) Forecast, by Application 2019 & 2032
- Table 38: Mexico qPCR Reagent Industry Revenue (Million) Forecast, by Application 2019 & 2032
- Table 39: Global qPCR Reagent Industry Revenue Million Forecast, by Detection Method 2019 & 2032
- Table 40: Global qPCR Reagent Industry Revenue Million Forecast, by Packaging Type 2019 & 2032
- Table 41: Global qPCR Reagent Industry Revenue Million Forecast, by End-User 2019 & 2032
- Table 42: Global qPCR Reagent Industry Revenue Million Forecast, by Country 2019 & 2032
- Table 43: Germany qPCR Reagent Industry Revenue (Million) Forecast, by Application 2019 & 2032
- Table 44: United Kingdom qPCR Reagent Industry Revenue (Million) Forecast, by Application 2019 & 2032
- Table 45: France qPCR Reagent Industry Revenue (Million) Forecast, by Application 2019 & 2032
- Table 46: Italy qPCR Reagent Industry Revenue (Million) Forecast, by Application 2019 & 2032
- Table 47: Spain qPCR Reagent Industry Revenue (Million) Forecast, by Application 2019 & 2032
- Table 48: Rest of Europe qPCR Reagent Industry Revenue (Million) Forecast, by Application 2019 & 2032
- Table 49: Global qPCR Reagent Industry Revenue Million Forecast, by Detection Method 2019 & 2032
- Table 50: Global qPCR Reagent Industry Revenue Million Forecast, by Packaging Type 2019 & 2032
- Table 51: Global qPCR Reagent Industry Revenue Million Forecast, by End-User 2019 & 2032
- Table 52: Global qPCR Reagent Industry Revenue Million Forecast, by Country 2019 & 2032
- Table 53: China qPCR Reagent Industry Revenue (Million) Forecast, by Application 2019 & 2032
- Table 54: Japan qPCR Reagent Industry Revenue (Million) Forecast, by Application 2019 & 2032
- Table 55: India qPCR Reagent Industry Revenue (Million) Forecast, by Application 2019 & 2032
- Table 56: Australia qPCR Reagent Industry Revenue (Million) Forecast, by Application 2019 & 2032
- Table 57: South Korea qPCR Reagent Industry Revenue (Million) Forecast, by Application 2019 & 2032
- Table 58: Rest of Asia Pacific qPCR Reagent Industry Revenue (Million) Forecast, by Application 2019 & 2032
- Table 59: Global qPCR Reagent Industry Revenue Million Forecast, by Detection Method 2019 & 2032
- Table 60: Global qPCR Reagent Industry Revenue Million Forecast, by Packaging Type 2019 & 2032
- Table 61: Global qPCR Reagent Industry Revenue Million Forecast, by End-User 2019 & 2032
- Table 62: Global qPCR Reagent Industry Revenue Million Forecast, by Country 2019 & 2032
- Table 63: GCC qPCR Reagent Industry Revenue (Million) Forecast, by Application 2019 & 2032
- Table 64: South Africa qPCR Reagent Industry Revenue (Million) Forecast, by Application 2019 & 2032
- Table 65: Rest of Middle East and Africa qPCR Reagent Industry Revenue (Million) Forecast, by Application 2019 & 2032
- Table 66: Global qPCR Reagent Industry Revenue Million Forecast, by Detection Method 2019 & 2032
- Table 67: Global qPCR Reagent Industry Revenue Million Forecast, by Packaging Type 2019 & 2032
- Table 68: Global qPCR Reagent Industry Revenue Million Forecast, by End-User 2019 & 2032
- Table 69: Global qPCR Reagent Industry Revenue Million Forecast, by Country 2019 & 2032
- Table 70: Brazil qPCR Reagent Industry Revenue (Million) Forecast, by Application 2019 & 2032
- Table 71: Argentina qPCR Reagent Industry Revenue (Million) Forecast, by Application 2019 & 2032
- Table 72: Rest of South America qPCR Reagent Industry Revenue (Million) Forecast, by Application 2019 & 2032
Frequently Asked Questions
1. What is the projected Compound Annual Growth Rate (CAGR) of the qPCR Reagent Industry?
The projected CAGR is approximately 7.90%.
2. Which companies are prominent players in the qPCR Reagent Industry?
Key companies in the market include Promega Corporation, Bio-Rad Laboratories Inc, Takara Bio Inc, Quanta Biosciences Inc, Thermo Fisher Scientific, Sigma-Aldrich Corporation (Merck KGaA), Agilent Technologies Inc, F Hoffman-La Roche Ltd, Kaneka Eurogentec S A.
3. What are the main segments of the qPCR Reagent Industry?
The market segments include Detection Method, Packaging Type, End-User.
4. Can you provide details about the market size?
The market size is estimated to be USD XX Million as of 2022.
5. What are some drivers contributing to market growth?
Rising Incidence of Infectious Diseases and Genetic Disorders; Growing Geriatric Population; Increasing Focus on Human Genome Projects.
6. What are the notable trends driving market growth?
Dye-Based qPCR Reagents are Expected to Dominate the Market.
7. Are there any restraints impacting market growth?
High Cost of Reagents and qPCR Equipment; Lack of Technical Expertise to Operate the qPCR instrument.
8. Can you provide examples of recent developments in the market?
November 2022: PCR Biosystems launched a new family of qPCR reagent mixes: Clara Probe Mix, Clara Probe 1-Step Mix, and Clara HRM Mix. The cutting-edge Clara family of mixes relies on a novel composition to push the boundaries of performance to meet the challenges of laboratories.
9. What pricing options are available for accessing the report?
Pricing options include single-user, multi-user, and enterprise licenses priced at USD 4750, USD 5250, and USD 8750 respectively.
10. Is the market size provided in terms of value or volume?
The market size is provided in terms of value, measured in Million.
11. Are there any specific market keywords associated with the report?
Yes, the market keyword associated with the report is "qPCR Reagent Industry," which aids in identifying and referencing the specific market segment covered.
12. How do I determine which pricing option suits my needs best?
The pricing options vary based on user requirements and access needs. Individual users may opt for single-user licenses, while businesses requiring broader access may choose multi-user or enterprise licenses for cost-effective access to the report.
13. Are there any additional resources or data provided in the qPCR Reagent Industry report?
While the report offers comprehensive insights, it's advisable to review the specific contents or supplementary materials provided to ascertain if additional resources or data are available.
14. How can I stay updated on further developments or reports in the qPCR Reagent Industry?
To stay informed about further developments, trends, and reports in the qPCR Reagent Industry, consider subscribing to industry newsletters, following relevant companies and organizations, or regularly checking reputable industry news sources and publications.
Methodology
Step 1 - Identification of Relevant Samples Size from Population Database


Step 2 - Approaches for Defining Global Market Size (Value, Volume* & Price*)

Note*: In applicable scenarios
Step 3 - Data Sources
Primary Research
- Web Analytics
- Survey Reports
- Research Institute
- Latest Research Reports
- Opinion Leaders
Secondary Research
- Annual Reports
- White Paper
- Latest Press Release
- Industry Association
- Paid Database
- Investor Presentations

Step 4 - Data Triangulation
Involves using different sources of information in order to increase the validity of a study
These sources are likely to be stakeholders in a program - participants, other researchers, program staff, other community members, and so on.
Then we put all data in single framework & apply various statistical tools to find out the dynamic on the market.
During the analysis stage, feedback from the stakeholder groups would be compared to determine areas of agreement as well as areas of divergence
