

Key Insights
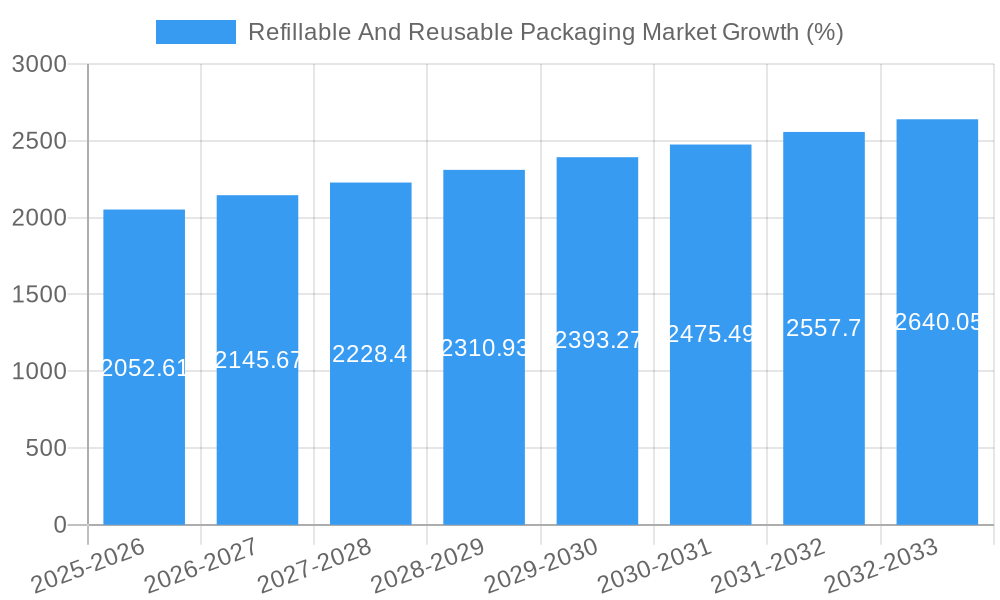
The refillable and reusable packaging market, currently valued at $45.67 billion in 2025, is experiencing robust growth, projected to expand at a compound annual growth rate (CAGR) of 4.43% from 2025 to 2033. This expansion is driven by a confluence of factors, including the escalating consumer demand for sustainable and environmentally friendly packaging solutions, stringent government regulations aimed at reducing plastic waste, and a growing awareness of the environmental impact of single-use packaging. The food and beverage sector, a significant end-user industry, is spearheading this adoption, followed by the cosmetics and personal care sectors. Growth is further fueled by innovations in material science, leading to the development of durable and easily recyclable alternatives like biodegradable plastics and enhanced paper-based packaging. The dominance of plastic in the current market is expected to gradually decrease as more companies explore and implement eco-conscious alternatives. Regional analysis shows significant growth potential in Asia-Pacific, driven by increasing urbanization and rising disposable incomes, while North America and Europe maintain strong positions due to advanced sustainability initiatives and robust regulatory frameworks.
The market segmentation reveals a diversified landscape, with bottles and containers representing a major product category. However, the market is dynamic, witnessing a surge in demand for innovative packaging types such as IBCs (Intermediate Bulk Containers) and specialized reusable packaging for e-commerce and supply chain optimization. Major players like Nefab Group, Smurfit Kappa Group, and Amcor PLC are actively shaping market trends through strategic acquisitions, technological advancements, and the introduction of new, sustainable packaging solutions. While challenges remain in terms of cost-effectiveness and infrastructure limitations in certain regions, the overall market outlook for refillable and reusable packaging remains positive, driven by strong environmental and economic incentives. The continued focus on circular economy principles will further accelerate market expansion in the coming years.

Refillable and Reusable Packaging Market: A Comprehensive Report (2019-2033)
This comprehensive report provides an in-depth analysis of the refillable and reusable packaging market, covering market dynamics, key segments, leading players, and future growth prospects. The study period spans from 2019 to 2033, with 2025 serving as the base and estimated year. The report is essential for industry stakeholders, investors, and businesses seeking to understand and capitalize on the burgeoning opportunities within this sustainable packaging sector. The global market size is projected to reach xx Million by 2033, exhibiting a CAGR of xx% during the forecast period (2025-2033).
Refillable And Reusable Packaging Market Market Concentration & Dynamics
The refillable and reusable packaging market exhibits a moderately concentrated landscape, with several multinational corporations holding significant market share. Key players like Nefab Group, Smurfit Kappa Group, Schoeller Allibert Services BV, and Amcor PLC compete intensely, driving innovation and consolidation. Market share analysis reveals that the top 5 players collectively hold approximately xx% of the global market in 2025. The market is characterized by a dynamic innovation ecosystem, with continuous advancements in materials science and packaging design. Stringent environmental regulations across various regions are pushing adoption of sustainable packaging solutions, fostering market growth. Substitute products, like single-use plastics, face increasing scrutiny, boosting the demand for eco-friendly alternatives. Consumer preferences are shifting towards sustainable and ethical brands, further fueling the market's expansion.
- Market Concentration: Top 5 players hold approximately xx% of the market share (2025).
- Innovation Ecosystem: Focus on lightweight materials, improved durability, and efficient logistics solutions.
- Regulatory Frameworks: Stringent environmental regulations driving adoption of reusable packaging.
- Substitute Products: Single-use plastics are facing increasing pressure from regulatory and consumer perspectives.
- End-User Trends: Growing demand for sustainable and ethical products from environmentally conscious consumers.
- M&A Activities: A significant number of mergers and acquisitions (xx deals in the last 5 years) have shaped the market landscape, indicating consolidation and expansion strategies.
Refillable And Reusable Packaging Market Industry Insights & Trends
The refillable and reusable packaging market is experiencing robust growth driven by increasing consumer awareness of environmental sustainability, coupled with stringent government regulations aimed at reducing plastic waste. The market size was valued at xx Million in 2024 and is projected to reach xx Million by 2033, representing significant growth. This expansion is primarily fueled by the growing adoption of reusable packaging across various end-user industries like food and beverage, cosmetics, and e-commerce. Technological disruptions, particularly in material science and automation, are further enhancing efficiency and reducing costs. The rise of e-commerce and the need for efficient and sustainable delivery systems are also significant drivers. Changing consumer behavior, with a preference for eco-friendly and ethically sourced products, contributes substantially to market growth. Several technological advancements such as improved designs for reusable packaging and the introduction of smart packaging solutions further enhance the appeal of reusable options.
Key Markets & Segments Leading Refillable And Reusable Packaging Market
The food and beverage industry is currently the leading end-user segment for refillable and reusable packaging, driven by increasing demand for sustainable packaging solutions in this sector. Europe and North America are the dominant regions, exhibiting high levels of environmental consciousness and regulatory stringency.
By End-user Industry:
- Food and Beverage: Highest market share due to increasing demand for sustainable solutions and strict regulations.
- Cosmetics and Personal Care: Growing demand for refillable packaging options to reduce plastic waste.
- Household Care: Significant growth potential due to increasing consumer awareness and eco-friendly options.
- Chemicals and Petrochemicals: Adoption of reusable packaging for efficient handling and reduced environmental impact.
By Material:
- Plastic: Dominant material due to cost-effectiveness and versatility, though facing scrutiny due to environmental concerns.
- Paper and Paperboard: Significant growth due to its renewable and biodegradable nature, but with limitations in durability and water resistance.
- Metal: Used for durable and long-lasting applications, but can be heavy and costly.
- Glass: Suitable for food and beverage applications, offering high-quality protection, but heavy and prone to breakage.
By Product:
- Bottles and Containers: Largest segment due to widespread use across various end-user industries.
- Pallets and Crates: Significant demand in the logistics and supply chain sectors.
- IBCs: Increasing adoption in the chemical and petrochemical industries.
Growth Drivers:
- Stringent environmental regulations across various countries.
- Growing consumer awareness of environmental issues.
- Demand for sustainable and eco-friendly packaging solutions.
- Technological advancements in material science and packaging design.
- Rise of e-commerce and demand for efficient and sustainable delivery systems.
Refillable And Reusable Packaging Market Product Developments
Recent innovations include the development of lightweight yet durable materials, improved designs for reusability and recyclability, and smart packaging solutions that enhance traceability and efficiency. Berry Global Inc.'s launch of a 14-liter HDPE reusable container for refill packaging highlights the ongoing efforts to create practical and scalable solutions for various sectors. These advancements are enhancing the competitiveness of reusable packaging by addressing key challenges such as durability, cost, and logistics.
Challenges in the Refillable And Reusable Packaging Market Market
The market faces challenges including the higher initial cost of reusable packaging compared to single-use options, potential supply chain complexities associated with collection and cleaning systems, and the need for standardization across different industries to ensure interoperability. These factors contribute to slower adoption rates in some sectors, although the market continues to grow steadily. The lack of established infrastructure for collection and cleaning systems also presents a hurdle for wider acceptance.
Forces Driving Refillable And Reusable Packaging Market Growth
Technological advancements in material science and manufacturing are enabling the production of more sustainable and cost-effective reusable packaging. Favorable government policies promoting circular economy principles are further driving market growth. Economic incentives and consumer preference for eco-friendly options are also significant factors. The increased focus on reducing carbon footprint and plastic waste is accelerating adoption.
Challenges in the Refillable And Reusable Packaging Market Market
Long-term growth catalysts include ongoing innovation in materials and designs, strategic partnerships between packaging manufacturers and retailers, and expansion into new geographical markets with emerging demand. The establishment of robust collection and cleaning infrastructure will be crucial for sustainable growth.
Emerging Opportunities in Refillable And Reusable Packaging Market
Emerging opportunities include the growth of refill services in various industries, integrating digital technologies for tracking and managing reusable packaging, and expanding into niche markets with specific needs for sustainable packaging. The development of innovative business models focusing on product-service systems is also expected to drive market growth.
Leading Players in the Refillable And Reusable Packaging Market Sector
- Nefab Group
- Smurfit Kappa Group
- Schoeller Allibert Services BV
- Greif Inc
- Amcor PLC
- Mondi PLC
- IPL Inc
- IFCO Systems
- Petainer Ltd
- Bormioli Luigi Corporation
- Vetropack Holding Ltd
- Jiangmen UA Packaging Co Lt
- GWP Group
- Refillism
- Berry Global Inc
- Orbis Corporation
- International Paper
Key Milestones in Refillable And Reusable Packaging Market Industry
- June 2023: Nefab Group AB acquired PolyFlex Products Inc., strengthening its position in reusable packaging and material handling solutions.
- October 2023: Berry Global Inc. launched a 14-liter HDPE reusable container as part of a refill packaging solution piloted at Aldi UK.
Strategic Outlook for Refillable And Reusable Packaging Market Market
The refillable and reusable packaging market holds immense potential for future growth, driven by ongoing innovation, supportive regulations, and growing consumer demand for sustainable products. Strategic partnerships and investments in infrastructure will be crucial for realizing this potential. Companies focusing on developing innovative and cost-effective solutions will be well-positioned to capture significant market share in the coming years.
Refillable And Reusable Packaging Market Segmentation
-
1. Material
- 1.1. Plastic
- 1.2. Paper and Paperboard
- 1.3. Metal
- 1.4. Glass
-
2. Product
- 2.1. Bottles and Containers
- 2.2. Pallets and Crates
- 2.3. IBCs
- 2.4. Drums and Barrels
- 2.5. Boxes and Cartons
- 2.6. Cans and Pails
- 2.7. Others P
-
3. End-user Industry
- 3.1. Food and Beverage
- 3.2. Cosmetics and Personal Care
- 3.3. Household Care
- 3.4. Chemicals and Petrochemicals
- 3.5. Building and Construction
- 3.6. Shipping and Transportation
- 3.7. Other En
Refillable And Reusable Packaging Market Segmentation By Geography
- 1. North America
- 2. Europe
- 3. Asia Pacific
- 4. Latin America
- 5. Middle East and Africa

Refillable And Reusable Packaging Market REPORT HIGHLIGHTS
| Aspects | Details |
|---|---|
| Study Period | 2019-2033 |
| Base Year | 2024 |
| Estimated Year | 2025 |
| Forecast Period | 2025-2033 |
| Historical Period | 2019-2024 |
| Growth Rate | CAGR of 4.43% from 2019-2033 |
| Segmentation |
|
Table of Contents
- 1. Introduction
- 1.1. Research Scope
- 1.2. Market Segmentation
- 1.3. Research Methodology
- 1.4. Definitions and Assumptions
- 2. Executive Summary
- 2.1. Introduction
- 3. Market Dynamics
- 3.1. Introduction
- 3.2. Market Drivers
- 3.2.1. Rising Demand for Sustainable and Recyclable Refillable Packaging; Increasing Need for Smart and Trackable Reusable Packaging Solutions
- 3.3. Market Restrains
- 3.3.1. Supply Chain Disruptions and Regulatory Changes Might Limit the Market Growth
- 3.4. Market Trends
- 3.4.1. Pallets and Crates are Expected to Witness Growth
- 4. Market Factor Analysis
- 4.1. Porters Five Forces
- 4.2. Supply/Value Chain
- 4.3. PESTEL analysis
- 4.4. Market Entropy
- 4.5. Patent/Trademark Analysis
- 5. Global Refillable And Reusable Packaging Market Analysis, Insights and Forecast, 2019-2031
- 5.1. Market Analysis, Insights and Forecast - by Material
- 5.1.1. Plastic
- 5.1.2. Paper and Paperboard
- 5.1.3. Metal
- 5.1.4. Glass
- 5.2. Market Analysis, Insights and Forecast - by Product
- 5.2.1. Bottles and Containers
- 5.2.2. Pallets and Crates
- 5.2.3. IBCs
- 5.2.4. Drums and Barrels
- 5.2.5. Boxes and Cartons
- 5.2.6. Cans and Pails
- 5.2.7. Others P
- 5.3. Market Analysis, Insights and Forecast - by End-user Industry
- 5.3.1. Food and Beverage
- 5.3.2. Cosmetics and Personal Care
- 5.3.3. Household Care
- 5.3.4. Chemicals and Petrochemicals
- 5.3.5. Building and Construction
- 5.3.6. Shipping and Transportation
- 5.3.7. Other En
- 5.4. Market Analysis, Insights and Forecast - by Region
- 5.4.1. North America
- 5.4.2. Europe
- 5.4.3. Asia Pacific
- 5.4.4. Latin America
- 5.4.5. Middle East and Africa
- 5.1. Market Analysis, Insights and Forecast - by Material
- 6. North America Refillable And Reusable Packaging Market Analysis, Insights and Forecast, 2019-2031
- 6.1. Market Analysis, Insights and Forecast - by Material
- 6.1.1. Plastic
- 6.1.2. Paper and Paperboard
- 6.1.3. Metal
- 6.1.4. Glass
- 6.2. Market Analysis, Insights and Forecast - by Product
- 6.2.1. Bottles and Containers
- 6.2.2. Pallets and Crates
- 6.2.3. IBCs
- 6.2.4. Drums and Barrels
- 6.2.5. Boxes and Cartons
- 6.2.6. Cans and Pails
- 6.2.7. Others P
- 6.3. Market Analysis, Insights and Forecast - by End-user Industry
- 6.3.1. Food and Beverage
- 6.3.2. Cosmetics and Personal Care
- 6.3.3. Household Care
- 6.3.4. Chemicals and Petrochemicals
- 6.3.5. Building and Construction
- 6.3.6. Shipping and Transportation
- 6.3.7. Other En
- 6.1. Market Analysis, Insights and Forecast - by Material
- 7. Europe Refillable And Reusable Packaging Market Analysis, Insights and Forecast, 2019-2031
- 7.1. Market Analysis, Insights and Forecast - by Material
- 7.1.1. Plastic
- 7.1.2. Paper and Paperboard
- 7.1.3. Metal
- 7.1.4. Glass
- 7.2. Market Analysis, Insights and Forecast - by Product
- 7.2.1. Bottles and Containers
- 7.2.2. Pallets and Crates
- 7.2.3. IBCs
- 7.2.4. Drums and Barrels
- 7.2.5. Boxes and Cartons
- 7.2.6. Cans and Pails
- 7.2.7. Others P
- 7.3. Market Analysis, Insights and Forecast - by End-user Industry
- 7.3.1. Food and Beverage
- 7.3.2. Cosmetics and Personal Care
- 7.3.3. Household Care
- 7.3.4. Chemicals and Petrochemicals
- 7.3.5. Building and Construction
- 7.3.6. Shipping and Transportation
- 7.3.7. Other En
- 7.1. Market Analysis, Insights and Forecast - by Material
- 8. Asia Pacific Refillable And Reusable Packaging Market Analysis, Insights and Forecast, 2019-2031
- 8.1. Market Analysis, Insights and Forecast - by Material
- 8.1.1. Plastic
- 8.1.2. Paper and Paperboard
- 8.1.3. Metal
- 8.1.4. Glass
- 8.2. Market Analysis, Insights and Forecast - by Product
- 8.2.1. Bottles and Containers
- 8.2.2. Pallets and Crates
- 8.2.3. IBCs
- 8.2.4. Drums and Barrels
- 8.2.5. Boxes and Cartons
- 8.2.6. Cans and Pails
- 8.2.7. Others P
- 8.3. Market Analysis, Insights and Forecast - by End-user Industry
- 8.3.1. Food and Beverage
- 8.3.2. Cosmetics and Personal Care
- 8.3.3. Household Care
- 8.3.4. Chemicals and Petrochemicals
- 8.3.5. Building and Construction
- 8.3.6. Shipping and Transportation
- 8.3.7. Other En
- 8.1. Market Analysis, Insights and Forecast - by Material
- 9. Latin America Refillable And Reusable Packaging Market Analysis, Insights and Forecast, 2019-2031
- 9.1. Market Analysis, Insights and Forecast - by Material
- 9.1.1. Plastic
- 9.1.2. Paper and Paperboard
- 9.1.3. Metal
- 9.1.4. Glass
- 9.2. Market Analysis, Insights and Forecast - by Product
- 9.2.1. Bottles and Containers
- 9.2.2. Pallets and Crates
- 9.2.3. IBCs
- 9.2.4. Drums and Barrels
- 9.2.5. Boxes and Cartons
- 9.2.6. Cans and Pails
- 9.2.7. Others P
- 9.3. Market Analysis, Insights and Forecast - by End-user Industry
- 9.3.1. Food and Beverage
- 9.3.2. Cosmetics and Personal Care
- 9.3.3. Household Care
- 9.3.4. Chemicals and Petrochemicals
- 9.3.5. Building and Construction
- 9.3.6. Shipping and Transportation
- 9.3.7. Other En
- 9.1. Market Analysis, Insights and Forecast - by Material
- 10. Middle East and Africa Refillable And Reusable Packaging Market Analysis, Insights and Forecast, 2019-2031
- 10.1. Market Analysis, Insights and Forecast - by Material
- 10.1.1. Plastic
- 10.1.2. Paper and Paperboard
- 10.1.3. Metal
- 10.1.4. Glass
- 10.2. Market Analysis, Insights and Forecast - by Product
- 10.2.1. Bottles and Containers
- 10.2.2. Pallets and Crates
- 10.2.3. IBCs
- 10.2.4. Drums and Barrels
- 10.2.5. Boxes and Cartons
- 10.2.6. Cans and Pails
- 10.2.7. Others P
- 10.3. Market Analysis, Insights and Forecast - by End-user Industry
- 10.3.1. Food and Beverage
- 10.3.2. Cosmetics and Personal Care
- 10.3.3. Household Care
- 10.3.4. Chemicals and Petrochemicals
- 10.3.5. Building and Construction
- 10.3.6. Shipping and Transportation
- 10.3.7. Other En
- 10.1. Market Analysis, Insights and Forecast - by Material
- 11. North America Refillable And Reusable Packaging Market Analysis, Insights and Forecast, 2019-2031
- 11.1. Market Analysis, Insights and Forecast - By Country/Sub-region
- 11.1.1 United States
- 11.1.2 Canada
- 11.1.3 Mexico
- 12. Europe Refillable And Reusable Packaging Market Analysis, Insights and Forecast, 2019-2031
- 12.1. Market Analysis, Insights and Forecast - By Country/Sub-region
- 12.1.1 Germany
- 12.1.2 United Kingdom
- 12.1.3 France
- 12.1.4 Spain
- 12.1.5 Italy
- 12.1.6 Spain
- 12.1.7 Belgium
- 12.1.8 Netherland
- 12.1.9 Nordics
- 12.1.10 Rest of Europe
- 13. Asia Pacific Refillable And Reusable Packaging Market Analysis, Insights and Forecast, 2019-2031
- 13.1. Market Analysis, Insights and Forecast - By Country/Sub-region
- 13.1.1 China
- 13.1.2 Japan
- 13.1.3 India
- 13.1.4 South Korea
- 13.1.5 Southeast Asia
- 13.1.6 Australia
- 13.1.7 Indonesia
- 13.1.8 Phillipes
- 13.1.9 Singapore
- 13.1.10 Thailandc
- 13.1.11 Rest of Asia Pacific
- 14. South America Refillable And Reusable Packaging Market Analysis, Insights and Forecast, 2019-2031
- 14.1. Market Analysis, Insights and Forecast - By Country/Sub-region
- 14.1.1 Brazil
- 14.1.2 Argentina
- 14.1.3 Peru
- 14.1.4 Chile
- 14.1.5 Colombia
- 14.1.6 Ecuador
- 14.1.7 Venezuela
- 14.1.8 Rest of South America
- 15. North America Refillable And Reusable Packaging Market Analysis, Insights and Forecast, 2019-2031
- 15.1. Market Analysis, Insights and Forecast - By Country/Sub-region
- 15.1.1 United States
- 15.1.2 Canada
- 15.1.3 Mexico
- 16. MEA Refillable And Reusable Packaging Market Analysis, Insights and Forecast, 2019-2031
- 16.1. Market Analysis, Insights and Forecast - By Country/Sub-region
- 16.1.1 United Arab Emirates
- 16.1.2 Saudi Arabia
- 16.1.3 South Africa
- 16.1.4 Rest of Middle East and Africa
- 17. Competitive Analysis
- 17.1. Global Market Share Analysis 2024
- 17.2. Company Profiles
- 17.2.1 Nefab Group
- 17.2.1.1. Overview
- 17.2.1.2. Products
- 17.2.1.3. SWOT Analysis
- 17.2.1.4. Recent Developments
- 17.2.1.5. Financials (Based on Availability)
- 17.2.2 Smurfit Kappa Group
- 17.2.2.1. Overview
- 17.2.2.2. Products
- 17.2.2.3. SWOT Analysis
- 17.2.2.4. Recent Developments
- 17.2.2.5. Financials (Based on Availability)
- 17.2.3 Schoeller Allibert Services BV
- 17.2.3.1. Overview
- 17.2.3.2. Products
- 17.2.3.3. SWOT Analysis
- 17.2.3.4. Recent Developments
- 17.2.3.5. Financials (Based on Availability)
- 17.2.4 Greif Inc
- 17.2.4.1. Overview
- 17.2.4.2. Products
- 17.2.4.3. SWOT Analysis
- 17.2.4.4. Recent Developments
- 17.2.4.5. Financials (Based on Availability)
- 17.2.5 Amcor PLC
- 17.2.5.1. Overview
- 17.2.5.2. Products
- 17.2.5.3. SWOT Analysis
- 17.2.5.4. Recent Developments
- 17.2.5.5. Financials (Based on Availability)
- 17.2.6 Mondi PLC
- 17.2.6.1. Overview
- 17.2.6.2. Products
- 17.2.6.3. SWOT Analysis
- 17.2.6.4. Recent Developments
- 17.2.6.5. Financials (Based on Availability)
- 17.2.7 IPL Inc
- 17.2.7.1. Overview
- 17.2.7.2. Products
- 17.2.7.3. SWOT Analysis
- 17.2.7.4. Recent Developments
- 17.2.7.5. Financials (Based on Availability)
- 17.2.8 IFCO Systems
- 17.2.8.1. Overview
- 17.2.8.2. Products
- 17.2.8.3. SWOT Analysis
- 17.2.8.4. Recent Developments
- 17.2.8.5. Financials (Based on Availability)
- 17.2.9 Petainer Ltd
- 17.2.9.1. Overview
- 17.2.9.2. Products
- 17.2.9.3. SWOT Analysis
- 17.2.9.4. Recent Developments
- 17.2.9.5. Financials (Based on Availability)
- 17.2.10 Bormioli Luigi Corporation
- 17.2.10.1. Overview
- 17.2.10.2. Products
- 17.2.10.3. SWOT Analysis
- 17.2.10.4. Recent Developments
- 17.2.10.5. Financials (Based on Availability)
- 17.2.11 Vetropack Holding Ltd
- 17.2.11.1. Overview
- 17.2.11.2. Products
- 17.2.11.3. SWOT Analysis
- 17.2.11.4. Recent Developments
- 17.2.11.5. Financials (Based on Availability)
- 17.2.12 Jiangmen UA Packaging Co Lt
- 17.2.12.1. Overview
- 17.2.12.2. Products
- 17.2.12.3. SWOT Analysis
- 17.2.12.4. Recent Developments
- 17.2.12.5. Financials (Based on Availability)
- 17.2.13 GWP Group
- 17.2.13.1. Overview
- 17.2.13.2. Products
- 17.2.13.3. SWOT Analysis
- 17.2.13.4. Recent Developments
- 17.2.13.5. Financials (Based on Availability)
- 17.2.14 Refillism
- 17.2.14.1. Overview
- 17.2.14.2. Products
- 17.2.14.3. SWOT Analysis
- 17.2.14.4. Recent Developments
- 17.2.14.5. Financials (Based on Availability)
- 17.2.15 Berry Global Inc
- 17.2.15.1. Overview
- 17.2.15.2. Products
- 17.2.15.3. SWOT Analysis
- 17.2.15.4. Recent Developments
- 17.2.15.5. Financials (Based on Availability)
- 17.2.16 Orbis Corporation
- 17.2.16.1. Overview
- 17.2.16.2. Products
- 17.2.16.3. SWOT Analysis
- 17.2.16.4. Recent Developments
- 17.2.16.5. Financials (Based on Availability)
- 17.2.17 International Paper
- 17.2.17.1. Overview
- 17.2.17.2. Products
- 17.2.17.3. SWOT Analysis
- 17.2.17.4. Recent Developments
- 17.2.17.5. Financials (Based on Availability)
- 17.2.1 Nefab Group
List of Figures
- Figure 1: Global Refillable And Reusable Packaging Market Revenue Breakdown (Million, %) by Region 2024 & 2032
- Figure 2: North America Refillable And Reusable Packaging Market Revenue (Million), by Country 2024 & 2032
- Figure 3: North America Refillable And Reusable Packaging Market Revenue Share (%), by Country 2024 & 2032
- Figure 4: Europe Refillable And Reusable Packaging Market Revenue (Million), by Country 2024 & 2032
- Figure 5: Europe Refillable And Reusable Packaging Market Revenue Share (%), by Country 2024 & 2032
- Figure 6: Asia Pacific Refillable And Reusable Packaging Market Revenue (Million), by Country 2024 & 2032
- Figure 7: Asia Pacific Refillable And Reusable Packaging Market Revenue Share (%), by Country 2024 & 2032
- Figure 8: South America Refillable And Reusable Packaging Market Revenue (Million), by Country 2024 & 2032
- Figure 9: South America Refillable And Reusable Packaging Market Revenue Share (%), by Country 2024 & 2032
- Figure 10: North America Refillable And Reusable Packaging Market Revenue (Million), by Country 2024 & 2032
- Figure 11: North America Refillable And Reusable Packaging Market Revenue Share (%), by Country 2024 & 2032
- Figure 12: MEA Refillable And Reusable Packaging Market Revenue (Million), by Country 2024 & 2032
- Figure 13: MEA Refillable And Reusable Packaging Market Revenue Share (%), by Country 2024 & 2032
- Figure 14: North America Refillable And Reusable Packaging Market Revenue (Million), by Material 2024 & 2032
- Figure 15: North America Refillable And Reusable Packaging Market Revenue Share (%), by Material 2024 & 2032
- Figure 16: North America Refillable And Reusable Packaging Market Revenue (Million), by Product 2024 & 2032
- Figure 17: North America Refillable And Reusable Packaging Market Revenue Share (%), by Product 2024 & 2032
- Figure 18: North America Refillable And Reusable Packaging Market Revenue (Million), by End-user Industry 2024 & 2032
- Figure 19: North America Refillable And Reusable Packaging Market Revenue Share (%), by End-user Industry 2024 & 2032
- Figure 20: North America Refillable And Reusable Packaging Market Revenue (Million), by Country 2024 & 2032
- Figure 21: North America Refillable And Reusable Packaging Market Revenue Share (%), by Country 2024 & 2032
- Figure 22: Europe Refillable And Reusable Packaging Market Revenue (Million), by Material 2024 & 2032
- Figure 23: Europe Refillable And Reusable Packaging Market Revenue Share (%), by Material 2024 & 2032
- Figure 24: Europe Refillable And Reusable Packaging Market Revenue (Million), by Product 2024 & 2032
- Figure 25: Europe Refillable And Reusable Packaging Market Revenue Share (%), by Product 2024 & 2032
- Figure 26: Europe Refillable And Reusable Packaging Market Revenue (Million), by End-user Industry 2024 & 2032
- Figure 27: Europe Refillable And Reusable Packaging Market Revenue Share (%), by End-user Industry 2024 & 2032
- Figure 28: Europe Refillable And Reusable Packaging Market Revenue (Million), by Country 2024 & 2032
- Figure 29: Europe Refillable And Reusable Packaging Market Revenue Share (%), by Country 2024 & 2032
- Figure 30: Asia Pacific Refillable And Reusable Packaging Market Revenue (Million), by Material 2024 & 2032
- Figure 31: Asia Pacific Refillable And Reusable Packaging Market Revenue Share (%), by Material 2024 & 2032
- Figure 32: Asia Pacific Refillable And Reusable Packaging Market Revenue (Million), by Product 2024 & 2032
- Figure 33: Asia Pacific Refillable And Reusable Packaging Market Revenue Share (%), by Product 2024 & 2032
- Figure 34: Asia Pacific Refillable And Reusable Packaging Market Revenue (Million), by End-user Industry 2024 & 2032
- Figure 35: Asia Pacific Refillable And Reusable Packaging Market Revenue Share (%), by End-user Industry 2024 & 2032
- Figure 36: Asia Pacific Refillable And Reusable Packaging Market Revenue (Million), by Country 2024 & 2032
- Figure 37: Asia Pacific Refillable And Reusable Packaging Market Revenue Share (%), by Country 2024 & 2032
- Figure 38: Latin America Refillable And Reusable Packaging Market Revenue (Million), by Material 2024 & 2032
- Figure 39: Latin America Refillable And Reusable Packaging Market Revenue Share (%), by Material 2024 & 2032
- Figure 40: Latin America Refillable And Reusable Packaging Market Revenue (Million), by Product 2024 & 2032
- Figure 41: Latin America Refillable And Reusable Packaging Market Revenue Share (%), by Product 2024 & 2032
- Figure 42: Latin America Refillable And Reusable Packaging Market Revenue (Million), by End-user Industry 2024 & 2032
- Figure 43: Latin America Refillable And Reusable Packaging Market Revenue Share (%), by End-user Industry 2024 & 2032
- Figure 44: Latin America Refillable And Reusable Packaging Market Revenue (Million), by Country 2024 & 2032
- Figure 45: Latin America Refillable And Reusable Packaging Market Revenue Share (%), by Country 2024 & 2032
- Figure 46: Middle East and Africa Refillable And Reusable Packaging Market Revenue (Million), by Material 2024 & 2032
- Figure 47: Middle East and Africa Refillable And Reusable Packaging Market Revenue Share (%), by Material 2024 & 2032
- Figure 48: Middle East and Africa Refillable And Reusable Packaging Market Revenue (Million), by Product 2024 & 2032
- Figure 49: Middle East and Africa Refillable And Reusable Packaging Market Revenue Share (%), by Product 2024 & 2032
- Figure 50: Middle East and Africa Refillable And Reusable Packaging Market Revenue (Million), by End-user Industry 2024 & 2032
- Figure 51: Middle East and Africa Refillable And Reusable Packaging Market Revenue Share (%), by End-user Industry 2024 & 2032
- Figure 52: Middle East and Africa Refillable And Reusable Packaging Market Revenue (Million), by Country 2024 & 2032
- Figure 53: Middle East and Africa Refillable And Reusable Packaging Market Revenue Share (%), by Country 2024 & 2032
List of Tables
- Table 1: Global Refillable And Reusable Packaging Market Revenue Million Forecast, by Region 2019 & 2032
- Table 2: Global Refillable And Reusable Packaging Market Revenue Million Forecast, by Material 2019 & 2032
- Table 3: Global Refillable And Reusable Packaging Market Revenue Million Forecast, by Product 2019 & 2032
- Table 4: Global Refillable And Reusable Packaging Market Revenue Million Forecast, by End-user Industry 2019 & 2032
- Table 5: Global Refillable And Reusable Packaging Market Revenue Million Forecast, by Region 2019 & 2032
- Table 6: Global Refillable And Reusable Packaging Market Revenue Million Forecast, by Country 2019 & 2032
- Table 7: United States Refillable And Reusable Packaging Market Revenue (Million) Forecast, by Application 2019 & 2032
- Table 8: Canada Refillable And Reusable Packaging Market Revenue (Million) Forecast, by Application 2019 & 2032
- Table 9: Mexico Refillable And Reusable Packaging Market Revenue (Million) Forecast, by Application 2019 & 2032
- Table 10: Global Refillable And Reusable Packaging Market Revenue Million Forecast, by Country 2019 & 2032
- Table 11: Germany Refillable And Reusable Packaging Market Revenue (Million) Forecast, by Application 2019 & 2032
- Table 12: United Kingdom Refillable And Reusable Packaging Market Revenue (Million) Forecast, by Application 2019 & 2032
- Table 13: France Refillable And Reusable Packaging Market Revenue (Million) Forecast, by Application 2019 & 2032
- Table 14: Spain Refillable And Reusable Packaging Market Revenue (Million) Forecast, by Application 2019 & 2032
- Table 15: Italy Refillable And Reusable Packaging Market Revenue (Million) Forecast, by Application 2019 & 2032
- Table 16: Spain Refillable And Reusable Packaging Market Revenue (Million) Forecast, by Application 2019 & 2032
- Table 17: Belgium Refillable And Reusable Packaging Market Revenue (Million) Forecast, by Application 2019 & 2032
- Table 18: Netherland Refillable And Reusable Packaging Market Revenue (Million) Forecast, by Application 2019 & 2032
- Table 19: Nordics Refillable And Reusable Packaging Market Revenue (Million) Forecast, by Application 2019 & 2032
- Table 20: Rest of Europe Refillable And Reusable Packaging Market Revenue (Million) Forecast, by Application 2019 & 2032
- Table 21: Global Refillable And Reusable Packaging Market Revenue Million Forecast, by Country 2019 & 2032
- Table 22: China Refillable And Reusable Packaging Market Revenue (Million) Forecast, by Application 2019 & 2032
- Table 23: Japan Refillable And Reusable Packaging Market Revenue (Million) Forecast, by Application 2019 & 2032
- Table 24: India Refillable And Reusable Packaging Market Revenue (Million) Forecast, by Application 2019 & 2032
- Table 25: South Korea Refillable And Reusable Packaging Market Revenue (Million) Forecast, by Application 2019 & 2032
- Table 26: Southeast Asia Refillable And Reusable Packaging Market Revenue (Million) Forecast, by Application 2019 & 2032
- Table 27: Australia Refillable And Reusable Packaging Market Revenue (Million) Forecast, by Application 2019 & 2032
- Table 28: Indonesia Refillable And Reusable Packaging Market Revenue (Million) Forecast, by Application 2019 & 2032
- Table 29: Phillipes Refillable And Reusable Packaging Market Revenue (Million) Forecast, by Application 2019 & 2032
- Table 30: Singapore Refillable And Reusable Packaging Market Revenue (Million) Forecast, by Application 2019 & 2032
- Table 31: Thailandc Refillable And Reusable Packaging Market Revenue (Million) Forecast, by Application 2019 & 2032
- Table 32: Rest of Asia Pacific Refillable And Reusable Packaging Market Revenue (Million) Forecast, by Application 2019 & 2032
- Table 33: Global Refillable And Reusable Packaging Market Revenue Million Forecast, by Country 2019 & 2032
- Table 34: Brazil Refillable And Reusable Packaging Market Revenue (Million) Forecast, by Application 2019 & 2032
- Table 35: Argentina Refillable And Reusable Packaging Market Revenue (Million) Forecast, by Application 2019 & 2032
- Table 36: Peru Refillable And Reusable Packaging Market Revenue (Million) Forecast, by Application 2019 & 2032
- Table 37: Chile Refillable And Reusable Packaging Market Revenue (Million) Forecast, by Application 2019 & 2032
- Table 38: Colombia Refillable And Reusable Packaging Market Revenue (Million) Forecast, by Application 2019 & 2032
- Table 39: Ecuador Refillable And Reusable Packaging Market Revenue (Million) Forecast, by Application 2019 & 2032
- Table 40: Venezuela Refillable And Reusable Packaging Market Revenue (Million) Forecast, by Application 2019 & 2032
- Table 41: Rest of South America Refillable And Reusable Packaging Market Revenue (Million) Forecast, by Application 2019 & 2032
- Table 42: Global Refillable And Reusable Packaging Market Revenue Million Forecast, by Country 2019 & 2032
- Table 43: United States Refillable And Reusable Packaging Market Revenue (Million) Forecast, by Application 2019 & 2032
- Table 44: Canada Refillable And Reusable Packaging Market Revenue (Million) Forecast, by Application 2019 & 2032
- Table 45: Mexico Refillable And Reusable Packaging Market Revenue (Million) Forecast, by Application 2019 & 2032
- Table 46: Global Refillable And Reusable Packaging Market Revenue Million Forecast, by Country 2019 & 2032
- Table 47: United Arab Emirates Refillable And Reusable Packaging Market Revenue (Million) Forecast, by Application 2019 & 2032
- Table 48: Saudi Arabia Refillable And Reusable Packaging Market Revenue (Million) Forecast, by Application 2019 & 2032
- Table 49: South Africa Refillable And Reusable Packaging Market Revenue (Million) Forecast, by Application 2019 & 2032
- Table 50: Rest of Middle East and Africa Refillable And Reusable Packaging Market Revenue (Million) Forecast, by Application 2019 & 2032
- Table 51: Global Refillable And Reusable Packaging Market Revenue Million Forecast, by Material 2019 & 2032
- Table 52: Global Refillable And Reusable Packaging Market Revenue Million Forecast, by Product 2019 & 2032
- Table 53: Global Refillable And Reusable Packaging Market Revenue Million Forecast, by End-user Industry 2019 & 2032
- Table 54: Global Refillable And Reusable Packaging Market Revenue Million Forecast, by Country 2019 & 2032
- Table 55: Global Refillable And Reusable Packaging Market Revenue Million Forecast, by Material 2019 & 2032
- Table 56: Global Refillable And Reusable Packaging Market Revenue Million Forecast, by Product 2019 & 2032
- Table 57: Global Refillable And Reusable Packaging Market Revenue Million Forecast, by End-user Industry 2019 & 2032
- Table 58: Global Refillable And Reusable Packaging Market Revenue Million Forecast, by Country 2019 & 2032
- Table 59: Global Refillable And Reusable Packaging Market Revenue Million Forecast, by Material 2019 & 2032
- Table 60: Global Refillable And Reusable Packaging Market Revenue Million Forecast, by Product 2019 & 2032
- Table 61: Global Refillable And Reusable Packaging Market Revenue Million Forecast, by End-user Industry 2019 & 2032
- Table 62: Global Refillable And Reusable Packaging Market Revenue Million Forecast, by Country 2019 & 2032
- Table 63: Global Refillable And Reusable Packaging Market Revenue Million Forecast, by Material 2019 & 2032
- Table 64: Global Refillable And Reusable Packaging Market Revenue Million Forecast, by Product 2019 & 2032
- Table 65: Global Refillable And Reusable Packaging Market Revenue Million Forecast, by End-user Industry 2019 & 2032
- Table 66: Global Refillable And Reusable Packaging Market Revenue Million Forecast, by Country 2019 & 2032
- Table 67: Global Refillable And Reusable Packaging Market Revenue Million Forecast, by Material 2019 & 2032
- Table 68: Global Refillable And Reusable Packaging Market Revenue Million Forecast, by Product 2019 & 2032
- Table 69: Global Refillable And Reusable Packaging Market Revenue Million Forecast, by End-user Industry 2019 & 2032
- Table 70: Global Refillable And Reusable Packaging Market Revenue Million Forecast, by Country 2019 & 2032
Frequently Asked Questions
1. What is the projected Compound Annual Growth Rate (CAGR) of the Refillable And Reusable Packaging Market?
The projected CAGR is approximately 4.43%.
2. Which companies are prominent players in the Refillable And Reusable Packaging Market?
Key companies in the market include Nefab Group, Smurfit Kappa Group, Schoeller Allibert Services BV, Greif Inc, Amcor PLC, Mondi PLC, IPL Inc, IFCO Systems, Petainer Ltd, Bormioli Luigi Corporation, Vetropack Holding Ltd, Jiangmen UA Packaging Co Lt, GWP Group, Refillism, Berry Global Inc, Orbis Corporation, International Paper.
3. What are the main segments of the Refillable And Reusable Packaging Market?
The market segments include Material, Product, End-user Industry.
4. Can you provide details about the market size?
The market size is estimated to be USD 45.67 Million as of 2022.
5. What are some drivers contributing to market growth?
Rising Demand for Sustainable and Recyclable Refillable Packaging; Increasing Need for Smart and Trackable Reusable Packaging Solutions.
6. What are the notable trends driving market growth?
Pallets and Crates are Expected to Witness Growth.
7. Are there any restraints impacting market growth?
Supply Chain Disruptions and Regulatory Changes Might Limit the Market Growth.
8. Can you provide examples of recent developments in the market?
October 2023: Berry Global Inc. launched a 14-liter HDPE reusable container. The container plays a central role as the vessel for a new refill packaging solution from the Refill Coalition. The pilot for the solution was initiated at Aldi UK in its Solihull branch.
9. What pricing options are available for accessing the report?
Pricing options include single-user, multi-user, and enterprise licenses priced at USD 4750, USD 5250, and USD 8750 respectively.
10. Is the market size provided in terms of value or volume?
The market size is provided in terms of value, measured in Million.
11. Are there any specific market keywords associated with the report?
Yes, the market keyword associated with the report is "Refillable And Reusable Packaging Market," which aids in identifying and referencing the specific market segment covered.
12. How do I determine which pricing option suits my needs best?
The pricing options vary based on user requirements and access needs. Individual users may opt for single-user licenses, while businesses requiring broader access may choose multi-user or enterprise licenses for cost-effective access to the report.
13. Are there any additional resources or data provided in the Refillable And Reusable Packaging Market report?
While the report offers comprehensive insights, it's advisable to review the specific contents or supplementary materials provided to ascertain if additional resources or data are available.
14. How can I stay updated on further developments or reports in the Refillable And Reusable Packaging Market?
To stay informed about further developments, trends, and reports in the Refillable And Reusable Packaging Market, consider subscribing to industry newsletters, following relevant companies and organizations, or regularly checking reputable industry news sources and publications.
Methodology
Step 1 - Identification of Relevant Samples Size from Population Database


Step 2 - Approaches for Defining Global Market Size (Value, Volume* & Price*)

Note*: In applicable scenarios
Step 3 - Data Sources
Primary Research
- Web Analytics
- Survey Reports
- Research Institute
- Latest Research Reports
- Opinion Leaders
Secondary Research
- Annual Reports
- White Paper
- Latest Press Release
- Industry Association
- Paid Database
- Investor Presentations

Step 4 - Data Triangulation
Involves using different sources of information in order to increase the validity of a study
These sources are likely to be stakeholders in a program - participants, other researchers, program staff, other community members, and so on.
Then we put all data in single framework & apply various statistical tools to find out the dynamic on the market.
During the analysis stage, feedback from the stakeholder groups would be compared to determine areas of agreement as well as areas of divergence
