

Key Insights
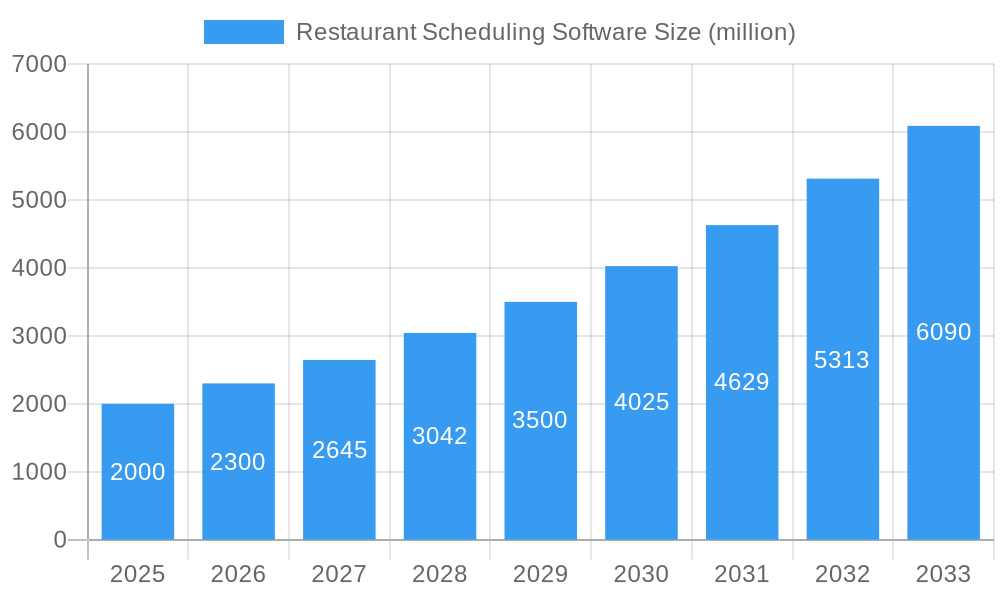
The restaurant industry is experiencing a significant shift towards digitalization, and restaurant scheduling software is at the forefront of this transformation. The market, currently valued at approximately $2 billion in 2025, is projected to experience robust growth, with a Compound Annual Growth Rate (CAGR) of 15% from 2025 to 2033. This expansion is driven by several key factors: the increasing need for efficient labor management in a competitive labor market, the demand for improved employee scheduling accuracy to minimize labor costs, and the rising adoption of cloud-based solutions for enhanced accessibility and data management. Furthermore, the integration of advanced features like time-and-attendance tracking, automated scheduling, and employee communication tools within these platforms significantly boosts their appeal. The market is witnessing a transition from manual scheduling processes to automated systems, enabling restaurants to optimize their workforce, reduce administrative overhead, and enhance overall operational efficiency.
Restaurant Scheduling Software Market Size (In Billion)
Major players like 7shifts, Jolt, and others are driving innovation within the sector, offering tailored solutions for various restaurant types and sizes. Growth is further propelled by the increasing adoption of mobile-friendly interfaces, allowing staff to access schedules and communicate effectively from any device. However, the market faces some challenges, including the initial investment costs for implementing new software and the need for staff training. Despite these constraints, the long-term benefits of improved efficiency, reduced labor costs, and increased employee satisfaction are expected to outweigh these initial hurdles, leading to sustained market expansion throughout the forecast period. Segmentation within the market caters to various restaurant sizes, from small independent eateries to large chains, indicating a diverse and expanding user base. Geographic expansion is another factor that will contribute to market growth, with regions like North America and Europe expected to lead initially, followed by growth in Asia-Pacific and other developing economies.
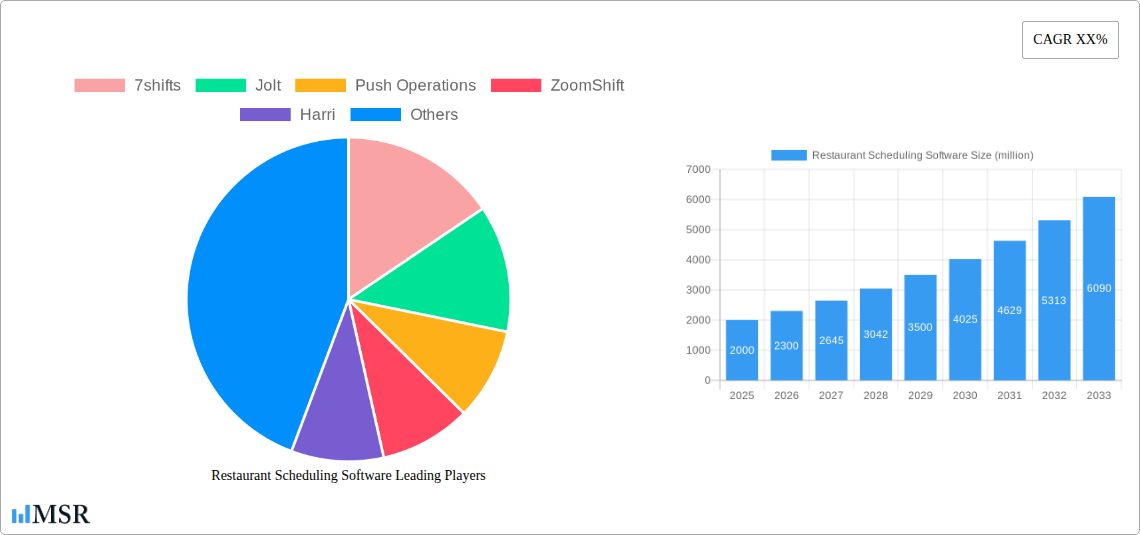
Restaurant Scheduling Software Company Market Share
Restaurant Scheduling Software Market Report: A Comprehensive Analysis (2019-2033)
This comprehensive report provides an in-depth analysis of the global Restaurant Scheduling Software market, projecting a market size of $XX million by 2033. The report covers the historical period (2019-2024), base year (2025), and forecast period (2025-2033), offering invaluable insights for industry stakeholders, investors, and businesses involved in the restaurant technology sector. The study examines market dynamics, key players, emerging trends, and future growth opportunities within this rapidly evolving market.
Restaurant Scheduling Software Market Concentration & Dynamics
The restaurant scheduling software market exhibits a moderately concentrated landscape, with a few major players commanding significant market share. In 2025, the top 5 players (7shifts, Jolt, Push Operations, ZoomShift, and Harri) are estimated to hold approximately 45% of the market. This concentration is driven by factors such as brand recognition, established customer bases, and robust feature sets. However, the market also shows a presence of numerous smaller, niche players offering specialized solutions. Innovation is a significant driving force, with continuous advancements in AI-powered scheduling, integration with POS systems, and enhanced employee engagement features. Regulatory frameworks, while not overly restrictive, play a role in data privacy and compliance, influencing product development. Substitute products, such as manual scheduling or spreadsheet-based solutions, still exist but are gradually losing market share due to efficiency limitations. End-user trends indicate increasing demand for user-friendly interfaces, mobile accessibility, and robust reporting capabilities. M&A activities in the sector have been moderate in recent years, with approximately XX deals recorded between 2019 and 2024. Further consolidation is anticipated as larger players seek to expand their market reach and product offerings.
- Market Share (2025): Top 5 players - 45% (estimated)
- M&A Deal Count (2019-2024): XX
Restaurant Scheduling Software Industry Insights & Trends
The global restaurant scheduling software market is experiencing robust growth, driven by a multitude of factors. The market size was valued at $XX million in 2025 and is projected to reach $XX million by 2033, exhibiting a compound annual growth rate (CAGR) of XX%. Key growth drivers include the increasing adoption of technology within the restaurant industry, the need for improved labor management, and the rising demand for efficient workforce optimization. Technological disruptions, such as the integration of AI and machine learning, are transforming scheduling practices, enabling more precise forecasting, optimized staffing levels, and reduced labor costs. Evolving consumer behaviors, particularly the increasing reliance on mobile devices and the expectation of seamless digital experiences, are also shaping the demand for user-friendly and accessible scheduling solutions. These advancements are significantly impacting restaurant operations, leading to improved efficiency, reduced costs, and enhanced employee satisfaction.
Key Markets & Segments Leading Restaurant Scheduling Software
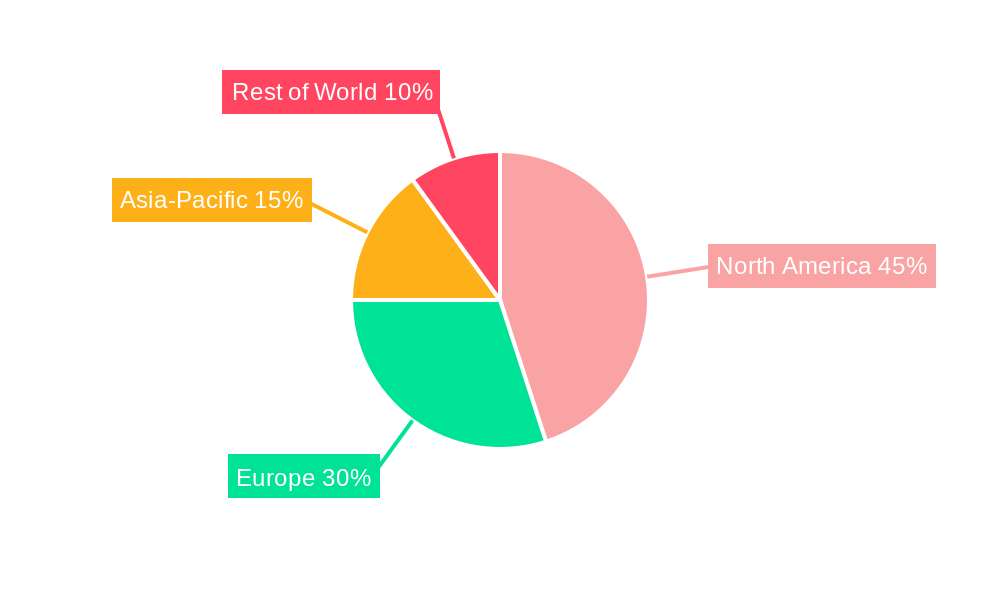
The North American region currently dominates the restaurant scheduling software market, driven by factors such as high technology adoption rates, a large and mature restaurant industry, and the presence of major software vendors. Within North America, the United States holds the largest market share.
Drivers for Dominance in North America:
- High Technology Adoption: Advanced technology is readily embraced by restaurants across various sizes.
- Mature Restaurant Industry: A large and established restaurant sector provides a substantial customer base.
- Strong Vendor Presence: Many leading software providers are headquartered in or have major operations in North America.
- Economic Growth: Stable economic conditions foster technology investments.
- Robust Infrastructure: A well-developed infrastructure facilitates seamless technology deployment.
This dominance is further solidified by the high concentration of large restaurant chains in the region, which tend to be early adopters of such solutions. While other regions, like Europe and Asia-Pacific, are showing significant growth potential, North America maintains its leading position due to its established market and technological infrastructure.
Restaurant Scheduling Software Product Developments
Recent product innovations focus on enhanced user experience, seamless integrations with POS systems and other restaurant management tools, advanced analytics for performance tracking, and AI-powered features for intelligent scheduling and workforce optimization. These developments provide restaurants with greater control over labor costs, improved employee engagement, and enhanced operational efficiency, creating a significant competitive edge in the market. The integration of mobile-first functionalities and robust reporting capabilities are further solidifying the market value proposition.
Challenges in the Restaurant Scheduling Software Market
The restaurant scheduling software market faces certain challenges. High implementation costs can be a barrier for smaller restaurants. Integration complexities with existing systems can also pose a hurdle. Furthermore, intense competition and the need for continuous innovation to stay ahead of the curve place pressure on vendors. The market also faces some regulatory hurdles concerning data privacy and compliance which demands considerable investment in security protocols. These factors can limit market penetration, particularly among smaller businesses with limited IT budgets.
Forces Driving Restaurant Scheduling Software Growth
Several forces are driving market growth. The increasing need to reduce labor costs and improve efficiency is a primary driver. Technological advancements, such as AI-powered predictive scheduling and mobile-first platforms, are enhancing functionality and usability. Government regulations promoting automation and data privacy are also indirectly contributing to adoption. The growing popularity of cloud-based solutions is further boosting accessibility and affordability. These factors collectively propel the market towards sustained expansion.
Long-Term Growth Catalysts in the Restaurant Scheduling Software Market
Long-term growth is fueled by the continuous evolution of technology, fostering innovations such as predictive analytics, enhanced employee self-service portals, and streamlined integration with other restaurant management systems. Strategic partnerships between software providers and POS companies further enhance market penetration. Expansion into new geographical markets, especially in developing economies with burgeoning restaurant industries, presents substantial growth opportunities.
Emerging Opportunities in Restaurant Scheduling Software
The market presents opportunities in areas such as enhanced AI capabilities to provide truly optimized schedules, personalized employee engagement tools, and advanced analytics to provide actionable insights into staff productivity. Expansion into new market segments, such as quick-service restaurants (QSRs) and ghost kitchens, presents additional avenues for growth. The integration of IoT (Internet of Things) devices, for instance, could enhance data collection and automation further improving scheduling accuracy. Focus on addressing the needs of small and medium-sized restaurants, by offering affordable and user-friendly solutions will unlock significant untapped market potential.
Key Milestones in Restaurant Scheduling Software Industry
- 2020: Increased focus on cloud-based solutions and mobile accessibility.
- 2021: Significant advancements in AI-powered scheduling features.
- 2022: Growing emphasis on data analytics and reporting capabilities.
- 2023: Integration with other restaurant management systems became widespread.
- 2024: Several M&A activities aimed at consolidating market share.
Strategic Outlook for Restaurant Scheduling Software Market
The future of the restaurant scheduling software market is bright, with considerable potential for growth driven by technological advancements, increasing demand for efficiency, and expansion into new markets. Strategic opportunities lie in developing innovative solutions that address the unique challenges faced by different restaurant segments, focusing on user experience, cost-effectiveness, and seamless integration with existing systems. The continued integration of AI and machine learning will play a pivotal role in shaping future market trends and driving further growth.
Restaurant Scheduling Software Segmentation
-
1. Application
- 1.1. Restaurants
- 1.2. Other Food Service Sector
-
2. Types
- 2.1. Cloud Based
- 2.2. Web Based
Restaurant Scheduling Software Segmentation By Geography
-
1. North America
- 1.1. United States
- 1.2. Canada
- 1.3. Mexico
-
2. South America
- 2.1. Brazil
- 2.2. Argentina
- 2.3. Rest of South America
-
3. Europe
- 3.1. United Kingdom
- 3.2. Germany
- 3.3. France
- 3.4. Italy
- 3.5. Spain
- 3.6. Russia
- 3.7. Benelux
- 3.8. Nordics
- 3.9. Rest of Europe
-
4. Middle East & Africa
- 4.1. Turkey
- 4.2. Israel
- 4.3. GCC
- 4.4. North Africa
- 4.5. South Africa
- 4.6. Rest of Middle East & Africa
-
5. Asia Pacific
- 5.1. China
- 5.2. India
- 5.3. Japan
- 5.4. South Korea
- 5.5. ASEAN
- 5.6. Oceania
- 5.7. Rest of Asia Pacific
Restaurant Scheduling Software Regional Market Share
Geographic Coverage of Restaurant Scheduling Software
Restaurant Scheduling Software REPORT HIGHLIGHTS
| Aspects | Details |
|---|---|
| Study Period | 2020-2034 |
| Base Year | 2025 |
| Estimated Year | 2026 |
| Forecast Period | 2026-2034 |
| Historical Period | 2020-2025 |
| Growth Rate | CAGR of XX% from 2020-2034 |
| Segmentation |
|
Table of Contents
- 1. Introduction
- 1.1. Research Scope
- 1.2. Market Segmentation
- 1.3. Research Objective
- 1.4. Definitions and Assumptions
- 2. Executive Summary
- 2.1. Market Snapshot
- 3. Market Dynamics
- 3.1. Market Drivers
- 3.2. Market Restrains
- 3.3. Market Trends
- 3.4. Market Opportunities
- 4. Market Factor Analysis
- 4.1. Porters Five Forces
- 4.1.1. Bargaining Power of Suppliers
- 4.1.2. Bargaining Power of Buyers
- 4.1.3. Threat of New Entrants
- 4.1.4. Threat of Substitutes
- 4.1.5. Competitive Rivalry
- 4.2. PESTEL analysis
- 4.3. BCG Analysis
- 4.3.1. Stars (High Growth, High Market Share)
- 4.3.2. Cash Cows (Low Growth, High Market Share)
- 4.3.3. Question Mark (High Growth, Low Market Share)
- 4.3.4. Dogs (Low Growth, Low Market Share)
- 4.4. Ansoff Matrix Analysis
- 4.5. Supply Chain Analysis
- 4.6. Regulatory Landscape
- 4.7. Current Market Potential and Opportunity Assessment (TAM–SAM–SOM Framework)
- 4.8. MSR Analyst Note
- 4.1. Porters Five Forces
- 5. Market Analysis, Insights and Forecast 2021-2033
- 5.1. Market Analysis, Insights and Forecast - by Application
- 5.1.1. Restaurants
- 5.1.2. Other Food Service Sector
- 5.2. Market Analysis, Insights and Forecast - by Types
- 5.2.1. Cloud Based
- 5.2.2. Web Based
- 5.3. Market Analysis, Insights and Forecast - by Region
- 5.3.1. North America
- 5.3.2. South America
- 5.3.3. Europe
- 5.3.4. Middle East & Africa
- 5.3.5. Asia Pacific
- 5.1. Market Analysis, Insights and Forecast - by Application
- 6. Global Restaurant Scheduling Software Analysis, Insights and Forecast, 2021-2033
- 6.1. Market Analysis, Insights and Forecast - by Application
- 6.1.1. Restaurants
- 6.1.2. Other Food Service Sector
- 6.2. Market Analysis, Insights and Forecast - by Types
- 6.2.1. Cloud Based
- 6.2.2. Web Based
- 6.1. Market Analysis, Insights and Forecast - by Application
- 7. North America Restaurant Scheduling Software Analysis, Insights and Forecast, 2020-2032
- 7.1. Market Analysis, Insights and Forecast - by Application
- 7.1.1. Restaurants
- 7.1.2. Other Food Service Sector
- 7.2. Market Analysis, Insights and Forecast - by Types
- 7.2.1. Cloud Based
- 7.2.2. Web Based
- 7.1. Market Analysis, Insights and Forecast - by Application
- 8. South America Restaurant Scheduling Software Analysis, Insights and Forecast, 2020-2032
- 8.1. Market Analysis, Insights and Forecast - by Application
- 8.1.1. Restaurants
- 8.1.2. Other Food Service Sector
- 8.2. Market Analysis, Insights and Forecast - by Types
- 8.2.1. Cloud Based
- 8.2.2. Web Based
- 8.1. Market Analysis, Insights and Forecast - by Application
- 9. Europe Restaurant Scheduling Software Analysis, Insights and Forecast, 2020-2032
- 9.1. Market Analysis, Insights and Forecast - by Application
- 9.1.1. Restaurants
- 9.1.2. Other Food Service Sector
- 9.2. Market Analysis, Insights and Forecast - by Types
- 9.2.1. Cloud Based
- 9.2.2. Web Based
- 9.1. Market Analysis, Insights and Forecast - by Application
- 10. Middle East & Africa Restaurant Scheduling Software Analysis, Insights and Forecast, 2020-2032
- 10.1. Market Analysis, Insights and Forecast - by Application
- 10.1.1. Restaurants
- 10.1.2. Other Food Service Sector
- 10.2. Market Analysis, Insights and Forecast - by Types
- 10.2.1. Cloud Based
- 10.2.2. Web Based
- 10.1. Market Analysis, Insights and Forecast - by Application
- 11. Asia Pacific Restaurant Scheduling Software Analysis, Insights and Forecast, 2020-2032
- 11.1. Market Analysis, Insights and Forecast - by Application
- 11.1.1. Restaurants
- 11.1.2. Other Food Service Sector
- 11.2. Market Analysis, Insights and Forecast - by Types
- 11.2.1. Cloud Based
- 11.2.2. Web Based
- 11.1. Market Analysis, Insights and Forecast - by Application
- 12. Competitive Analysis
- 12.1. Company Profiles
- 12.1.1 7shifts
- 12.1.1.1. Company Overview
- 12.1.1.2. Products
- 12.1.1.3. Company Financials
- 12.1.1.4. SWOT Analysis
- 12.1.2 Jolt
- 12.1.2.1. Company Overview
- 12.1.2.2. Products
- 12.1.2.3. Company Financials
- 12.1.2.4. SWOT Analysis
- 12.1.3 Push Operations
- 12.1.3.1. Company Overview
- 12.1.3.2. Products
- 12.1.3.3. Company Financials
- 12.1.3.4. SWOT Analysis
- 12.1.4 ZoomShift
- 12.1.4.1. Company Overview
- 12.1.4.2. Products
- 12.1.4.3. Company Financials
- 12.1.4.4. SWOT Analysis
- 12.1.5 Harri
- 12.1.5.1. Company Overview
- 12.1.5.2. Products
- 12.1.5.3. Company Financials
- 12.1.5.4. SWOT Analysis
- 12.1.6 Sling
- 12.1.6.1. Company Overview
- 12.1.6.2. Products
- 12.1.6.3. Company Financials
- 12.1.6.4. SWOT Analysis
- 12.1.7 Schedulefly
- 12.1.7.1. Company Overview
- 12.1.7.2. Products
- 12.1.7.3. Company Financials
- 12.1.7.4. SWOT Analysis
- 12.1.8 Bizimply
- 12.1.8.1. Company Overview
- 12.1.8.2. Products
- 12.1.8.3. Company Financials
- 12.1.8.4. SWOT Analysis
- 12.1.9 RestaurantOps
- 12.1.9.1. Company Overview
- 12.1.9.2. Products
- 12.1.9.3. Company Financials
- 12.1.9.4. SWOT Analysis
- 12.1.10 Better Chains
- 12.1.10.1. Company Overview
- 12.1.10.2. Products
- 12.1.10.3. Company Financials
- 12.1.10.4. SWOT Analysis
- 12.1.11 Schedule101
- 12.1.11.1. Company Overview
- 12.1.11.2. Products
- 12.1.11.3. Company Financials
- 12.1.11.4. SWOT Analysis
- 12.1.1 7shifts
- 12.2. Market Entropy
- 12.2.1 Company's Key Areas Served
- 12.2.2 Recent Developments
- 12.3. Company Market Share Analysis 2025
- 12.3.1 Top 5 Companies Market Share Analysis
- 12.3.2 Top 3 Companies Market Share Analysis
- 12.4. List of Potential Customers
- 13. Research Methodology
List of Figures
- Figure 1: Global Restaurant Scheduling Software Revenue Breakdown (million, %) by Region 2025 & 2033
- Figure 2: North America Restaurant Scheduling Software Revenue (million), by Application 2025 & 2033
- Figure 3: North America Restaurant Scheduling Software Revenue Share (%), by Application 2025 & 2033
- Figure 4: North America Restaurant Scheduling Software Revenue (million), by Types 2025 & 2033
- Figure 5: North America Restaurant Scheduling Software Revenue Share (%), by Types 2025 & 2033
- Figure 6: North America Restaurant Scheduling Software Revenue (million), by Country 2025 & 2033
- Figure 7: North America Restaurant Scheduling Software Revenue Share (%), by Country 2025 & 2033
- Figure 8: South America Restaurant Scheduling Software Revenue (million), by Application 2025 & 2033
- Figure 9: South America Restaurant Scheduling Software Revenue Share (%), by Application 2025 & 2033
- Figure 10: South America Restaurant Scheduling Software Revenue (million), by Types 2025 & 2033
- Figure 11: South America Restaurant Scheduling Software Revenue Share (%), by Types 2025 & 2033
- Figure 12: South America Restaurant Scheduling Software Revenue (million), by Country 2025 & 2033
- Figure 13: South America Restaurant Scheduling Software Revenue Share (%), by Country 2025 & 2033
- Figure 14: Europe Restaurant Scheduling Software Revenue (million), by Application 2025 & 2033
- Figure 15: Europe Restaurant Scheduling Software Revenue Share (%), by Application 2025 & 2033
- Figure 16: Europe Restaurant Scheduling Software Revenue (million), by Types 2025 & 2033
- Figure 17: Europe Restaurant Scheduling Software Revenue Share (%), by Types 2025 & 2033
- Figure 18: Europe Restaurant Scheduling Software Revenue (million), by Country 2025 & 2033
- Figure 19: Europe Restaurant Scheduling Software Revenue Share (%), by Country 2025 & 2033
- Figure 20: Middle East & Africa Restaurant Scheduling Software Revenue (million), by Application 2025 & 2033
- Figure 21: Middle East & Africa Restaurant Scheduling Software Revenue Share (%), by Application 2025 & 2033
- Figure 22: Middle East & Africa Restaurant Scheduling Software Revenue (million), by Types 2025 & 2033
- Figure 23: Middle East & Africa Restaurant Scheduling Software Revenue Share (%), by Types 2025 & 2033
- Figure 24: Middle East & Africa Restaurant Scheduling Software Revenue (million), by Country 2025 & 2033
- Figure 25: Middle East & Africa Restaurant Scheduling Software Revenue Share (%), by Country 2025 & 2033
- Figure 26: Asia Pacific Restaurant Scheduling Software Revenue (million), by Application 2025 & 2033
- Figure 27: Asia Pacific Restaurant Scheduling Software Revenue Share (%), by Application 2025 & 2033
- Figure 28: Asia Pacific Restaurant Scheduling Software Revenue (million), by Types 2025 & 2033
- Figure 29: Asia Pacific Restaurant Scheduling Software Revenue Share (%), by Types 2025 & 2033
- Figure 30: Asia Pacific Restaurant Scheduling Software Revenue (million), by Country 2025 & 2033
- Figure 31: Asia Pacific Restaurant Scheduling Software Revenue Share (%), by Country 2025 & 2033
List of Tables
- Table 1: Global Restaurant Scheduling Software Revenue million Forecast, by Application 2020 & 2033
- Table 2: Global Restaurant Scheduling Software Revenue million Forecast, by Types 2020 & 2033
- Table 3: Global Restaurant Scheduling Software Revenue million Forecast, by Region 2020 & 2033
- Table 4: Global Restaurant Scheduling Software Revenue million Forecast, by Application 2020 & 2033
- Table 5: Global Restaurant Scheduling Software Revenue million Forecast, by Types 2020 & 2033
- Table 6: Global Restaurant Scheduling Software Revenue million Forecast, by Country 2020 & 2033
- Table 7: United States Restaurant Scheduling Software Revenue (million) Forecast, by Application 2020 & 2033
- Table 8: Canada Restaurant Scheduling Software Revenue (million) Forecast, by Application 2020 & 2033
- Table 9: Mexico Restaurant Scheduling Software Revenue (million) Forecast, by Application 2020 & 2033
- Table 10: Global Restaurant Scheduling Software Revenue million Forecast, by Application 2020 & 2033
- Table 11: Global Restaurant Scheduling Software Revenue million Forecast, by Types 2020 & 2033
- Table 12: Global Restaurant Scheduling Software Revenue million Forecast, by Country 2020 & 2033
- Table 13: Brazil Restaurant Scheduling Software Revenue (million) Forecast, by Application 2020 & 2033
- Table 14: Argentina Restaurant Scheduling Software Revenue (million) Forecast, by Application 2020 & 2033
- Table 15: Rest of South America Restaurant Scheduling Software Revenue (million) Forecast, by Application 2020 & 2033
- Table 16: Global Restaurant Scheduling Software Revenue million Forecast, by Application 2020 & 2033
- Table 17: Global Restaurant Scheduling Software Revenue million Forecast, by Types 2020 & 2033
- Table 18: Global Restaurant Scheduling Software Revenue million Forecast, by Country 2020 & 2033
- Table 19: United Kingdom Restaurant Scheduling Software Revenue (million) Forecast, by Application 2020 & 2033
- Table 20: Germany Restaurant Scheduling Software Revenue (million) Forecast, by Application 2020 & 2033
- Table 21: France Restaurant Scheduling Software Revenue (million) Forecast, by Application 2020 & 2033
- Table 22: Italy Restaurant Scheduling Software Revenue (million) Forecast, by Application 2020 & 2033
- Table 23: Spain Restaurant Scheduling Software Revenue (million) Forecast, by Application 2020 & 2033
- Table 24: Russia Restaurant Scheduling Software Revenue (million) Forecast, by Application 2020 & 2033
- Table 25: Benelux Restaurant Scheduling Software Revenue (million) Forecast, by Application 2020 & 2033
- Table 26: Nordics Restaurant Scheduling Software Revenue (million) Forecast, by Application 2020 & 2033
- Table 27: Rest of Europe Restaurant Scheduling Software Revenue (million) Forecast, by Application 2020 & 2033
- Table 28: Global Restaurant Scheduling Software Revenue million Forecast, by Application 2020 & 2033
- Table 29: Global Restaurant Scheduling Software Revenue million Forecast, by Types 2020 & 2033
- Table 30: Global Restaurant Scheduling Software Revenue million Forecast, by Country 2020 & 2033
- Table 31: Turkey Restaurant Scheduling Software Revenue (million) Forecast, by Application 2020 & 2033
- Table 32: Israel Restaurant Scheduling Software Revenue (million) Forecast, by Application 2020 & 2033
- Table 33: GCC Restaurant Scheduling Software Revenue (million) Forecast, by Application 2020 & 2033
- Table 34: North Africa Restaurant Scheduling Software Revenue (million) Forecast, by Application 2020 & 2033
- Table 35: South Africa Restaurant Scheduling Software Revenue (million) Forecast, by Application 2020 & 2033
- Table 36: Rest of Middle East & Africa Restaurant Scheduling Software Revenue (million) Forecast, by Application 2020 & 2033
- Table 37: Global Restaurant Scheduling Software Revenue million Forecast, by Application 2020 & 2033
- Table 38: Global Restaurant Scheduling Software Revenue million Forecast, by Types 2020 & 2033
- Table 39: Global Restaurant Scheduling Software Revenue million Forecast, by Country 2020 & 2033
- Table 40: China Restaurant Scheduling Software Revenue (million) Forecast, by Application 2020 & 2033
- Table 41: India Restaurant Scheduling Software Revenue (million) Forecast, by Application 2020 & 2033
- Table 42: Japan Restaurant Scheduling Software Revenue (million) Forecast, by Application 2020 & 2033
- Table 43: South Korea Restaurant Scheduling Software Revenue (million) Forecast, by Application 2020 & 2033
- Table 44: ASEAN Restaurant Scheduling Software Revenue (million) Forecast, by Application 2020 & 2033
- Table 45: Oceania Restaurant Scheduling Software Revenue (million) Forecast, by Application 2020 & 2033
- Table 46: Rest of Asia Pacific Restaurant Scheduling Software Revenue (million) Forecast, by Application 2020 & 2033
Frequently Asked Questions
1. What is the projected Compound Annual Growth Rate (CAGR) of the Restaurant Scheduling Software?
The projected CAGR is approximately XX%.
2. Which companies are prominent players in the Restaurant Scheduling Software?
Key companies in the market include 7shifts, Jolt, Push Operations, ZoomShift, Harri, Sling, Schedulefly, Bizimply, RestaurantOps, Better Chains, Schedule101.
3. What are the main segments of the Restaurant Scheduling Software?
The market segments include Application, Types.
4. Can you provide details about the market size?
The market size is estimated to be USD XXX million as of 2022.
5. What are some drivers contributing to market growth?
N/A
6. What are the notable trends driving market growth?
N/A
7. Are there any restraints impacting market growth?
N/A
8. Can you provide examples of recent developments in the market?
N/A
9. What pricing options are available for accessing the report?
Pricing options include single-user, multi-user, and enterprise licenses priced at USD 4900.00, USD 7350.00, and USD 9800.00 respectively.
10. Is the market size provided in terms of value or volume?
The market size is provided in terms of value, measured in million.
11. Are there any specific market keywords associated with the report?
Yes, the market keyword associated with the report is "Restaurant Scheduling Software," which aids in identifying and referencing the specific market segment covered.
12. How do I determine which pricing option suits my needs best?
The pricing options vary based on user requirements and access needs. Individual users may opt for single-user licenses, while businesses requiring broader access may choose multi-user or enterprise licenses for cost-effective access to the report.
13. Are there any additional resources or data provided in the Restaurant Scheduling Software report?
While the report offers comprehensive insights, it's advisable to review the specific contents or supplementary materials provided to ascertain if additional resources or data are available.
14. How can I stay updated on further developments or reports in the Restaurant Scheduling Software?
To stay informed about further developments, trends, and reports in the Restaurant Scheduling Software, consider subscribing to industry newsletters, following relevant companies and organizations, or regularly checking reputable industry news sources and publications.
Methodology
Step 1 - Identification of Relevant Samples Size from Population Database


Step 2 - Approaches for Defining Global Market Size (Value, Volume* & Price*)

Note*: In applicable scenarios
Step 3 - Data Sources
Primary Research
- Web Analytics
- Survey Reports
- Research Institute
- Latest Research Reports
- Opinion Leaders
Secondary Research
- Annual Reports
- White Paper
- Latest Press Release
- Industry Association
- Paid Database
- Investor Presentations

Step 4 - Data Triangulation
Involves using different sources of information in order to increase the validity of a study
These sources are likely to be stakeholders in a program - participants, other researchers, program staff, other community members, and so on.
Then we put all data in single framework & apply various statistical tools to find out the dynamic on the market.
During the analysis stage, feedback from the stakeholder groups would be compared to determine areas of agreement as well as areas of divergence