

Key Insights
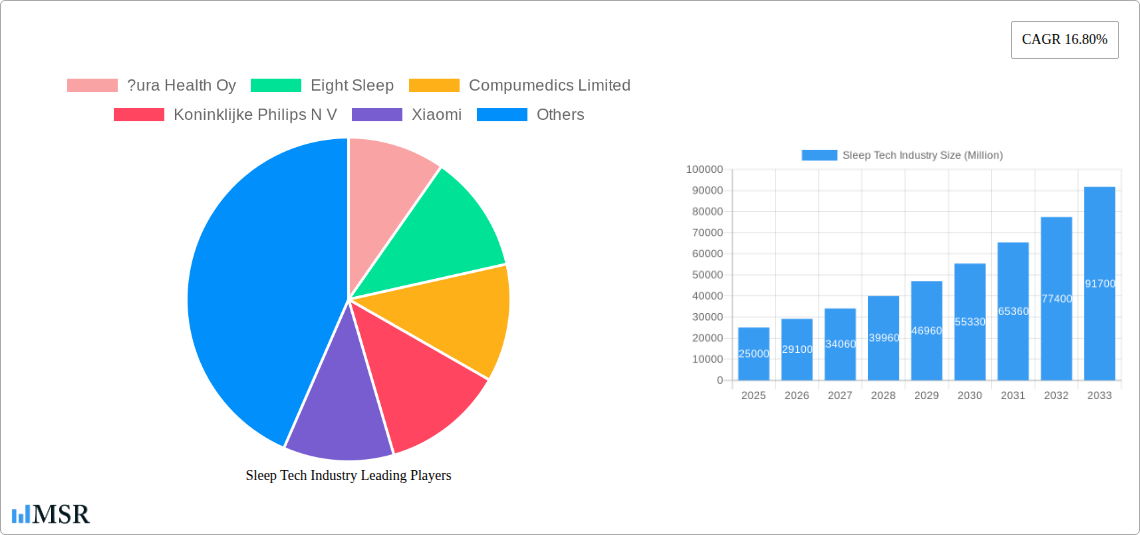
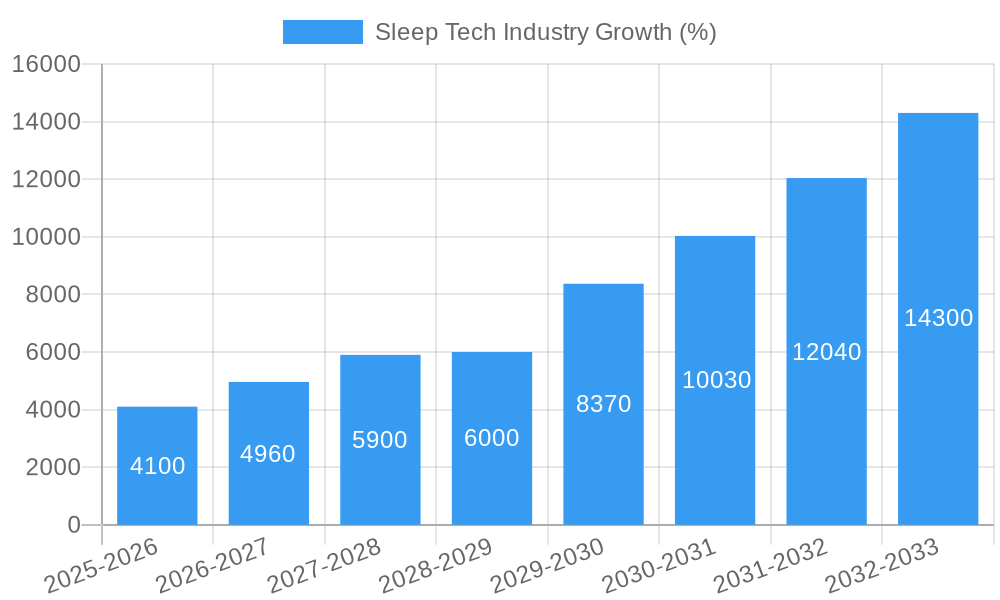
The global sleep technology market is experiencing robust growth, projected to reach a substantial size with a Compound Annual Growth Rate (CAGR) of 16.80% from 2025 to 2033. This expansion is driven by several key factors. Increasing awareness of sleep disorders and their impact on overall health is fueling demand for sleep monitoring devices and therapeutic solutions. The rising prevalence of chronic conditions like insomnia and sleep apnea, coupled with a growing elderly population (more susceptible to sleep disturbances), further accelerates market growth. Technological advancements, particularly in areas like AI-powered sleep analysis and personalized sleep improvement apps, are contributing to more sophisticated and accessible sleep tech solutions. The integration of wearables and non-wearables into smart homes enhances user experience and data collection, providing valuable insights for better sleep management. The market is segmented by product (wearables, non-wearables, others) and end-user (hospitals, homecare settings, others), with wearables currently dominating, although the non-wearable segment (e.g., sleep masks, mattresses) shows considerable growth potential due to the increasing demand for sophisticated yet non-invasive sleep solutions.
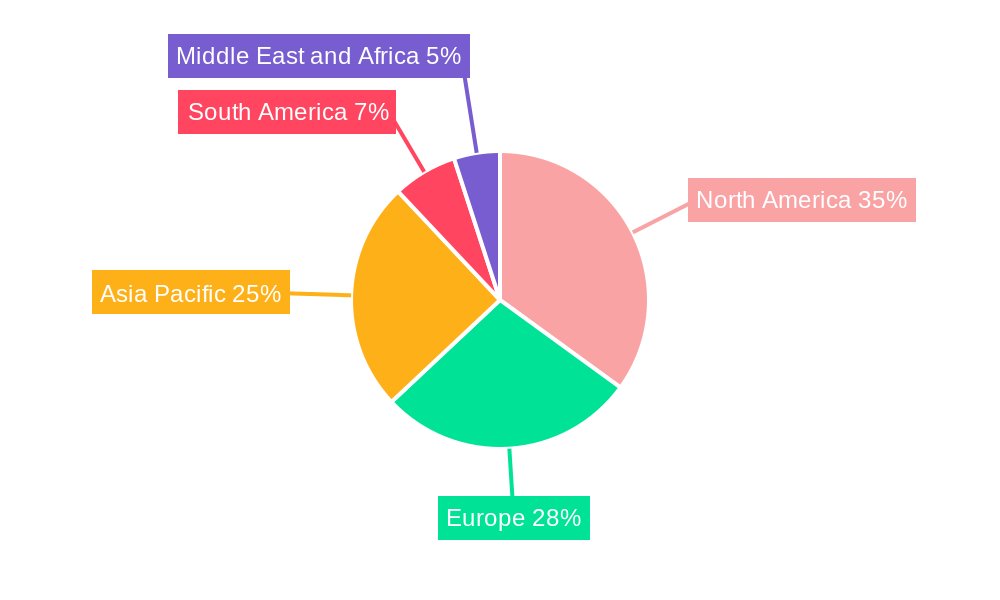
The market's geographic distribution reflects global health trends. North America and Europe currently hold significant market share, driven by high healthcare spending and early adoption of innovative sleep technologies. However, Asia Pacific is poised for rapid expansion, fueled by increasing disposable incomes, rising awareness of sleep health, and a large population base. While the market faces restraints such as high initial costs of some advanced technologies and data privacy concerns regarding the collection of sensitive sleep data, the overall market outlook remains overwhelmingly positive. Continued technological innovation, coupled with increased investment in sleep research and growing consumer awareness, will likely propel this sector's growth throughout the forecast period. The competitive landscape is marked by a mix of established players like Philips and emerging startups, each vying for market share through product innovation and strategic partnerships.
Sleep Tech Industry Market Report: 2019-2033
This comprehensive report provides an in-depth analysis of the global sleep tech industry, projecting a market valuation of $XX Million by 2033. The report covers market dynamics, key players, emerging trends, and future growth opportunities, offering invaluable insights for stakeholders, investors, and industry professionals. The study period spans 2019-2033, with a base year of 2025 and a forecast period of 2025-2033. This report is essential for understanding the rapidly evolving landscape of sleep technology and capitalizing on its immense potential.
Sleep Tech Industry Market Concentration & Dynamics
The sleep tech market exhibits a moderately concentrated structure, with a few dominant players holding significant market share. However, the presence of numerous smaller, innovative companies indicates a dynamic and competitive landscape. The market is fueled by continuous innovation in wearable and non-wearable sleep tracking technologies, coupled with growing consumer awareness of sleep health and its impact on overall well-being. Regulatory frameworks, particularly concerning data privacy and medical device approval, play a significant role. Substitute products, such as traditional sleep aids and therapies, pose a degree of competition, although the advanced analytics and personalized solutions offered by sleep tech are driving its adoption.
Key Metrics:
- Market Share: Top 5 players hold approximately XX% of the market share in 2025 (estimated).
- M&A Activity: An estimated XX M&A deals occurred in the sleep tech sector between 2019-2024.
End-user trends show increasing adoption across hospitals, homecare settings, and the broader consumer market. The rise of telehealth and remote patient monitoring is also boosting demand for sleep tech solutions within the healthcare sector. The increased focus on personalized medicine further contributes to the market's growth.
Sleep Tech Industry Insights & Trends
The global sleep tech market is experiencing robust growth, driven by increasing awareness of sleep disorders, technological advancements in sleep tracking and analysis, and a growing preference for personalized healthcare solutions. The market size was estimated at $XX Million in 2024 and is projected to reach $XX Million by 2033, exhibiting a Compound Annual Growth Rate (CAGR) of XX% during the forecast period. Technological disruptions, such as the development of AI-powered sleep analysis tools and the integration of sleep tech with other wearables, are significantly influencing market dynamics. Consumer behaviors are evolving towards proactive sleep management, with an increasing demand for data-driven insights and personalized interventions to improve sleep quality.
Key Markets & Segments Leading Sleep Tech Industry
The North American market currently dominates the sleep tech industry, driven by high consumer disposable income, advanced healthcare infrastructure, and strong regulatory support for medical device innovation. Within the product segment, wearables maintain a leading position, owing to their convenience, affordability, and growing feature sets. However, the non-wearable segment is witnessing significant growth, driven by the adoption of advanced sleep tracking technologies such as sleep sensors and smart beds.
Drivers of Dominance:
- North America: High per capita income, strong consumer awareness of health and wellness, and well-established healthcare infrastructure.
- Wearables Segment: Convenience, affordability, and the integration of various health tracking features.
- Hospitals & Homecare: Growing adoption of remote patient monitoring and the increasing need for effective sleep disorder management.
Detailed Analysis: The high adoption rate in North America is attributable to a combination of factors including greater awareness of sleep health, increased spending on healthcare, and the availability of sophisticated sleep monitoring technologies. In contrast, the Asia-Pacific region is experiencing rapid growth, driven by increasing disposable incomes and the rapid expansion of the healthcare sector.
Sleep Tech Industry Product Developments
Recent years have witnessed significant advancements in sleep technology, characterized by the integration of artificial intelligence (AI), machine learning (ML), and big data analytics. Products now offer more comprehensive sleep data analysis, personalized sleep improvement recommendations, and seamless integration with other health and fitness trackers. This sophistication provides users with actionable insights to enhance sleep quality and overall well-being, creating a competitive edge for manufacturers.
Challenges in the Sleep Tech Industry Market
The sleep tech market faces challenges including stringent regulatory approvals for medical devices, potential supply chain disruptions impacting component availability, and intense competition from established players and new entrants. These factors can impact product development timelines, manufacturing costs, and market penetration.
Forces Driving Sleep Tech Industry Growth
Technological advancements like AI-powered sleep analysis, coupled with increasing consumer awareness of sleep health and the rising prevalence of sleep disorders, are key growth drivers. Favorable regulatory environments in certain regions and economic growth, particularly in developing economies, are also contributing factors.
Challenges in the Sleep Tech Industry Market
Long-term growth will be driven by continued innovation in sleep technology, strategic partnerships between tech companies and healthcare providers, and expansion into new geographical markets with substantial unmet needs. The increasing integration of sleep tech with other healthcare solutions holds substantial growth potential.
Emerging Opportunities in Sleep Tech Industry
The market presents significant opportunities in personalized sleep solutions, leveraging AI and machine learning to create tailored interventions. Expansion into underserved markets, particularly in developing countries, and integration with telehealth platforms offer further growth prospects. New technologies such as brainwave monitoring and biofeedback offer avenues for further market innovation.
Leading Players in the Sleep Tech Industry Sector
- ?ura Health Oy
- Eight Sleep
- Compumedics Limited
- Koninklijke Philips N V
- Xiaomi
- Huawei Technologies Co Ltd
- Casper
- Sleep Shepherd LLC
- Nihon Kohden Corporation
- Sleepace
Key Milestones in Sleep Tech Industry Industry
- September 2022: Sleepme Inc. (ChiliSleep) launched Hiber-AI and a non-wearable sleep tracker, significantly advancing real-time sleep data analysis and intervention capabilities.
- May 2022: Huawei Vietnam launched three new smartwatches with enhanced sleep tracking and health alert features, expanding the reach of accessible sleep monitoring technology.
Strategic Outlook for Sleep Tech Industry Market
The sleep tech industry is poised for substantial growth, fueled by technological innovation and increasing consumer demand for personalized sleep solutions. Strategic partnerships, focused research and development, and expansion into new markets will be crucial for success in this dynamic sector. The integration of sleep data with other health metrics to provide a holistic view of individual well-being presents significant future opportunities.
Sleep Tech Industry Segmentation
-
1. Product
-
1.1. Wearables
- 1.1.1. Smart Watches and Bands
- 1.1.2. Other Wearable Products
-
1.2. Non-Wearables
- 1.2.1. Sleep Monitors
- 1.2.2. Beds
- 1.2.3. Other Non-Wearable Products
-
1.1. Wearables
-
2. End User
- 2.1. Hospitals
- 2.2. Homecare Settings
- 2.3. Other End Users
Sleep Tech Industry Segmentation By Geography
-
1. North America
- 1.1. United States
- 1.2. Canada
- 1.3. Mexico
-
2. Europe
- 2.1. Germany
- 2.2. United Kingdom
- 2.3. France
- 2.4. Italy
- 2.5. Spain
- 2.6. Rest of Europe
-
3. Asia Pacific
- 3.1. China
- 3.2. Japan
- 3.3. India
- 3.4. Australia
- 3.5. South Korea
- 3.6. Rest of Asia Pacific
-
4. Middle East and Africa
- 4.1. GCC
- 4.2. South Africa
- 4.3. Rest of Middle East and Africa
-
5. South America
- 5.1. Brazil
- 5.2. Argentina
- 5.3. Rest of South America
Sleep Tech Industry REPORT HIGHLIGHTS
| Aspects | Details |
|---|---|
| Study Period | 2019-2033 |
| Base Year | 2024 |
| Estimated Year | 2025 |
| Forecast Period | 2025-2033 |
| Historical Period | 2019-2024 |
| Growth Rate | CAGR of 16.80% from 2019-2033 |
| Segmentation |
|
Table of Contents
- 1. Introduction
- 1.1. Research Scope
- 1.2. Market Segmentation
- 1.3. Research Methodology
- 1.4. Definitions and Assumptions
- 2. Executive Summary
- 2.1. Introduction
- 3. Market Dynamics
- 3.1. Introduction
- 3.2. Market Drivers
- 3.2.1. Increasing Prevalence of Sleep Disorders; Technological Advancements
- 3.3. Market Restrains
- 3.3.1. High Cost of Sleep Tech Devices
- 3.4. Market Trends
- 3.4.1. Smart Watches and Bands Segment is Expected to Hold a Significant Share of the Sleep Tech Devices Market Over the Forecast Period
- 4. Market Factor Analysis
- 4.1. Porters Five Forces
- 4.2. Supply/Value Chain
- 4.3. PESTEL analysis
- 4.4. Market Entropy
- 4.5. Patent/Trademark Analysis
- 5. Global Sleep Tech Industry Analysis, Insights and Forecast, 2019-2031
- 5.1. Market Analysis, Insights and Forecast - by Product
- 5.1.1. Wearables
- 5.1.1.1. Smart Watches and Bands
- 5.1.1.2. Other Wearable Products
- 5.1.2. Non-Wearables
- 5.1.2.1. Sleep Monitors
- 5.1.2.2. Beds
- 5.1.2.3. Other Non-Wearable Products
- 5.1.1. Wearables
- 5.2. Market Analysis, Insights and Forecast - by End User
- 5.2.1. Hospitals
- 5.2.2. Homecare Settings
- 5.2.3. Other End Users
- 5.3. Market Analysis, Insights and Forecast - by Region
- 5.3.1. North America
- 5.3.2. Europe
- 5.3.3. Asia Pacific
- 5.3.4. Middle East and Africa
- 5.3.5. South America
- 5.1. Market Analysis, Insights and Forecast - by Product
- 6. North America Sleep Tech Industry Analysis, Insights and Forecast, 2019-2031
- 6.1. Market Analysis, Insights and Forecast - by Product
- 6.1.1. Wearables
- 6.1.1.1. Smart Watches and Bands
- 6.1.1.2. Other Wearable Products
- 6.1.2. Non-Wearables
- 6.1.2.1. Sleep Monitors
- 6.1.2.2. Beds
- 6.1.2.3. Other Non-Wearable Products
- 6.1.1. Wearables
- 6.2. Market Analysis, Insights and Forecast - by End User
- 6.2.1. Hospitals
- 6.2.2. Homecare Settings
- 6.2.3. Other End Users
- 6.1. Market Analysis, Insights and Forecast - by Product
- 7. Europe Sleep Tech Industry Analysis, Insights and Forecast, 2019-2031
- 7.1. Market Analysis, Insights and Forecast - by Product
- 7.1.1. Wearables
- 7.1.1.1. Smart Watches and Bands
- 7.1.1.2. Other Wearable Products
- 7.1.2. Non-Wearables
- 7.1.2.1. Sleep Monitors
- 7.1.2.2. Beds
- 7.1.2.3. Other Non-Wearable Products
- 7.1.1. Wearables
- 7.2. Market Analysis, Insights and Forecast - by End User
- 7.2.1. Hospitals
- 7.2.2. Homecare Settings
- 7.2.3. Other End Users
- 7.1. Market Analysis, Insights and Forecast - by Product
- 8. Asia Pacific Sleep Tech Industry Analysis, Insights and Forecast, 2019-2031
- 8.1. Market Analysis, Insights and Forecast - by Product
- 8.1.1. Wearables
- 8.1.1.1. Smart Watches and Bands
- 8.1.1.2. Other Wearable Products
- 8.1.2. Non-Wearables
- 8.1.2.1. Sleep Monitors
- 8.1.2.2. Beds
- 8.1.2.3. Other Non-Wearable Products
- 8.1.1. Wearables
- 8.2. Market Analysis, Insights and Forecast - by End User
- 8.2.1. Hospitals
- 8.2.2. Homecare Settings
- 8.2.3. Other End Users
- 8.1. Market Analysis, Insights and Forecast - by Product
- 9. Middle East and Africa Sleep Tech Industry Analysis, Insights and Forecast, 2019-2031
- 9.1. Market Analysis, Insights and Forecast - by Product
- 9.1.1. Wearables
- 9.1.1.1. Smart Watches and Bands
- 9.1.1.2. Other Wearable Products
- 9.1.2. Non-Wearables
- 9.1.2.1. Sleep Monitors
- 9.1.2.2. Beds
- 9.1.2.3. Other Non-Wearable Products
- 9.1.1. Wearables
- 9.2. Market Analysis, Insights and Forecast - by End User
- 9.2.1. Hospitals
- 9.2.2. Homecare Settings
- 9.2.3. Other End Users
- 9.1. Market Analysis, Insights and Forecast - by Product
- 10. South America Sleep Tech Industry Analysis, Insights and Forecast, 2019-2031
- 10.1. Market Analysis, Insights and Forecast - by Product
- 10.1.1. Wearables
- 10.1.1.1. Smart Watches and Bands
- 10.1.1.2. Other Wearable Products
- 10.1.2. Non-Wearables
- 10.1.2.1. Sleep Monitors
- 10.1.2.2. Beds
- 10.1.2.3. Other Non-Wearable Products
- 10.1.1. Wearables
- 10.2. Market Analysis, Insights and Forecast - by End User
- 10.2.1. Hospitals
- 10.2.2. Homecare Settings
- 10.2.3. Other End Users
- 10.1. Market Analysis, Insights and Forecast - by Product
- 11. North America Sleep Tech Industry Analysis, Insights and Forecast, 2019-2031
- 11.1. Market Analysis, Insights and Forecast - By Country/Sub-region
- 11.1.1 United States
- 11.1.2 Canada
- 11.1.3 Mexico
- 12. Europe Sleep Tech Industry Analysis, Insights and Forecast, 2019-2031
- 12.1. Market Analysis, Insights and Forecast - By Country/Sub-region
- 12.1.1 Germany
- 12.1.2 United Kingdom
- 12.1.3 France
- 12.1.4 Italy
- 12.1.5 Spain
- 12.1.6 Rest of Europe
- 13. Asia Pacific Sleep Tech Industry Analysis, Insights and Forecast, 2019-2031
- 13.1. Market Analysis, Insights and Forecast - By Country/Sub-region
- 13.1.1 China
- 13.1.2 Japan
- 13.1.3 India
- 13.1.4 Australia
- 13.1.5 South Korea
- 13.1.6 Rest of Asia Pacific
- 14. South America Sleep Tech Industry Analysis, Insights and Forecast, 2019-2031
- 14.1. Market Analysis, Insights and Forecast - By Country/Sub-region
- 14.1.1 Brazil
- 14.1.2 Argentina
- 14.1.3 Rest of South America
- 15. Middle East and Africa Sleep Tech Industry Analysis, Insights and Forecast, 2019-2031
- 15.1. Market Analysis, Insights and Forecast - By Country/Sub-region
- 15.1.1 GCC
- 15.1.2 South Africa
- 15.1.3 Rest of Middle East and Africa
- 16. Competitive Analysis
- 16.1. Global Market Share Analysis 2024
- 16.2. Company Profiles
- 16.2.1 ?ura Health Oy
- 16.2.1.1. Overview
- 16.2.1.2. Products
- 16.2.1.3. SWOT Analysis
- 16.2.1.4. Recent Developments
- 16.2.1.5. Financials (Based on Availability)
- 16.2.2 Eight Sleep
- 16.2.2.1. Overview
- 16.2.2.2. Products
- 16.2.2.3. SWOT Analysis
- 16.2.2.4. Recent Developments
- 16.2.2.5. Financials (Based on Availability)
- 16.2.3 Compumedics Limited
- 16.2.3.1. Overview
- 16.2.3.2. Products
- 16.2.3.3. SWOT Analysis
- 16.2.3.4. Recent Developments
- 16.2.3.5. Financials (Based on Availability)
- 16.2.4 Koninklijke Philips N V
- 16.2.4.1. Overview
- 16.2.4.2. Products
- 16.2.4.3. SWOT Analysis
- 16.2.4.4. Recent Developments
- 16.2.4.5. Financials (Based on Availability)
- 16.2.5 Xiaomi
- 16.2.5.1. Overview
- 16.2.5.2. Products
- 16.2.5.3. SWOT Analysis
- 16.2.5.4. Recent Developments
- 16.2.5.5. Financials (Based on Availability)
- 16.2.6 Huawei Technologies Co Ltd
- 16.2.6.1. Overview
- 16.2.6.2. Products
- 16.2.6.3. SWOT Analysis
- 16.2.6.4. Recent Developments
- 16.2.6.5. Financials (Based on Availability)
- 16.2.7 Casper
- 16.2.7.1. Overview
- 16.2.7.2. Products
- 16.2.7.3. SWOT Analysis
- 16.2.7.4. Recent Developments
- 16.2.7.5. Financials (Based on Availability)
- 16.2.8 Sleep Shepherd LLC
- 16.2.8.1. Overview
- 16.2.8.2. Products
- 16.2.8.3. SWOT Analysis
- 16.2.8.4. Recent Developments
- 16.2.8.5. Financials (Based on Availability)
- 16.2.9 Nihon Kohden Corporation
- 16.2.9.1. Overview
- 16.2.9.2. Products
- 16.2.9.3. SWOT Analysis
- 16.2.9.4. Recent Developments
- 16.2.9.5. Financials (Based on Availability)
- 16.2.10 Sleepace
- 16.2.10.1. Overview
- 16.2.10.2. Products
- 16.2.10.3. SWOT Analysis
- 16.2.10.4. Recent Developments
- 16.2.10.5. Financials (Based on Availability)
- 16.2.1 ?ura Health Oy
List of Figures
- Figure 1: Global Sleep Tech Industry Revenue Breakdown (Million, %) by Region 2024 & 2032
- Figure 2: North America Sleep Tech Industry Revenue (Million), by Country 2024 & 2032
- Figure 3: North America Sleep Tech Industry Revenue Share (%), by Country 2024 & 2032
- Figure 4: Europe Sleep Tech Industry Revenue (Million), by Country 2024 & 2032
- Figure 5: Europe Sleep Tech Industry Revenue Share (%), by Country 2024 & 2032
- Figure 6: Asia Pacific Sleep Tech Industry Revenue (Million), by Country 2024 & 2032
- Figure 7: Asia Pacific Sleep Tech Industry Revenue Share (%), by Country 2024 & 2032
- Figure 8: South America Sleep Tech Industry Revenue (Million), by Country 2024 & 2032
- Figure 9: South America Sleep Tech Industry Revenue Share (%), by Country 2024 & 2032
- Figure 10: Middle East and Africa Sleep Tech Industry Revenue (Million), by Country 2024 & 2032
- Figure 11: Middle East and Africa Sleep Tech Industry Revenue Share (%), by Country 2024 & 2032
- Figure 12: North America Sleep Tech Industry Revenue (Million), by Product 2024 & 2032
- Figure 13: North America Sleep Tech Industry Revenue Share (%), by Product 2024 & 2032
- Figure 14: North America Sleep Tech Industry Revenue (Million), by End User 2024 & 2032
- Figure 15: North America Sleep Tech Industry Revenue Share (%), by End User 2024 & 2032
- Figure 16: North America Sleep Tech Industry Revenue (Million), by Country 2024 & 2032
- Figure 17: North America Sleep Tech Industry Revenue Share (%), by Country 2024 & 2032
- Figure 18: Europe Sleep Tech Industry Revenue (Million), by Product 2024 & 2032
- Figure 19: Europe Sleep Tech Industry Revenue Share (%), by Product 2024 & 2032
- Figure 20: Europe Sleep Tech Industry Revenue (Million), by End User 2024 & 2032
- Figure 21: Europe Sleep Tech Industry Revenue Share (%), by End User 2024 & 2032
- Figure 22: Europe Sleep Tech Industry Revenue (Million), by Country 2024 & 2032
- Figure 23: Europe Sleep Tech Industry Revenue Share (%), by Country 2024 & 2032
- Figure 24: Asia Pacific Sleep Tech Industry Revenue (Million), by Product 2024 & 2032
- Figure 25: Asia Pacific Sleep Tech Industry Revenue Share (%), by Product 2024 & 2032
- Figure 26: Asia Pacific Sleep Tech Industry Revenue (Million), by End User 2024 & 2032
- Figure 27: Asia Pacific Sleep Tech Industry Revenue Share (%), by End User 2024 & 2032
- Figure 28: Asia Pacific Sleep Tech Industry Revenue (Million), by Country 2024 & 2032
- Figure 29: Asia Pacific Sleep Tech Industry Revenue Share (%), by Country 2024 & 2032
- Figure 30: Middle East and Africa Sleep Tech Industry Revenue (Million), by Product 2024 & 2032
- Figure 31: Middle East and Africa Sleep Tech Industry Revenue Share (%), by Product 2024 & 2032
- Figure 32: Middle East and Africa Sleep Tech Industry Revenue (Million), by End User 2024 & 2032
- Figure 33: Middle East and Africa Sleep Tech Industry Revenue Share (%), by End User 2024 & 2032
- Figure 34: Middle East and Africa Sleep Tech Industry Revenue (Million), by Country 2024 & 2032
- Figure 35: Middle East and Africa Sleep Tech Industry Revenue Share (%), by Country 2024 & 2032
- Figure 36: South America Sleep Tech Industry Revenue (Million), by Product 2024 & 2032
- Figure 37: South America Sleep Tech Industry Revenue Share (%), by Product 2024 & 2032
- Figure 38: South America Sleep Tech Industry Revenue (Million), by End User 2024 & 2032
- Figure 39: South America Sleep Tech Industry Revenue Share (%), by End User 2024 & 2032
- Figure 40: South America Sleep Tech Industry Revenue (Million), by Country 2024 & 2032
- Figure 41: South America Sleep Tech Industry Revenue Share (%), by Country 2024 & 2032
List of Tables
- Table 1: Global Sleep Tech Industry Revenue Million Forecast, by Region 2019 & 2032
- Table 2: Global Sleep Tech Industry Revenue Million Forecast, by Product 2019 & 2032
- Table 3: Global Sleep Tech Industry Revenue Million Forecast, by End User 2019 & 2032
- Table 4: Global Sleep Tech Industry Revenue Million Forecast, by Region 2019 & 2032
- Table 5: Global Sleep Tech Industry Revenue Million Forecast, by Country 2019 & 2032
- Table 6: United States Sleep Tech Industry Revenue (Million) Forecast, by Application 2019 & 2032
- Table 7: Canada Sleep Tech Industry Revenue (Million) Forecast, by Application 2019 & 2032
- Table 8: Mexico Sleep Tech Industry Revenue (Million) Forecast, by Application 2019 & 2032
- Table 9: Global Sleep Tech Industry Revenue Million Forecast, by Country 2019 & 2032
- Table 10: Germany Sleep Tech Industry Revenue (Million) Forecast, by Application 2019 & 2032
- Table 11: United Kingdom Sleep Tech Industry Revenue (Million) Forecast, by Application 2019 & 2032
- Table 12: France Sleep Tech Industry Revenue (Million) Forecast, by Application 2019 & 2032
- Table 13: Italy Sleep Tech Industry Revenue (Million) Forecast, by Application 2019 & 2032
- Table 14: Spain Sleep Tech Industry Revenue (Million) Forecast, by Application 2019 & 2032
- Table 15: Rest of Europe Sleep Tech Industry Revenue (Million) Forecast, by Application 2019 & 2032
- Table 16: Global Sleep Tech Industry Revenue Million Forecast, by Country 2019 & 2032
- Table 17: China Sleep Tech Industry Revenue (Million) Forecast, by Application 2019 & 2032
- Table 18: Japan Sleep Tech Industry Revenue (Million) Forecast, by Application 2019 & 2032
- Table 19: India Sleep Tech Industry Revenue (Million) Forecast, by Application 2019 & 2032
- Table 20: Australia Sleep Tech Industry Revenue (Million) Forecast, by Application 2019 & 2032
- Table 21: South Korea Sleep Tech Industry Revenue (Million) Forecast, by Application 2019 & 2032
- Table 22: Rest of Asia Pacific Sleep Tech Industry Revenue (Million) Forecast, by Application 2019 & 2032
- Table 23: Global Sleep Tech Industry Revenue Million Forecast, by Country 2019 & 2032
- Table 24: Brazil Sleep Tech Industry Revenue (Million) Forecast, by Application 2019 & 2032
- Table 25: Argentina Sleep Tech Industry Revenue (Million) Forecast, by Application 2019 & 2032
- Table 26: Rest of South America Sleep Tech Industry Revenue (Million) Forecast, by Application 2019 & 2032
- Table 27: Global Sleep Tech Industry Revenue Million Forecast, by Country 2019 & 2032
- Table 28: GCC Sleep Tech Industry Revenue (Million) Forecast, by Application 2019 & 2032
- Table 29: South Africa Sleep Tech Industry Revenue (Million) Forecast, by Application 2019 & 2032
- Table 30: Rest of Middle East and Africa Sleep Tech Industry Revenue (Million) Forecast, by Application 2019 & 2032
- Table 31: Global Sleep Tech Industry Revenue Million Forecast, by Product 2019 & 2032
- Table 32: Global Sleep Tech Industry Revenue Million Forecast, by End User 2019 & 2032
- Table 33: Global Sleep Tech Industry Revenue Million Forecast, by Country 2019 & 2032
- Table 34: United States Sleep Tech Industry Revenue (Million) Forecast, by Application 2019 & 2032
- Table 35: Canada Sleep Tech Industry Revenue (Million) Forecast, by Application 2019 & 2032
- Table 36: Mexico Sleep Tech Industry Revenue (Million) Forecast, by Application 2019 & 2032
- Table 37: Global Sleep Tech Industry Revenue Million Forecast, by Product 2019 & 2032
- Table 38: Global Sleep Tech Industry Revenue Million Forecast, by End User 2019 & 2032
- Table 39: Global Sleep Tech Industry Revenue Million Forecast, by Country 2019 & 2032
- Table 40: Germany Sleep Tech Industry Revenue (Million) Forecast, by Application 2019 & 2032
- Table 41: United Kingdom Sleep Tech Industry Revenue (Million) Forecast, by Application 2019 & 2032
- Table 42: France Sleep Tech Industry Revenue (Million) Forecast, by Application 2019 & 2032
- Table 43: Italy Sleep Tech Industry Revenue (Million) Forecast, by Application 2019 & 2032
- Table 44: Spain Sleep Tech Industry Revenue (Million) Forecast, by Application 2019 & 2032
- Table 45: Rest of Europe Sleep Tech Industry Revenue (Million) Forecast, by Application 2019 & 2032
- Table 46: Global Sleep Tech Industry Revenue Million Forecast, by Product 2019 & 2032
- Table 47: Global Sleep Tech Industry Revenue Million Forecast, by End User 2019 & 2032
- Table 48: Global Sleep Tech Industry Revenue Million Forecast, by Country 2019 & 2032
- Table 49: China Sleep Tech Industry Revenue (Million) Forecast, by Application 2019 & 2032
- Table 50: Japan Sleep Tech Industry Revenue (Million) Forecast, by Application 2019 & 2032
- Table 51: India Sleep Tech Industry Revenue (Million) Forecast, by Application 2019 & 2032
- Table 52: Australia Sleep Tech Industry Revenue (Million) Forecast, by Application 2019 & 2032
- Table 53: South Korea Sleep Tech Industry Revenue (Million) Forecast, by Application 2019 & 2032
- Table 54: Rest of Asia Pacific Sleep Tech Industry Revenue (Million) Forecast, by Application 2019 & 2032
- Table 55: Global Sleep Tech Industry Revenue Million Forecast, by Product 2019 & 2032
- Table 56: Global Sleep Tech Industry Revenue Million Forecast, by End User 2019 & 2032
- Table 57: Global Sleep Tech Industry Revenue Million Forecast, by Country 2019 & 2032
- Table 58: GCC Sleep Tech Industry Revenue (Million) Forecast, by Application 2019 & 2032
- Table 59: South Africa Sleep Tech Industry Revenue (Million) Forecast, by Application 2019 & 2032
- Table 60: Rest of Middle East and Africa Sleep Tech Industry Revenue (Million) Forecast, by Application 2019 & 2032
- Table 61: Global Sleep Tech Industry Revenue Million Forecast, by Product 2019 & 2032
- Table 62: Global Sleep Tech Industry Revenue Million Forecast, by End User 2019 & 2032
- Table 63: Global Sleep Tech Industry Revenue Million Forecast, by Country 2019 & 2032
- Table 64: Brazil Sleep Tech Industry Revenue (Million) Forecast, by Application 2019 & 2032
- Table 65: Argentina Sleep Tech Industry Revenue (Million) Forecast, by Application 2019 & 2032
- Table 66: Rest of South America Sleep Tech Industry Revenue (Million) Forecast, by Application 2019 & 2032
Frequently Asked Questions
1. What is the projected Compound Annual Growth Rate (CAGR) of the Sleep Tech Industry?
The projected CAGR is approximately 16.80%.
2. Which companies are prominent players in the Sleep Tech Industry?
Key companies in the market include ?ura Health Oy, Eight Sleep, Compumedics Limited, Koninklijke Philips N V, Xiaomi, Huawei Technologies Co Ltd, Casper, Sleep Shepherd LLC, Nihon Kohden Corporation, Sleepace.
3. What are the main segments of the Sleep Tech Industry?
The market segments include Product, End User.
4. Can you provide details about the market size?
The market size is estimated to be USD XX Million as of 2022.
5. What are some drivers contributing to market growth?
Increasing Prevalence of Sleep Disorders; Technological Advancements.
6. What are the notable trends driving market growth?
Smart Watches and Bands Segment is Expected to Hold a Significant Share of the Sleep Tech Devices Market Over the Forecast Period.
7. Are there any restraints impacting market growth?
High Cost of Sleep Tech Devices.
8. Can you provide examples of recent developments in the market?
Sept 2022: Sleepme Inc., the parent company of ChiliSleep, released its first-of-its-kind technology, Hiber-AI, along with a non-wearable sleep tracker that collects, analyzes, and acts on sleep data in real-time. Both are part of the new sleepme+ membership.
9. What pricing options are available for accessing the report?
Pricing options include single-user, multi-user, and enterprise licenses priced at USD 4750, USD 5250, and USD 8750 respectively.
10. Is the market size provided in terms of value or volume?
The market size is provided in terms of value, measured in Million.
11. Are there any specific market keywords associated with the report?
Yes, the market keyword associated with the report is "Sleep Tech Industry," which aids in identifying and referencing the specific market segment covered.
12. How do I determine which pricing option suits my needs best?
The pricing options vary based on user requirements and access needs. Individual users may opt for single-user licenses, while businesses requiring broader access may choose multi-user or enterprise licenses for cost-effective access to the report.
13. Are there any additional resources or data provided in the Sleep Tech Industry report?
While the report offers comprehensive insights, it's advisable to review the specific contents or supplementary materials provided to ascertain if additional resources or data are available.
14. How can I stay updated on further developments or reports in the Sleep Tech Industry?
To stay informed about further developments, trends, and reports in the Sleep Tech Industry, consider subscribing to industry newsletters, following relevant companies and organizations, or regularly checking reputable industry news sources and publications.
Methodology
Step 1 - Identification of Relevant Samples Size from Population Database


Step 2 - Approaches for Defining Global Market Size (Value, Volume* & Price*)

Note*: In applicable scenarios
Step 3 - Data Sources
Primary Research
- Web Analytics
- Survey Reports
- Research Institute
- Latest Research Reports
- Opinion Leaders
Secondary Research
- Annual Reports
- White Paper
- Latest Press Release
- Industry Association
- Paid Database
- Investor Presentations

Step 4 - Data Triangulation
Involves using different sources of information in order to increase the validity of a study
These sources are likely to be stakeholders in a program - participants, other researchers, program staff, other community members, and so on.
Then we put all data in single framework & apply various statistical tools to find out the dynamic on the market.
During the analysis stage, feedback from the stakeholder groups would be compared to determine areas of agreement as well as areas of divergence
