

Key Insights
The global smart cities market is experiencing robust growth, projected to reach a substantial size driven by increasing urbanization, the need for improved infrastructure, and the rising adoption of advanced technologies. The market's Compound Annual Growth Rate (CAGR) of 23.21% from 2019 to 2024 indicates a significant upward trajectory. Key drivers include the escalating demand for enhanced public safety measures (e.g., improved surveillance and emergency response systems), the need for efficient traffic management and sustainable transportation solutions (smart mobility), and the growing adoption of smart technologies in healthcare and education to improve service delivery and citizen well-being. Furthermore, the increasing focus on energy efficiency and sustainable resource management is fueling the growth of smart utilities solutions within smart cities. While challenges like high initial investment costs and cybersecurity concerns exist, the long-term benefits of improved efficiency, reduced operational costs, and enhanced citizen engagement are mitigating these restraints. The market is segmented into several key areas, including smart mobility management, public safety, healthcare, building management, utilities, security, and education. North America and Europe currently hold significant market shares due to advanced technological infrastructure and substantial investments. However, rapid growth is anticipated in the Asia-Pacific region, driven by the increasing urbanization rate and government initiatives promoting smart city development in countries like China and India.
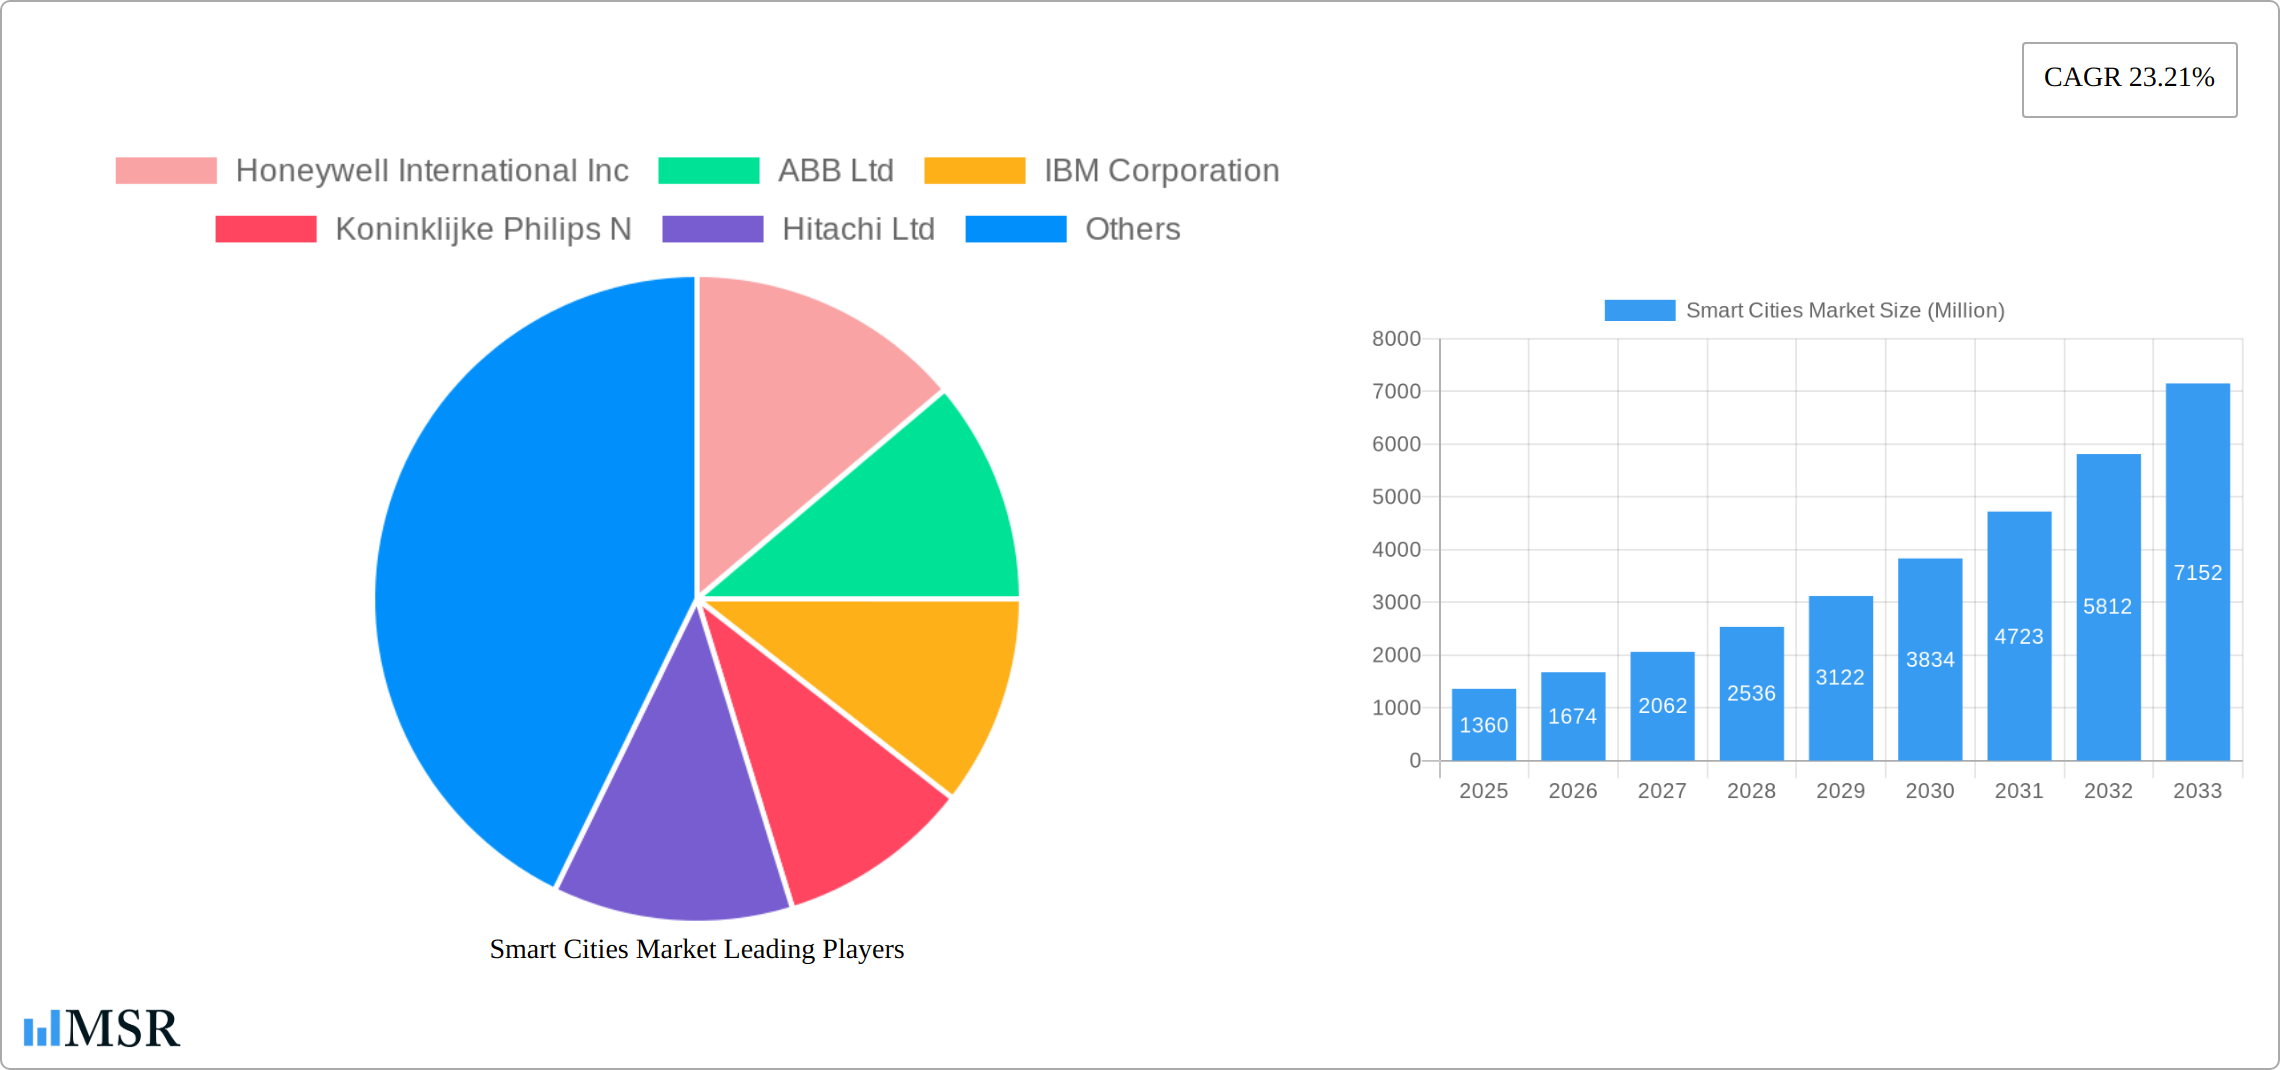
The competitive landscape is characterized by the presence of major technology companies and industry leaders such as Honeywell, ABB, IBM, Philips, Hitachi, and Cisco, among others. These companies are actively involved in developing and deploying smart city solutions, often collaborating with local governments and municipalities. The forecast period (2025-2033) anticipates sustained growth, with smart mobility and smart public safety segments expected to be major contributors. Strategic partnerships, technological advancements, and government support will play a crucial role in shaping the future of the smart cities market. Continuous innovation in areas such as IoT (Internet of Things), AI (Artificial Intelligence), and big data analytics will further enhance the capabilities of smart city solutions, driving market expansion in the coming years. The market's evolution is expected to be marked by increased integration of different smart city systems and a stronger focus on data-driven decision-making for improved urban planning and management.
Smart Cities Market Report: 2019-2033 Forecast
This comprehensive report provides an in-depth analysis of the global Smart Cities Market, offering invaluable insights for industry stakeholders, investors, and strategic decision-makers. With a study period spanning 2019-2033, a base year of 2025, and a forecast period of 2025-2033, this report unveils the market's trajectory and presents actionable strategies for success. The market is projected to reach xx Million by 2033, exhibiting a CAGR of xx%.
Smart Cities Market Concentration & Dynamics
The Smart Cities Market is characterized by a moderately concentrated landscape, with several key players holding significant market share. The market share of the top 5 players is estimated at xx%. However, the market is also witnessing increased participation from smaller, specialized firms driving innovation. The competitive landscape is dynamic, shaped by factors like M&A activities, technological advancements, and evolving regulatory frameworks. Between 2019 and 2024, the market saw approximately xx M&A deals, indicating a strong appetite for consolidation and expansion.
- Market Concentration: Top 5 players hold xx% market share.
- Innovation Ecosystems: Robust innovation in areas like IoT, AI, and Big Data analytics fuels market growth.
- Regulatory Frameworks: Government initiatives and smart city projects significantly impact market adoption.
- Substitute Products: Limited direct substitutes exist, but alternative solutions pose indirect competition.
- End-User Trends: Growing urbanization and demand for improved urban infrastructure drive market demand.
- M&A Activities: High number of mergers and acquisitions demonstrate market consolidation and expansion strategies.
Smart Cities Market Industry Insights & Trends
The Smart Cities Market is experiencing robust growth, driven by increasing urbanization, the need for enhanced infrastructure, and the adoption of innovative technologies. The global market size was valued at xx Million in 2024 and is projected to reach xx Million by 2033, exhibiting a compelling CAGR of xx%. Key growth drivers include government investments in smart city initiatives, technological advancements in IoT, AI, and big data analytics, and rising concerns about environmental sustainability and public safety. Changing consumer behaviors, such as increased reliance on digital technologies and demand for personalized services, further fuel market expansion. However, challenges such as high initial investment costs, cybersecurity concerns, and interoperability issues need addressing.

Key Markets & Segments Leading Smart Cities Market
North America currently holds the dominant position in the Smart Cities Market, followed by Europe and Asia Pacific. Within the solutions segment, Smart Mobility Management holds the largest market share, driven by the increasing need for efficient traffic management and public transportation systems. Other rapidly growing segments include Smart Utilities, Smart Security, and Smart Building.
- Dominant Region: North America
- Leading Segment: Smart Mobility Management
- Drivers for Smart Mobility Management:
- Growing urban population and traffic congestion.
- Government initiatives promoting sustainable transportation.
- Advancements in autonomous vehicles and intelligent transportation systems.
- Drivers for Smart Utilities:
- Increasing energy demands and focus on renewable energy sources.
- Need for efficient water management and waste disposal systems.
- Smart grid technologies improving energy efficiency and distribution.
Smart Cities Market Product Developments
The Smart Cities Market witnesses continuous product innovations, focusing on enhancing efficiency, scalability, and security. New product developments emphasize seamless integration of IoT devices, AI-powered analytics, and advanced data security features. This focus on integration and improved security is key to maintaining a competitive edge.
Challenges in the Smart Cities Market Market
The Smart Cities Market faces challenges including high initial investment costs, complexities in data integration and interoperability, cybersecurity vulnerabilities, and the need for skilled professionals. These factors can hinder market adoption and growth, particularly in developing economies. Furthermore, evolving regulatory landscapes and stringent data privacy regulations can present significant barriers. Lack of standardized protocols can also create interoperability issues between different systems.
Forces Driving Smart Cities Market Growth
Several factors drive the Smart Cities Market's growth. Technological advancements, particularly in IoT, AI, and Big Data, enable the creation of intelligent and efficient urban systems. Government initiatives and funding for smart city projects play a crucial role in market expansion. Growing urbanization and the need for improved infrastructure in rapidly expanding cities further boost market demand.
Long-Term Growth Catalysts in Smart Cities Market
Long-term growth in the Smart Cities Market will be fueled by continued technological innovation, strategic partnerships between technology providers and city governments, and expansion into emerging markets. The increasing adoption of cloud-based solutions and the development of more resilient and sustainable infrastructure will also contribute to long-term growth.
Emerging Opportunities in Smart Cities Market
Emerging opportunities include the integration of blockchain technology for secure data management, the development of more sophisticated AI-powered predictive analytics for urban planning, and the expansion of smart city initiatives into rural areas. There's significant potential in the integration of 5G networks to support the increasing number of connected devices within smart cities.
Leading Players in the Smart Cities Market Sector
- Honeywell International Inc
- ABB Ltd
- IBM Corporation
- Koninklijke Philips N
- Hitachi Ltd
- Emerson Electric Co
- Cisco Systems Inc
- Siemens AG
- General Electric Co
- Schneider Electric SE
- Ericsson Inc
- Huawei Technologies Co Ltd
- Nokia Corporation
Key Milestones in Smart Cities Market Industry
- June 2023: TIM and Ericsson announced increased investment in private networks and IoT projects in Brazil, including a smart lighting project in Porto Alegre.
- November 2022: Emerson Electric Co. sold its InSinkErator business to Whirlpool Corporation for USD 3 Billion.
Strategic Outlook for Smart Cities Market Market
The Smart Cities Market holds immense potential for future growth, driven by ongoing technological advancements, increasing government support, and the growing need for sustainable and efficient urban solutions. Strategic partnerships and investments in innovative technologies will be critical for companies to capitalize on the significant opportunities within this rapidly evolving market.
Smart Cities Market Segmentation
-
1. Solution
- 1.1. Smart Mobility Management
- 1.2. Smart Public Safety
- 1.3. Smart Healthcare
- 1.4. Smart Building
- 1.5. Smart Utilities
- 1.6. Smart Security
- 1.7. Smart Education
- 1.8. Other Solutions
Smart Cities Market Segmentation By Geography
-
1. North America
- 1.1. United States
- 1.2. Canada
-
2. Europe
- 2.1. United Kingdom
- 2.2. Germany
- 2.3. France
- 2.4. Sweden
- 2.5. Rest of Europe
-
3. Asia Pacific
- 3.1. China
- 3.2. Japan
- 3.3. India
- 3.4. Australia
- 3.5. South Korea
- 3.6. Rest of Asia Pacific
-
4. Latin America
- 4.1. Mexico
- 4.2. Brazil
- 4.3. Argentina
- 4.4. Rest of Latin America
-
5. Middle East and Africa
- 5.1. Saudi Arabia
- 5.2. United Arab Emirates
- 5.3. South Africa
- 5.4. Rest of Middle East and Africa

Smart Cities Market REPORT HIGHLIGHTS
| Aspects | Details |
|---|---|
| Study Period | 2019-2033 |
| Base Year | 2024 |
| Estimated Year | 2025 |
| Forecast Period | 2025-2033 |
| Historical Period | 2019-2024 |
| Growth Rate | CAGR of 23.21% from 2019-2033 |
| Segmentation |
|
Table of Contents
- 1. Introduction
- 1.1. Research Scope
- 1.2. Market Segmentation
- 1.3. Research Methodology
- 1.4. Definitions and Assumptions
- 2. Executive Summary
- 2.1. Introduction
- 3. Market Dynamics
- 3.1. Introduction
- 3.2. Market Drivers
- 3.2.1. Rising Adoption of AI and IoT; Growth in the need for public safety and security
- 3.3. Market Restrains
- 3.3.1. The high cost of safety connection devices; Lack of awareness about its developments in the industry
- 3.4. Market Trends
- 3.4.1. Adoption of AI and IoT to be Major Drivers for the Market
- 4. Market Factor Analysis
- 4.1. Porters Five Forces
- 4.2. Supply/Value Chain
- 4.3. PESTEL analysis
- 4.4. Market Entropy
- 4.5. Patent/Trademark Analysis
- 5. Global Smart Cities Market Analysis, Insights and Forecast, 2019-2031
- 5.1. Market Analysis, Insights and Forecast - by Solution
- 5.1.1. Smart Mobility Management
- 5.1.2. Smart Public Safety
- 5.1.3. Smart Healthcare
- 5.1.4. Smart Building
- 5.1.5. Smart Utilities
- 5.1.6. Smart Security
- 5.1.7. Smart Education
- 5.1.8. Other Solutions
- 5.2. Market Analysis, Insights and Forecast - by Region
- 5.2.1. North America
- 5.2.2. Europe
- 5.2.3. Asia Pacific
- 5.2.4. Latin America
- 5.2.5. Middle East and Africa
- 5.1. Market Analysis, Insights and Forecast - by Solution
- 6. North America Smart Cities Market Analysis, Insights and Forecast, 2019-2031
- 6.1. Market Analysis, Insights and Forecast - by Solution
- 6.1.1. Smart Mobility Management
- 6.1.2. Smart Public Safety
- 6.1.3. Smart Healthcare
- 6.1.4. Smart Building
- 6.1.5. Smart Utilities
- 6.1.6. Smart Security
- 6.1.7. Smart Education
- 6.1.8. Other Solutions
- 6.1. Market Analysis, Insights and Forecast - by Solution
- 7. Europe Smart Cities Market Analysis, Insights and Forecast, 2019-2031
- 7.1. Market Analysis, Insights and Forecast - by Solution
- 7.1.1. Smart Mobility Management
- 7.1.2. Smart Public Safety
- 7.1.3. Smart Healthcare
- 7.1.4. Smart Building
- 7.1.5. Smart Utilities
- 7.1.6. Smart Security
- 7.1.7. Smart Education
- 7.1.8. Other Solutions
- 7.1. Market Analysis, Insights and Forecast - by Solution
- 8. Asia Pacific Smart Cities Market Analysis, Insights and Forecast, 2019-2031
- 8.1. Market Analysis, Insights and Forecast - by Solution
- 8.1.1. Smart Mobility Management
- 8.1.2. Smart Public Safety
- 8.1.3. Smart Healthcare
- 8.1.4. Smart Building
- 8.1.5. Smart Utilities
- 8.1.6. Smart Security
- 8.1.7. Smart Education
- 8.1.8. Other Solutions
- 8.1. Market Analysis, Insights and Forecast - by Solution
- 9. Latin America Smart Cities Market Analysis, Insights and Forecast, 2019-2031
- 9.1. Market Analysis, Insights and Forecast - by Solution
- 9.1.1. Smart Mobility Management
- 9.1.2. Smart Public Safety
- 9.1.3. Smart Healthcare
- 9.1.4. Smart Building
- 9.1.5. Smart Utilities
- 9.1.6. Smart Security
- 9.1.7. Smart Education
- 9.1.8. Other Solutions
- 9.1. Market Analysis, Insights and Forecast - by Solution
- 10. Middle East and Africa Smart Cities Market Analysis, Insights and Forecast, 2019-2031
- 10.1. Market Analysis, Insights and Forecast - by Solution
- 10.1.1. Smart Mobility Management
- 10.1.2. Smart Public Safety
- 10.1.3. Smart Healthcare
- 10.1.4. Smart Building
- 10.1.5. Smart Utilities
- 10.1.6. Smart Security
- 10.1.7. Smart Education
- 10.1.8. Other Solutions
- 10.1. Market Analysis, Insights and Forecast - by Solution
- 11. North America Smart Cities Market Analysis, Insights and Forecast, 2019-2031
- 11.1. Market Analysis, Insights and Forecast - By Country/Sub-region
- 11.1.1 United States
- 11.1.2 Canada
- 11.1.3 Mexico
- 12. Europe Smart Cities Market Analysis, Insights and Forecast, 2019-2031
- 12.1. Market Analysis, Insights and Forecast - By Country/Sub-region
- 12.1.1 Germany
- 12.1.2 United Kingdom
- 12.1.3 France
- 12.1.4 Spain
- 12.1.5 Italy
- 12.1.6 Spain
- 12.1.7 Belgium
- 12.1.8 Netherland
- 12.1.9 Nordics
- 12.1.10 Rest of Europe
- 13. Asia Pacific Smart Cities Market Analysis, Insights and Forecast, 2019-2031
- 13.1. Market Analysis, Insights and Forecast - By Country/Sub-region
- 13.1.1 China
- 13.1.2 Japan
- 13.1.3 India
- 13.1.4 South Korea
- 13.1.5 Southeast Asia
- 13.1.6 Australia
- 13.1.7 Indonesia
- 13.1.8 Phillipes
- 13.1.9 Singapore
- 13.1.10 Thailandc
- 13.1.11 Rest of Asia Pacific
- 14. South America Smart Cities Market Analysis, Insights and Forecast, 2019-2031
- 14.1. Market Analysis, Insights and Forecast - By Country/Sub-region
- 14.1.1 Brazil
- 14.1.2 Argentina
- 14.1.3 Peru
- 14.1.4 Chile
- 14.1.5 Colombia
- 14.1.6 Ecuador
- 14.1.7 Venezuela
- 14.1.8 Rest of South America
- 15. North America Smart Cities Market Analysis, Insights and Forecast, 2019-2031
- 15.1. Market Analysis, Insights and Forecast - By Country/Sub-region
- 15.1.1 United States
- 15.1.2 Canada
- 15.1.3 Mexico
- 16. MEA Smart Cities Market Analysis, Insights and Forecast, 2019-2031
- 16.1. Market Analysis, Insights and Forecast - By Country/Sub-region
- 16.1.1 United Arab Emirates
- 16.1.2 Saudi Arabia
- 16.1.3 South Africa
- 16.1.4 Rest of Middle East and Africa
- 17. Competitive Analysis
- 17.1. Global Market Share Analysis 2024
- 17.2. Company Profiles
- 17.2.1 Honeywell International Inc
- 17.2.1.1. Overview
- 17.2.1.2. Products
- 17.2.1.3. SWOT Analysis
- 17.2.1.4. Recent Developments
- 17.2.1.5. Financials (Based on Availability)
- 17.2.2 ABB Ltd
- 17.2.2.1. Overview
- 17.2.2.2. Products
- 17.2.2.3. SWOT Analysis
- 17.2.2.4. Recent Developments
- 17.2.2.5. Financials (Based on Availability)
- 17.2.3 IBM Corporation
- 17.2.3.1. Overview
- 17.2.3.2. Products
- 17.2.3.3. SWOT Analysis
- 17.2.3.4. Recent Developments
- 17.2.3.5. Financials (Based on Availability)
- 17.2.4 Koninklijke Philips N
- 17.2.4.1. Overview
- 17.2.4.2. Products
- 17.2.4.3. SWOT Analysis
- 17.2.4.4. Recent Developments
- 17.2.4.5. Financials (Based on Availability)
- 17.2.5 Hitachi Ltd
- 17.2.5.1. Overview
- 17.2.5.2. Products
- 17.2.5.3. SWOT Analysis
- 17.2.5.4. Recent Developments
- 17.2.5.5. Financials (Based on Availability)
- 17.2.6 Emerson Electric Co
- 17.2.6.1. Overview
- 17.2.6.2. Products
- 17.2.6.3. SWOT Analysis
- 17.2.6.4. Recent Developments
- 17.2.6.5. Financials (Based on Availability)
- 17.2.7 Cisco Systems Inc
- 17.2.7.1. Overview
- 17.2.7.2. Products
- 17.2.7.3. SWOT Analysis
- 17.2.7.4. Recent Developments
- 17.2.7.5. Financials (Based on Availability)
- 17.2.8 Siemens AG
- 17.2.8.1. Overview
- 17.2.8.2. Products
- 17.2.8.3. SWOT Analysis
- 17.2.8.4. Recent Developments
- 17.2.8.5. Financials (Based on Availability)
- 17.2.9 General Electric Co
- 17.2.9.1. Overview
- 17.2.9.2. Products
- 17.2.9.3. SWOT Analysis
- 17.2.9.4. Recent Developments
- 17.2.9.5. Financials (Based on Availability)
- 17.2.10 Schneider Electric SE
- 17.2.10.1. Overview
- 17.2.10.2. Products
- 17.2.10.3. SWOT Analysis
- 17.2.10.4. Recent Developments
- 17.2.10.5. Financials (Based on Availability)
- 17.2.11 Ericsson Inc
- 17.2.11.1. Overview
- 17.2.11.2. Products
- 17.2.11.3. SWOT Analysis
- 17.2.11.4. Recent Developments
- 17.2.11.5. Financials (Based on Availability)
- 17.2.12 Huawei Technologies Co Ltd
- 17.2.12.1. Overview
- 17.2.12.2. Products
- 17.2.12.3. SWOT Analysis
- 17.2.12.4. Recent Developments
- 17.2.12.5. Financials (Based on Availability)
- 17.2.13 Nokia Corporation
- 17.2.13.1. Overview
- 17.2.13.2. Products
- 17.2.13.3. SWOT Analysis
- 17.2.13.4. Recent Developments
- 17.2.13.5. Financials (Based on Availability)
- 17.2.1 Honeywell International Inc
List of Figures
- Figure 1: Global Smart Cities Market Revenue Breakdown (Million, %) by Region 2024 & 2032
- Figure 2: North America Smart Cities Market Revenue (Million), by Country 2024 & 2032
- Figure 3: North America Smart Cities Market Revenue Share (%), by Country 2024 & 2032
- Figure 4: Europe Smart Cities Market Revenue (Million), by Country 2024 & 2032
- Figure 5: Europe Smart Cities Market Revenue Share (%), by Country 2024 & 2032
- Figure 6: Asia Pacific Smart Cities Market Revenue (Million), by Country 2024 & 2032
- Figure 7: Asia Pacific Smart Cities Market Revenue Share (%), by Country 2024 & 2032
- Figure 8: South America Smart Cities Market Revenue (Million), by Country 2024 & 2032
- Figure 9: South America Smart Cities Market Revenue Share (%), by Country 2024 & 2032
- Figure 10: North America Smart Cities Market Revenue (Million), by Country 2024 & 2032
- Figure 11: North America Smart Cities Market Revenue Share (%), by Country 2024 & 2032
- Figure 12: MEA Smart Cities Market Revenue (Million), by Country 2024 & 2032
- Figure 13: MEA Smart Cities Market Revenue Share (%), by Country 2024 & 2032
- Figure 14: North America Smart Cities Market Revenue (Million), by Solution 2024 & 2032
- Figure 15: North America Smart Cities Market Revenue Share (%), by Solution 2024 & 2032
- Figure 16: North America Smart Cities Market Revenue (Million), by Country 2024 & 2032
- Figure 17: North America Smart Cities Market Revenue Share (%), by Country 2024 & 2032
- Figure 18: Europe Smart Cities Market Revenue (Million), by Solution 2024 & 2032
- Figure 19: Europe Smart Cities Market Revenue Share (%), by Solution 2024 & 2032
- Figure 20: Europe Smart Cities Market Revenue (Million), by Country 2024 & 2032
- Figure 21: Europe Smart Cities Market Revenue Share (%), by Country 2024 & 2032
- Figure 22: Asia Pacific Smart Cities Market Revenue (Million), by Solution 2024 & 2032
- Figure 23: Asia Pacific Smart Cities Market Revenue Share (%), by Solution 2024 & 2032
- Figure 24: Asia Pacific Smart Cities Market Revenue (Million), by Country 2024 & 2032
- Figure 25: Asia Pacific Smart Cities Market Revenue Share (%), by Country 2024 & 2032
- Figure 26: Latin America Smart Cities Market Revenue (Million), by Solution 2024 & 2032
- Figure 27: Latin America Smart Cities Market Revenue Share (%), by Solution 2024 & 2032
- Figure 28: Latin America Smart Cities Market Revenue (Million), by Country 2024 & 2032
- Figure 29: Latin America Smart Cities Market Revenue Share (%), by Country 2024 & 2032
- Figure 30: Middle East and Africa Smart Cities Market Revenue (Million), by Solution 2024 & 2032
- Figure 31: Middle East and Africa Smart Cities Market Revenue Share (%), by Solution 2024 & 2032
- Figure 32: Middle East and Africa Smart Cities Market Revenue (Million), by Country 2024 & 2032
- Figure 33: Middle East and Africa Smart Cities Market Revenue Share (%), by Country 2024 & 2032
List of Tables
- Table 1: Global Smart Cities Market Revenue Million Forecast, by Region 2019 & 2032
- Table 2: Global Smart Cities Market Revenue Million Forecast, by Solution 2019 & 2032
- Table 3: Global Smart Cities Market Revenue Million Forecast, by Region 2019 & 2032
- Table 4: Global Smart Cities Market Revenue Million Forecast, by Country 2019 & 2032
- Table 5: United States Smart Cities Market Revenue (Million) Forecast, by Application 2019 & 2032
- Table 6: Canada Smart Cities Market Revenue (Million) Forecast, by Application 2019 & 2032
- Table 7: Mexico Smart Cities Market Revenue (Million) Forecast, by Application 2019 & 2032
- Table 8: Global Smart Cities Market Revenue Million Forecast, by Country 2019 & 2032
- Table 9: Germany Smart Cities Market Revenue (Million) Forecast, by Application 2019 & 2032
- Table 10: United Kingdom Smart Cities Market Revenue (Million) Forecast, by Application 2019 & 2032
- Table 11: France Smart Cities Market Revenue (Million) Forecast, by Application 2019 & 2032
- Table 12: Spain Smart Cities Market Revenue (Million) Forecast, by Application 2019 & 2032
- Table 13: Italy Smart Cities Market Revenue (Million) Forecast, by Application 2019 & 2032
- Table 14: Spain Smart Cities Market Revenue (Million) Forecast, by Application 2019 & 2032
- Table 15: Belgium Smart Cities Market Revenue (Million) Forecast, by Application 2019 & 2032
- Table 16: Netherland Smart Cities Market Revenue (Million) Forecast, by Application 2019 & 2032
- Table 17: Nordics Smart Cities Market Revenue (Million) Forecast, by Application 2019 & 2032
- Table 18: Rest of Europe Smart Cities Market Revenue (Million) Forecast, by Application 2019 & 2032
- Table 19: Global Smart Cities Market Revenue Million Forecast, by Country 2019 & 2032
- Table 20: China Smart Cities Market Revenue (Million) Forecast, by Application 2019 & 2032
- Table 21: Japan Smart Cities Market Revenue (Million) Forecast, by Application 2019 & 2032
- Table 22: India Smart Cities Market Revenue (Million) Forecast, by Application 2019 & 2032
- Table 23: South Korea Smart Cities Market Revenue (Million) Forecast, by Application 2019 & 2032
- Table 24: Southeast Asia Smart Cities Market Revenue (Million) Forecast, by Application 2019 & 2032
- Table 25: Australia Smart Cities Market Revenue (Million) Forecast, by Application 2019 & 2032
- Table 26: Indonesia Smart Cities Market Revenue (Million) Forecast, by Application 2019 & 2032
- Table 27: Phillipes Smart Cities Market Revenue (Million) Forecast, by Application 2019 & 2032
- Table 28: Singapore Smart Cities Market Revenue (Million) Forecast, by Application 2019 & 2032
- Table 29: Thailandc Smart Cities Market Revenue (Million) Forecast, by Application 2019 & 2032
- Table 30: Rest of Asia Pacific Smart Cities Market Revenue (Million) Forecast, by Application 2019 & 2032
- Table 31: Global Smart Cities Market Revenue Million Forecast, by Country 2019 & 2032
- Table 32: Brazil Smart Cities Market Revenue (Million) Forecast, by Application 2019 & 2032
- Table 33: Argentina Smart Cities Market Revenue (Million) Forecast, by Application 2019 & 2032
- Table 34: Peru Smart Cities Market Revenue (Million) Forecast, by Application 2019 & 2032
- Table 35: Chile Smart Cities Market Revenue (Million) Forecast, by Application 2019 & 2032
- Table 36: Colombia Smart Cities Market Revenue (Million) Forecast, by Application 2019 & 2032
- Table 37: Ecuador Smart Cities Market Revenue (Million) Forecast, by Application 2019 & 2032
- Table 38: Venezuela Smart Cities Market Revenue (Million) Forecast, by Application 2019 & 2032
- Table 39: Rest of South America Smart Cities Market Revenue (Million) Forecast, by Application 2019 & 2032
- Table 40: Global Smart Cities Market Revenue Million Forecast, by Country 2019 & 2032
- Table 41: United States Smart Cities Market Revenue (Million) Forecast, by Application 2019 & 2032
- Table 42: Canada Smart Cities Market Revenue (Million) Forecast, by Application 2019 & 2032
- Table 43: Mexico Smart Cities Market Revenue (Million) Forecast, by Application 2019 & 2032
- Table 44: Global Smart Cities Market Revenue Million Forecast, by Country 2019 & 2032
- Table 45: United Arab Emirates Smart Cities Market Revenue (Million) Forecast, by Application 2019 & 2032
- Table 46: Saudi Arabia Smart Cities Market Revenue (Million) Forecast, by Application 2019 & 2032
- Table 47: South Africa Smart Cities Market Revenue (Million) Forecast, by Application 2019 & 2032
- Table 48: Rest of Middle East and Africa Smart Cities Market Revenue (Million) Forecast, by Application 2019 & 2032
- Table 49: Global Smart Cities Market Revenue Million Forecast, by Solution 2019 & 2032
- Table 50: Global Smart Cities Market Revenue Million Forecast, by Country 2019 & 2032
- Table 51: United States Smart Cities Market Revenue (Million) Forecast, by Application 2019 & 2032
- Table 52: Canada Smart Cities Market Revenue (Million) Forecast, by Application 2019 & 2032
- Table 53: Global Smart Cities Market Revenue Million Forecast, by Solution 2019 & 2032
- Table 54: Global Smart Cities Market Revenue Million Forecast, by Country 2019 & 2032
- Table 55: United Kingdom Smart Cities Market Revenue (Million) Forecast, by Application 2019 & 2032
- Table 56: Germany Smart Cities Market Revenue (Million) Forecast, by Application 2019 & 2032
- Table 57: France Smart Cities Market Revenue (Million) Forecast, by Application 2019 & 2032
- Table 58: Sweden Smart Cities Market Revenue (Million) Forecast, by Application 2019 & 2032
- Table 59: Rest of Europe Smart Cities Market Revenue (Million) Forecast, by Application 2019 & 2032
- Table 60: Global Smart Cities Market Revenue Million Forecast, by Solution 2019 & 2032
- Table 61: Global Smart Cities Market Revenue Million Forecast, by Country 2019 & 2032
- Table 62: China Smart Cities Market Revenue (Million) Forecast, by Application 2019 & 2032
- Table 63: Japan Smart Cities Market Revenue (Million) Forecast, by Application 2019 & 2032
- Table 64: India Smart Cities Market Revenue (Million) Forecast, by Application 2019 & 2032
- Table 65: Australia Smart Cities Market Revenue (Million) Forecast, by Application 2019 & 2032
- Table 66: South Korea Smart Cities Market Revenue (Million) Forecast, by Application 2019 & 2032
- Table 67: Rest of Asia Pacific Smart Cities Market Revenue (Million) Forecast, by Application 2019 & 2032
- Table 68: Global Smart Cities Market Revenue Million Forecast, by Solution 2019 & 2032
- Table 69: Global Smart Cities Market Revenue Million Forecast, by Country 2019 & 2032
- Table 70: Mexico Smart Cities Market Revenue (Million) Forecast, by Application 2019 & 2032
- Table 71: Brazil Smart Cities Market Revenue (Million) Forecast, by Application 2019 & 2032
- Table 72: Argentina Smart Cities Market Revenue (Million) Forecast, by Application 2019 & 2032
- Table 73: Rest of Latin America Smart Cities Market Revenue (Million) Forecast, by Application 2019 & 2032
- Table 74: Global Smart Cities Market Revenue Million Forecast, by Solution 2019 & 2032
- Table 75: Global Smart Cities Market Revenue Million Forecast, by Country 2019 & 2032
- Table 76: Saudi Arabia Smart Cities Market Revenue (Million) Forecast, by Application 2019 & 2032
- Table 77: United Arab Emirates Smart Cities Market Revenue (Million) Forecast, by Application 2019 & 2032
- Table 78: South Africa Smart Cities Market Revenue (Million) Forecast, by Application 2019 & 2032
- Table 79: Rest of Middle East and Africa Smart Cities Market Revenue (Million) Forecast, by Application 2019 & 2032
Frequently Asked Questions
1. What is the projected Compound Annual Growth Rate (CAGR) of the Smart Cities Market?
The projected CAGR is approximately 23.21%.
2. Which companies are prominent players in the Smart Cities Market?
Key companies in the market include Honeywell International Inc, ABB Ltd, IBM Corporation, Koninklijke Philips N, Hitachi Ltd, Emerson Electric Co, Cisco Systems Inc, Siemens AG, General Electric Co, Schneider Electric SE, Ericsson Inc, Huawei Technologies Co Ltd, Nokia Corporation.
3. What are the main segments of the Smart Cities Market?
The market segments include Solution.
4. Can you provide details about the market size?
The market size is estimated to be USD 1.36 Million as of 2022.
5. What are some drivers contributing to market growth?
Rising Adoption of AI and IoT; Growth in the need for public safety and security.
6. What are the notable trends driving market growth?
Adoption of AI and IoT to be Major Drivers for the Market.
7. Are there any restraints impacting market growth?
The high cost of safety connection devices; Lack of awareness about its developments in the industry.
8. Can you provide examples of recent developments in the market?
June 2023: TIM, a telecom operator, and Ericsson announced an increase in their investments in private networks and IoT projects in Brazil. TIM has announced various new projects, particularly in smart cities/public lighting. In the previous month, the company announced a smart lighting project in Porto Alegre, Rio Grande do Sul state, using 4G NB-IoT technology for IPSul, the concessionaire responsible for public lighting in the city.
9. What pricing options are available for accessing the report?
Pricing options include single-user, multi-user, and enterprise licenses priced at USD 4750, USD 5250, and USD 8750 respectively.
10. Is the market size provided in terms of value or volume?
The market size is provided in terms of value, measured in Million.
11. Are there any specific market keywords associated with the report?
Yes, the market keyword associated with the report is "Smart Cities Market," which aids in identifying and referencing the specific market segment covered.
12. How do I determine which pricing option suits my needs best?
The pricing options vary based on user requirements and access needs. Individual users may opt for single-user licenses, while businesses requiring broader access may choose multi-user or enterprise licenses for cost-effective access to the report.
13. Are there any additional resources or data provided in the Smart Cities Market report?
While the report offers comprehensive insights, it's advisable to review the specific contents or supplementary materials provided to ascertain if additional resources or data are available.
14. How can I stay updated on further developments or reports in the Smart Cities Market?
To stay informed about further developments, trends, and reports in the Smart Cities Market, consider subscribing to industry newsletters, following relevant companies and organizations, or regularly checking reputable industry news sources and publications.
Methodology
Step 1 - Identification of Relevant Samples Size from Population Database


Step 2 - Approaches for Defining Global Market Size (Value, Volume* & Price*)

Note*: In applicable scenarios
Step 3 - Data Sources
Primary Research
- Web Analytics
- Survey Reports
- Research Institute
- Latest Research Reports
- Opinion Leaders
Secondary Research
- Annual Reports
- White Paper
- Latest Press Release
- Industry Association
- Paid Database
- Investor Presentations

Step 4 - Data Triangulation
Involves using different sources of information in order to increase the validity of a study
These sources are likely to be stakeholders in a program - participants, other researchers, program staff, other community members, and so on.
Then we put all data in single framework & apply various statistical tools to find out the dynamic on the market.
During the analysis stage, feedback from the stakeholder groups would be compared to determine areas of agreement as well as areas of divergence
