

Key Insights
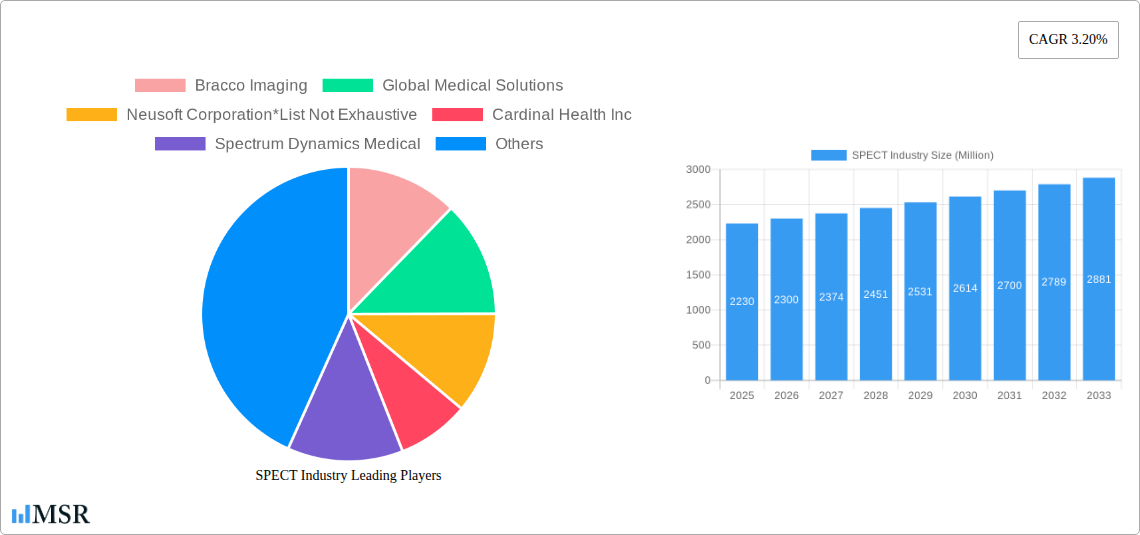
The global Single-Photon Emission Computed Tomography (SPECT) market, valued at $2.23 billion in 2025, is projected to experience steady growth, driven by the increasing prevalence of cardiovascular diseases and cancer, necessitating advanced diagnostic imaging techniques. The market's Compound Annual Growth Rate (CAGR) of 3.20% from 2019 to 2025 indicates a consistent demand for SPECT systems and radiopharmaceuticals. Technological advancements, such as the development of higher-resolution detectors and improved image reconstruction algorithms, contribute to enhanced diagnostic capabilities and increased market adoption. The segment dominated by Tc-99m radioisotopes is likely to maintain its leading position due to its cost-effectiveness and wide clinical applications. Oncology and cardiology applications currently represent significant market shares, reflecting the high incidence of these diseases globally. However, the market faces certain restraints, including the relatively high cost of SPECT imaging compared to other modalities and the potential risks associated with ionizing radiation. Nevertheless, the expanding geriatric population and rising healthcare expenditure are projected to fuel market expansion throughout the forecast period (2025-2033). Competitive landscape analysis reveals key players such as GE Healthcare, Bracco Imaging, and Cardinal Health, continuously investing in research and development to maintain their market positions and introduce innovative SPECT solutions. Growth in emerging economies, particularly within Asia-Pacific, is expected to contribute significantly to the overall market expansion in the coming years.
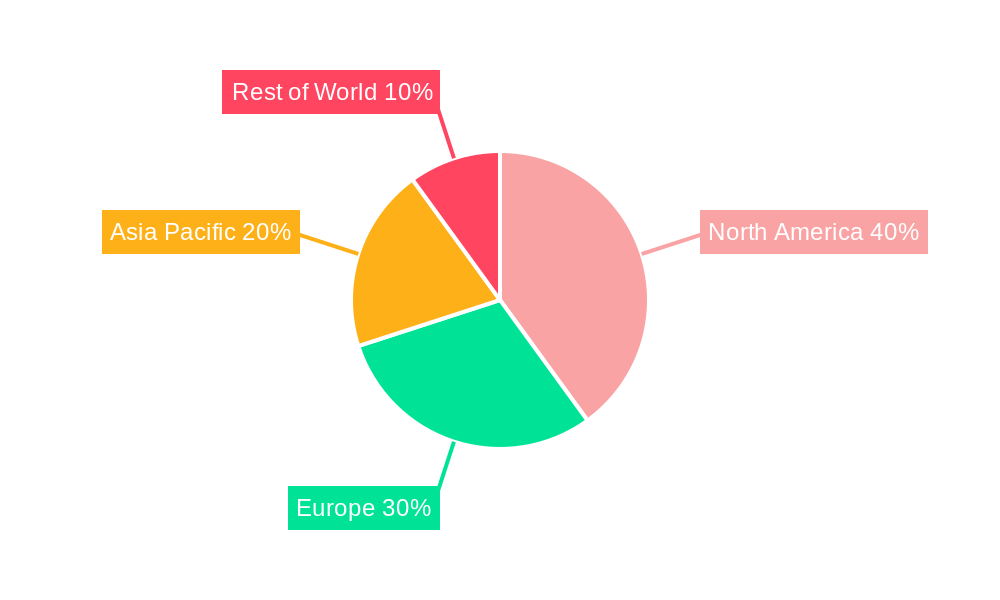
The regional distribution of the SPECT market is likely to see North America and Europe maintaining significant shares due to advanced healthcare infrastructure and high adoption rates. However, Asia-Pacific is projected to witness robust growth driven by rising disposable incomes, increasing healthcare awareness, and government initiatives focused on improving healthcare access. The market segmentation by application reveals opportunities for growth in neurology and other applications as technological advancements broaden the scope of SPECT imaging in diverse clinical settings. Future market expansion will be influenced by factors such as the development of hybrid imaging systems that combine SPECT with other modalities, offering more comprehensive diagnostic information. This will enhance clinical decision-making and improve patient outcomes, solidifying the SPECT market's position in the broader medical imaging landscape. Furthermore, the ongoing focus on improving radiation safety protocols and developing more efficient radiopharmaceuticals is expected to enhance the adoption rate and reduce potential risks associated with SPECT imaging, fostering further market growth.
SPECT Industry Market Report: 2019-2033 Forecast
This comprehensive report provides a detailed analysis of the global SPECT (Single-Photon Emission Computed Tomography) industry, offering invaluable insights for stakeholders, investors, and industry professionals. The report covers the period from 2019 to 2033, with a base year of 2025 and a forecast period of 2025-2033. The global SPECT market is projected to reach xx Million by 2033, exhibiting a CAGR of xx% during the forecast period. This report analyzes key market segments, including by type of radioisotopes (Tc-99m, Ra-, Ga-, I-, and others) and by application (oncology, cardiology, neurology, and others), identifying lucrative growth opportunities and challenges.
SPECT Industry Market Concentration & Dynamics
The SPECT industry exhibits a moderately concentrated market structure, with several key players holding significant market share. Key competitors include Bracco Imaging, Global Medical Solutions, Neusoft Corporation, Cardinal Health Inc, Spectrum Dynamics Medical, Guerbet, NTP Radioisotopes SOC Ltd, Lantheus Medical Imaging Inc, Gamma Medica Inc, GE Healthcare (GE Company), Curium, and Digirad Corporation. However, the market also includes numerous smaller players, contributing to a dynamic competitive landscape.
Market Concentration Metrics:
- Market Share of Top 5 Players: xx% (2025 estimate)
- Market Share of Top 10 Players: xx% (2025 estimate)
Industry Dynamics:
- Innovation Ecosystems: Significant R&D investment focuses on improving image quality, reducing radiation exposure, and developing new radiopharmaceuticals.
- Regulatory Frameworks: Stringent regulatory approvals and quality control measures influence market entry and product development.
- Substitute Products: While SPECT is a valuable imaging modality, competition exists from alternative imaging techniques like PET and MRI.
- End-User Trends: Increasing demand for accurate and early diagnostics across various applications drives market growth.
- M&A Activities: The industry has witnessed several mergers and acquisitions in recent years, aiming for market consolidation and expansion. The number of M&A deals between 2019 and 2024 totaled approximately xx.
SPECT Industry Industry Insights & Trends
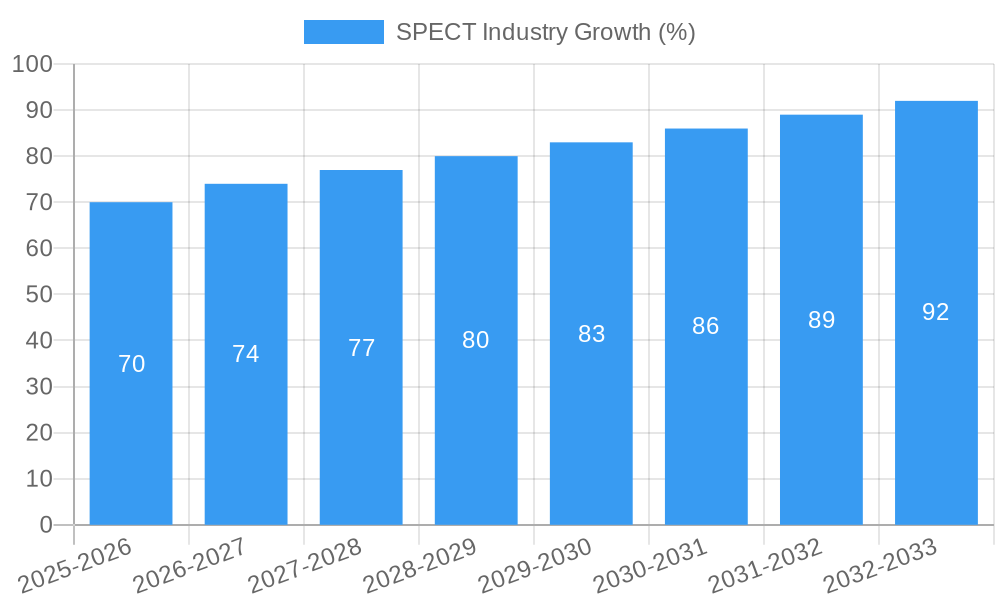
The global SPECT industry is experiencing robust growth, driven primarily by the rising prevalence of chronic diseases, increasing demand for non-invasive diagnostic procedures, and technological advancements. The market size reached xx Million in 2024 and is estimated at xx Million in 2025. This growth is further fueled by technological innovations, such as the development of new radiopharmaceuticals, improved SPECT scanners with enhanced image resolution, and the integration of SPECT with other imaging modalities like CT and MRI. The increasing adoption of SPECT in emerging markets and the rising geriatric population are also contributing to market expansion. Changing consumer behaviors, including a growing preference for minimally invasive procedures, and the increasing awareness among patients regarding early diagnosis are influencing market dynamics. The industry is witnessing an increasing shift toward personalized medicine, which requires improved diagnostic tools and tailored treatment approaches.
Key Markets & Segments Leading SPECT Industry
The oncology segment dominates the SPECT market, driven by its widespread use in diagnosing and staging various cancers. Geographically, North America holds the largest market share, followed by Europe and Asia Pacific.
Dominant Segments:
- By Type of Radioisotopes: Tc-99m remains the most widely used radioisotope due to its favorable properties and cost-effectiveness.
- By Application: Oncology accounts for the largest market share due to the high prevalence of cancer and its effectiveness in diagnosis and staging.
Drivers for Dominant Segments:
- Oncology: Rising cancer incidence rates, increasing demand for accurate diagnosis, and advancements in targeted therapies.
- Cardiology: Growing prevalence of cardiovascular diseases and the need for accurate assessment of myocardial perfusion.
- North America: Advanced healthcare infrastructure, high adoption rates of advanced imaging technologies, and strong government support.
- Europe: Well-established healthcare systems, growing awareness of advanced diagnostic techniques, and supportive regulatory frameworks.
SPECT Industry Product Developments
Recent product innovations include advancements in SPECT/CT systems that combine the anatomical detail of CT with the functional information of SPECT, improving diagnostic accuracy. Manufacturers are also focusing on developing new radiotracers with enhanced sensitivity and specificity for improved disease detection. These developments aim to enhance image quality, reduce radiation exposure, and expand applications across various medical fields. The competitive edge is derived from superior image resolution, faster scan times, and the integration of advanced image processing algorithms.
Challenges in the SPECT Industry Market
The SPECT industry faces several challenges, including the high cost of equipment and radiopharmaceuticals, stringent regulatory requirements for new radiotracers, and potential supply chain disruptions impacting the availability of radioisotopes. Competition from alternative imaging modalities also poses a significant threat. These factors can impact market growth and profitability, necessitating proactive strategies from industry players. The xx Million investment needed for new equipment and radiopharmaceuticals development is a significant barrier for entry and growth.
Forces Driving SPECT Industry Growth
Several factors are driving SPECT industry growth, including the increasing prevalence of chronic diseases such as cancer and cardiovascular diseases, technological advancements leading to improved image quality and reduced radiation exposure, and growing adoption of SPECT in emerging markets. Favorable regulatory environments and increasing investments in healthcare infrastructure further stimulate market expansion.
Challenges in the SPECT Industry Market
Long-term growth in the SPECT industry depends on overcoming challenges such as the high cost of equipment and radiopharmaceuticals. Continued investment in R&D, strategic collaborations for expanding market access, and exploring new applications will be crucial.
Emerging Opportunities in SPECT Industry
Emerging opportunities lie in the development of new and more specific radiotracers, improving image analysis techniques with AI, and integrating SPECT with other imaging modalities. Expanding into emerging markets and offering customized solutions are additional avenues for growth.
Leading Players in the SPECT Industry Sector
- Bracco Imaging
- Global Medical Solutions
- Neusoft Corporation
- Cardinal Health Inc
- Spectrum Dynamics Medical
- Guerbet
- NTP Radioisotopes SOC Ltd
- Lantheus Medical Imaging Inc
- Gamma Medica Inc
- GE Healthcare (GE Company)
- Curium
- Digirad Corporation
Key Milestones in SPECT Industry Industry
- 2020: Introduction of a new SPECT/CT scanner with improved image resolution by GE Healthcare.
- 2021: Approval of a novel radiopharmaceutical for neurodegenerative disease diagnosis by Lantheus Medical Imaging.
- 2022: Acquisition of a smaller SPECT imaging company by Bracco Imaging.
- 2023: Launch of a new AI-based image analysis software for SPECT images.
- 2024: FDA approval of a new radiotracer for oncology applications.
Strategic Outlook for SPECT Industry Market
The SPECT industry holds significant growth potential, driven by technological advancements and the increasing demand for accurate and early disease diagnosis. Strategic investments in R&D, strategic partnerships, and expansion into new markets are expected to shape future market dynamics and create lucrative opportunities for industry players. The projected xx Million market size by 2033 reflects this optimistic outlook.
SPECT Industry Segmentation
-
1. Type of Radioisotopes
- 1.1. Tc-99m
- 1.2. Ra-223
- 1.3. Ga-67
- 1.4. I-123
- 1.5. Other Types of Radioisotopes
-
2. Application
- 2.1. Oncology
- 2.2. Cardiology
- 2.3. Neurology
- 2.4. Other Applications
SPECT Industry Segmentation By Geography
-
1. North America
- 1.1. United States
- 1.2. Canada
- 1.3. Mexico
-
2. Europe
- 2.1. Germany
- 2.2. United Kingdom
- 2.3. France
- 2.4. Italy
- 2.5. Spain
- 2.6. Rest of Europe
-
3. Asia Pacific
- 3.1. China
- 3.2. Japan
- 3.3. India
- 3.4. Australia
- 3.5. South Korea
- 3.6. Rest of Asia Pacific
-
4. Middle East and Africa
- 4.1. GCC
- 4.2. South Africa
- 4.3. Rest of Middle East and Africa
-
5. South America
- 5.1. Brazil
- 5.2. Argentina
- 5.3. Rest of South America
SPECT Industry REPORT HIGHLIGHTS
| Aspects | Details |
|---|---|
| Study Period | 2019-2033 |
| Base Year | 2024 |
| Estimated Year | 2025 |
| Forecast Period | 2025-2033 |
| Historical Period | 2019-2024 |
| Growth Rate | CAGR of 3.20% from 2019-2033 |
| Segmentation |
|
Table of Contents
- 1. Introduction
- 1.1. Research Scope
- 1.2. Market Segmentation
- 1.3. Research Methodology
- 1.4. Definitions and Assumptions
- 2. Executive Summary
- 2.1. Introduction
- 3. Market Dynamics
- 3.1. Introduction
- 3.2. Market Drivers
- 3.2.1. Increasing Demand for SPECT Analysis in Radiopharmaceuticals; Growing Geriatric Population; Improvements in SPECT Imaging Technology
- 3.3. Market Restrains
- 3.3.1. Shorter Half-life of Radioisotopes; Stringent Regulatory Guidelines
- 3.4. Market Trends
- 3.4.1. The Gallium-67 Segment is Expected to Witness a Large CAGR Over the Forecast Period in the Single Photon Emission Computed Tomography (SPECT) Market
- 4. Market Factor Analysis
- 4.1. Porters Five Forces
- 4.2. Supply/Value Chain
- 4.3. PESTEL analysis
- 4.4. Market Entropy
- 4.5. Patent/Trademark Analysis
- 5. Global SPECT Industry Analysis, Insights and Forecast, 2019-2031
- 5.1. Market Analysis, Insights and Forecast - by Type of Radioisotopes
- 5.1.1. Tc-99m
- 5.1.2. Ra-223
- 5.1.3. Ga-67
- 5.1.4. I-123
- 5.1.5. Other Types of Radioisotopes
- 5.2. Market Analysis, Insights and Forecast - by Application
- 5.2.1. Oncology
- 5.2.2. Cardiology
- 5.2.3. Neurology
- 5.2.4. Other Applications
- 5.3. Market Analysis, Insights and Forecast - by Region
- 5.3.1. North America
- 5.3.2. Europe
- 5.3.3. Asia Pacific
- 5.3.4. Middle East and Africa
- 5.3.5. South America
- 5.1. Market Analysis, Insights and Forecast - by Type of Radioisotopes
- 6. North America SPECT Industry Analysis, Insights and Forecast, 2019-2031
- 6.1. Market Analysis, Insights and Forecast - by Type of Radioisotopes
- 6.1.1. Tc-99m
- 6.1.2. Ra-223
- 6.1.3. Ga-67
- 6.1.4. I-123
- 6.1.5. Other Types of Radioisotopes
- 6.2. Market Analysis, Insights and Forecast - by Application
- 6.2.1. Oncology
- 6.2.2. Cardiology
- 6.2.3. Neurology
- 6.2.4. Other Applications
- 6.1. Market Analysis, Insights and Forecast - by Type of Radioisotopes
- 7. Europe SPECT Industry Analysis, Insights and Forecast, 2019-2031
- 7.1. Market Analysis, Insights and Forecast - by Type of Radioisotopes
- 7.1.1. Tc-99m
- 7.1.2. Ra-223
- 7.1.3. Ga-67
- 7.1.4. I-123
- 7.1.5. Other Types of Radioisotopes
- 7.2. Market Analysis, Insights and Forecast - by Application
- 7.2.1. Oncology
- 7.2.2. Cardiology
- 7.2.3. Neurology
- 7.2.4. Other Applications
- 7.1. Market Analysis, Insights and Forecast - by Type of Radioisotopes
- 8. Asia Pacific SPECT Industry Analysis, Insights and Forecast, 2019-2031
- 8.1. Market Analysis, Insights and Forecast - by Type of Radioisotopes
- 8.1.1. Tc-99m
- 8.1.2. Ra-223
- 8.1.3. Ga-67
- 8.1.4. I-123
- 8.1.5. Other Types of Radioisotopes
- 8.2. Market Analysis, Insights and Forecast - by Application
- 8.2.1. Oncology
- 8.2.2. Cardiology
- 8.2.3. Neurology
- 8.2.4. Other Applications
- 8.1. Market Analysis, Insights and Forecast - by Type of Radioisotopes
- 9. Middle East and Africa SPECT Industry Analysis, Insights and Forecast, 2019-2031
- 9.1. Market Analysis, Insights and Forecast - by Type of Radioisotopes
- 9.1.1. Tc-99m
- 9.1.2. Ra-223
- 9.1.3. Ga-67
- 9.1.4. I-123
- 9.1.5. Other Types of Radioisotopes
- 9.2. Market Analysis, Insights and Forecast - by Application
- 9.2.1. Oncology
- 9.2.2. Cardiology
- 9.2.3. Neurology
- 9.2.4. Other Applications
- 9.1. Market Analysis, Insights and Forecast - by Type of Radioisotopes
- 10. South America SPECT Industry Analysis, Insights and Forecast, 2019-2031
- 10.1. Market Analysis, Insights and Forecast - by Type of Radioisotopes
- 10.1.1. Tc-99m
- 10.1.2. Ra-223
- 10.1.3. Ga-67
- 10.1.4. I-123
- 10.1.5. Other Types of Radioisotopes
- 10.2. Market Analysis, Insights and Forecast - by Application
- 10.2.1. Oncology
- 10.2.2. Cardiology
- 10.2.3. Neurology
- 10.2.4. Other Applications
- 10.1. Market Analysis, Insights and Forecast - by Type of Radioisotopes
- 11. North America SPECT Industry Analysis, Insights and Forecast, 2019-2031
- 11.1. Market Analysis, Insights and Forecast - By Country/Sub-region
- 11.1.1 United States
- 11.1.2 Canada
- 11.1.3 Mexico
- 12. Europe SPECT Industry Analysis, Insights and Forecast, 2019-2031
- 12.1. Market Analysis, Insights and Forecast - By Country/Sub-region
- 12.1.1 Germany
- 12.1.2 United Kingdom
- 12.1.3 France
- 12.1.4 Italy
- 12.1.5 Spain
- 12.1.6 Rest of Europe
- 13. Asia Pacific SPECT Industry Analysis, Insights and Forecast, 2019-2031
- 13.1. Market Analysis, Insights and Forecast - By Country/Sub-region
- 13.1.1 China
- 13.1.2 Japan
- 13.1.3 India
- 13.1.4 Australia
- 13.1.5 South Korea
- 13.1.6 Rest of Asia Pacific
- 14. Middle East and Africa SPECT Industry Analysis, Insights and Forecast, 2019-2031
- 14.1. Market Analysis, Insights and Forecast - By Country/Sub-region
- 14.1.1 GCC
- 14.1.2 South Africa
- 14.1.3 Rest of Middle East and Africa
- 15. South America SPECT Industry Analysis, Insights and Forecast, 2019-2031
- 15.1. Market Analysis, Insights and Forecast - By Country/Sub-region
- 15.1.1 Brazil
- 15.1.2 Argentina
- 15.1.3 Rest of South America
- 16. Competitive Analysis
- 16.1. Global Market Share Analysis 2024
- 16.2. Company Profiles
- 16.2.1 Bracco Imaging
- 16.2.1.1. Overview
- 16.2.1.2. Products
- 16.2.1.3. SWOT Analysis
- 16.2.1.4. Recent Developments
- 16.2.1.5. Financials (Based on Availability)
- 16.2.2 Global Medical Solutions
- 16.2.2.1. Overview
- 16.2.2.2. Products
- 16.2.2.3. SWOT Analysis
- 16.2.2.4. Recent Developments
- 16.2.2.5. Financials (Based on Availability)
- 16.2.3 Neusoft Corporation*List Not Exhaustive
- 16.2.3.1. Overview
- 16.2.3.2. Products
- 16.2.3.3. SWOT Analysis
- 16.2.3.4. Recent Developments
- 16.2.3.5. Financials (Based on Availability)
- 16.2.4 Cardinal Health Inc
- 16.2.4.1. Overview
- 16.2.4.2. Products
- 16.2.4.3. SWOT Analysis
- 16.2.4.4. Recent Developments
- 16.2.4.5. Financials (Based on Availability)
- 16.2.5 Spectrum Dynamics Medical
- 16.2.5.1. Overview
- 16.2.5.2. Products
- 16.2.5.3. SWOT Analysis
- 16.2.5.4. Recent Developments
- 16.2.5.5. Financials (Based on Availability)
- 16.2.6 Guerbet
- 16.2.6.1. Overview
- 16.2.6.2. Products
- 16.2.6.3. SWOT Analysis
- 16.2.6.4. Recent Developments
- 16.2.6.5. Financials (Based on Availability)
- 16.2.7 NTP Radioisotopes SOC Ltd
- 16.2.7.1. Overview
- 16.2.7.2. Products
- 16.2.7.3. SWOT Analysis
- 16.2.7.4. Recent Developments
- 16.2.7.5. Financials (Based on Availability)
- 16.2.8 Lantheus Medical Imaging Inc
- 16.2.8.1. Overview
- 16.2.8.2. Products
- 16.2.8.3. SWOT Analysis
- 16.2.8.4. Recent Developments
- 16.2.8.5. Financials (Based on Availability)
- 16.2.9 Gamma Medica Inc
- 16.2.9.1. Overview
- 16.2.9.2. Products
- 16.2.9.3. SWOT Analysis
- 16.2.9.4. Recent Developments
- 16.2.9.5. Financials (Based on Availability)
- 16.2.10 GE Healthcare (GE Company)
- 16.2.10.1. Overview
- 16.2.10.2. Products
- 16.2.10.3. SWOT Analysis
- 16.2.10.4. Recent Developments
- 16.2.10.5. Financials (Based on Availability)
- 16.2.11 Curium
- 16.2.11.1. Overview
- 16.2.11.2. Products
- 16.2.11.3. SWOT Analysis
- 16.2.11.4. Recent Developments
- 16.2.11.5. Financials (Based on Availability)
- 16.2.12 Digirad Corporation
- 16.2.12.1. Overview
- 16.2.12.2. Products
- 16.2.12.3. SWOT Analysis
- 16.2.12.4. Recent Developments
- 16.2.12.5. Financials (Based on Availability)
- 16.2.1 Bracco Imaging
List of Figures
- Figure 1: Global SPECT Industry Revenue Breakdown (Million, %) by Region 2024 & 2032
- Figure 2: North America SPECT Industry Revenue (Million), by Country 2024 & 2032
- Figure 3: North America SPECT Industry Revenue Share (%), by Country 2024 & 2032
- Figure 4: Europe SPECT Industry Revenue (Million), by Country 2024 & 2032
- Figure 5: Europe SPECT Industry Revenue Share (%), by Country 2024 & 2032
- Figure 6: Asia Pacific SPECT Industry Revenue (Million), by Country 2024 & 2032
- Figure 7: Asia Pacific SPECT Industry Revenue Share (%), by Country 2024 & 2032
- Figure 8: Middle East and Africa SPECT Industry Revenue (Million), by Country 2024 & 2032
- Figure 9: Middle East and Africa SPECT Industry Revenue Share (%), by Country 2024 & 2032
- Figure 10: South America SPECT Industry Revenue (Million), by Country 2024 & 2032
- Figure 11: South America SPECT Industry Revenue Share (%), by Country 2024 & 2032
- Figure 12: North America SPECT Industry Revenue (Million), by Type of Radioisotopes 2024 & 2032
- Figure 13: North America SPECT Industry Revenue Share (%), by Type of Radioisotopes 2024 & 2032
- Figure 14: North America SPECT Industry Revenue (Million), by Application 2024 & 2032
- Figure 15: North America SPECT Industry Revenue Share (%), by Application 2024 & 2032
- Figure 16: North America SPECT Industry Revenue (Million), by Country 2024 & 2032
- Figure 17: North America SPECT Industry Revenue Share (%), by Country 2024 & 2032
- Figure 18: Europe SPECT Industry Revenue (Million), by Type of Radioisotopes 2024 & 2032
- Figure 19: Europe SPECT Industry Revenue Share (%), by Type of Radioisotopes 2024 & 2032
- Figure 20: Europe SPECT Industry Revenue (Million), by Application 2024 & 2032
- Figure 21: Europe SPECT Industry Revenue Share (%), by Application 2024 & 2032
- Figure 22: Europe SPECT Industry Revenue (Million), by Country 2024 & 2032
- Figure 23: Europe SPECT Industry Revenue Share (%), by Country 2024 & 2032
- Figure 24: Asia Pacific SPECT Industry Revenue (Million), by Type of Radioisotopes 2024 & 2032
- Figure 25: Asia Pacific SPECT Industry Revenue Share (%), by Type of Radioisotopes 2024 & 2032
- Figure 26: Asia Pacific SPECT Industry Revenue (Million), by Application 2024 & 2032
- Figure 27: Asia Pacific SPECT Industry Revenue Share (%), by Application 2024 & 2032
- Figure 28: Asia Pacific SPECT Industry Revenue (Million), by Country 2024 & 2032
- Figure 29: Asia Pacific SPECT Industry Revenue Share (%), by Country 2024 & 2032
- Figure 30: Middle East and Africa SPECT Industry Revenue (Million), by Type of Radioisotopes 2024 & 2032
- Figure 31: Middle East and Africa SPECT Industry Revenue Share (%), by Type of Radioisotopes 2024 & 2032
- Figure 32: Middle East and Africa SPECT Industry Revenue (Million), by Application 2024 & 2032
- Figure 33: Middle East and Africa SPECT Industry Revenue Share (%), by Application 2024 & 2032
- Figure 34: Middle East and Africa SPECT Industry Revenue (Million), by Country 2024 & 2032
- Figure 35: Middle East and Africa SPECT Industry Revenue Share (%), by Country 2024 & 2032
- Figure 36: South America SPECT Industry Revenue (Million), by Type of Radioisotopes 2024 & 2032
- Figure 37: South America SPECT Industry Revenue Share (%), by Type of Radioisotopes 2024 & 2032
- Figure 38: South America SPECT Industry Revenue (Million), by Application 2024 & 2032
- Figure 39: South America SPECT Industry Revenue Share (%), by Application 2024 & 2032
- Figure 40: South America SPECT Industry Revenue (Million), by Country 2024 & 2032
- Figure 41: South America SPECT Industry Revenue Share (%), by Country 2024 & 2032
List of Tables
- Table 1: Global SPECT Industry Revenue Million Forecast, by Region 2019 & 2032
- Table 2: Global SPECT Industry Revenue Million Forecast, by Type of Radioisotopes 2019 & 2032
- Table 3: Global SPECT Industry Revenue Million Forecast, by Application 2019 & 2032
- Table 4: Global SPECT Industry Revenue Million Forecast, by Region 2019 & 2032
- Table 5: Global SPECT Industry Revenue Million Forecast, by Country 2019 & 2032
- Table 6: United States SPECT Industry Revenue (Million) Forecast, by Application 2019 & 2032
- Table 7: Canada SPECT Industry Revenue (Million) Forecast, by Application 2019 & 2032
- Table 8: Mexico SPECT Industry Revenue (Million) Forecast, by Application 2019 & 2032
- Table 9: Global SPECT Industry Revenue Million Forecast, by Country 2019 & 2032
- Table 10: Germany SPECT Industry Revenue (Million) Forecast, by Application 2019 & 2032
- Table 11: United Kingdom SPECT Industry Revenue (Million) Forecast, by Application 2019 & 2032
- Table 12: France SPECT Industry Revenue (Million) Forecast, by Application 2019 & 2032
- Table 13: Italy SPECT Industry Revenue (Million) Forecast, by Application 2019 & 2032
- Table 14: Spain SPECT Industry Revenue (Million) Forecast, by Application 2019 & 2032
- Table 15: Rest of Europe SPECT Industry Revenue (Million) Forecast, by Application 2019 & 2032
- Table 16: Global SPECT Industry Revenue Million Forecast, by Country 2019 & 2032
- Table 17: China SPECT Industry Revenue (Million) Forecast, by Application 2019 & 2032
- Table 18: Japan SPECT Industry Revenue (Million) Forecast, by Application 2019 & 2032
- Table 19: India SPECT Industry Revenue (Million) Forecast, by Application 2019 & 2032
- Table 20: Australia SPECT Industry Revenue (Million) Forecast, by Application 2019 & 2032
- Table 21: South Korea SPECT Industry Revenue (Million) Forecast, by Application 2019 & 2032
- Table 22: Rest of Asia Pacific SPECT Industry Revenue (Million) Forecast, by Application 2019 & 2032
- Table 23: Global SPECT Industry Revenue Million Forecast, by Country 2019 & 2032
- Table 24: GCC SPECT Industry Revenue (Million) Forecast, by Application 2019 & 2032
- Table 25: South Africa SPECT Industry Revenue (Million) Forecast, by Application 2019 & 2032
- Table 26: Rest of Middle East and Africa SPECT Industry Revenue (Million) Forecast, by Application 2019 & 2032
- Table 27: Global SPECT Industry Revenue Million Forecast, by Country 2019 & 2032
- Table 28: Brazil SPECT Industry Revenue (Million) Forecast, by Application 2019 & 2032
- Table 29: Argentina SPECT Industry Revenue (Million) Forecast, by Application 2019 & 2032
- Table 30: Rest of South America SPECT Industry Revenue (Million) Forecast, by Application 2019 & 2032
- Table 31: Global SPECT Industry Revenue Million Forecast, by Type of Radioisotopes 2019 & 2032
- Table 32: Global SPECT Industry Revenue Million Forecast, by Application 2019 & 2032
- Table 33: Global SPECT Industry Revenue Million Forecast, by Country 2019 & 2032
- Table 34: United States SPECT Industry Revenue (Million) Forecast, by Application 2019 & 2032
- Table 35: Canada SPECT Industry Revenue (Million) Forecast, by Application 2019 & 2032
- Table 36: Mexico SPECT Industry Revenue (Million) Forecast, by Application 2019 & 2032
- Table 37: Global SPECT Industry Revenue Million Forecast, by Type of Radioisotopes 2019 & 2032
- Table 38: Global SPECT Industry Revenue Million Forecast, by Application 2019 & 2032
- Table 39: Global SPECT Industry Revenue Million Forecast, by Country 2019 & 2032
- Table 40: Germany SPECT Industry Revenue (Million) Forecast, by Application 2019 & 2032
- Table 41: United Kingdom SPECT Industry Revenue (Million) Forecast, by Application 2019 & 2032
- Table 42: France SPECT Industry Revenue (Million) Forecast, by Application 2019 & 2032
- Table 43: Italy SPECT Industry Revenue (Million) Forecast, by Application 2019 & 2032
- Table 44: Spain SPECT Industry Revenue (Million) Forecast, by Application 2019 & 2032
- Table 45: Rest of Europe SPECT Industry Revenue (Million) Forecast, by Application 2019 & 2032
- Table 46: Global SPECT Industry Revenue Million Forecast, by Type of Radioisotopes 2019 & 2032
- Table 47: Global SPECT Industry Revenue Million Forecast, by Application 2019 & 2032
- Table 48: Global SPECT Industry Revenue Million Forecast, by Country 2019 & 2032
- Table 49: China SPECT Industry Revenue (Million) Forecast, by Application 2019 & 2032
- Table 50: Japan SPECT Industry Revenue (Million) Forecast, by Application 2019 & 2032
- Table 51: India SPECT Industry Revenue (Million) Forecast, by Application 2019 & 2032
- Table 52: Australia SPECT Industry Revenue (Million) Forecast, by Application 2019 & 2032
- Table 53: South Korea SPECT Industry Revenue (Million) Forecast, by Application 2019 & 2032
- Table 54: Rest of Asia Pacific SPECT Industry Revenue (Million) Forecast, by Application 2019 & 2032
- Table 55: Global SPECT Industry Revenue Million Forecast, by Type of Radioisotopes 2019 & 2032
- Table 56: Global SPECT Industry Revenue Million Forecast, by Application 2019 & 2032
- Table 57: Global SPECT Industry Revenue Million Forecast, by Country 2019 & 2032
- Table 58: GCC SPECT Industry Revenue (Million) Forecast, by Application 2019 & 2032
- Table 59: South Africa SPECT Industry Revenue (Million) Forecast, by Application 2019 & 2032
- Table 60: Rest of Middle East and Africa SPECT Industry Revenue (Million) Forecast, by Application 2019 & 2032
- Table 61: Global SPECT Industry Revenue Million Forecast, by Type of Radioisotopes 2019 & 2032
- Table 62: Global SPECT Industry Revenue Million Forecast, by Application 2019 & 2032
- Table 63: Global SPECT Industry Revenue Million Forecast, by Country 2019 & 2032
- Table 64: Brazil SPECT Industry Revenue (Million) Forecast, by Application 2019 & 2032
- Table 65: Argentina SPECT Industry Revenue (Million) Forecast, by Application 2019 & 2032
- Table 66: Rest of South America SPECT Industry Revenue (Million) Forecast, by Application 2019 & 2032
Frequently Asked Questions
1. What is the projected Compound Annual Growth Rate (CAGR) of the SPECT Industry?
The projected CAGR is approximately 3.20%.
2. Which companies are prominent players in the SPECT Industry?
Key companies in the market include Bracco Imaging, Global Medical Solutions, Neusoft Corporation*List Not Exhaustive, Cardinal Health Inc, Spectrum Dynamics Medical, Guerbet, NTP Radioisotopes SOC Ltd, Lantheus Medical Imaging Inc, Gamma Medica Inc, GE Healthcare (GE Company), Curium, Digirad Corporation.
3. What are the main segments of the SPECT Industry?
The market segments include Type of Radioisotopes, Application.
4. Can you provide details about the market size?
The market size is estimated to be USD 2.23 Million as of 2022.
5. What are some drivers contributing to market growth?
Increasing Demand for SPECT Analysis in Radiopharmaceuticals; Growing Geriatric Population; Improvements in SPECT Imaging Technology.
6. What are the notable trends driving market growth?
The Gallium-67 Segment is Expected to Witness a Large CAGR Over the Forecast Period in the Single Photon Emission Computed Tomography (SPECT) Market.
7. Are there any restraints impacting market growth?
Shorter Half-life of Radioisotopes; Stringent Regulatory Guidelines.
8. Can you provide examples of recent developments in the market?
N/A
9. What pricing options are available for accessing the report?
Pricing options include single-user, multi-user, and enterprise licenses priced at USD 4750, USD 5250, and USD 8750 respectively.
10. Is the market size provided in terms of value or volume?
The market size is provided in terms of value, measured in Million.
11. Are there any specific market keywords associated with the report?
Yes, the market keyword associated with the report is "SPECT Industry," which aids in identifying and referencing the specific market segment covered.
12. How do I determine which pricing option suits my needs best?
The pricing options vary based on user requirements and access needs. Individual users may opt for single-user licenses, while businesses requiring broader access may choose multi-user or enterprise licenses for cost-effective access to the report.
13. Are there any additional resources or data provided in the SPECT Industry report?
While the report offers comprehensive insights, it's advisable to review the specific contents or supplementary materials provided to ascertain if additional resources or data are available.
14. How can I stay updated on further developments or reports in the SPECT Industry?
To stay informed about further developments, trends, and reports in the SPECT Industry, consider subscribing to industry newsletters, following relevant companies and organizations, or regularly checking reputable industry news sources and publications.
Methodology
Step 1 - Identification of Relevant Samples Size from Population Database


Step 2 - Approaches for Defining Global Market Size (Value, Volume* & Price*)

Note*: In applicable scenarios
Step 3 - Data Sources
Primary Research
- Web Analytics
- Survey Reports
- Research Institute
- Latest Research Reports
- Opinion Leaders
Secondary Research
- Annual Reports
- White Paper
- Latest Press Release
- Industry Association
- Paid Database
- Investor Presentations

Step 4 - Data Triangulation
Involves using different sources of information in order to increase the validity of a study
These sources are likely to be stakeholders in a program - participants, other researchers, program staff, other community members, and so on.
Then we put all data in single framework & apply various statistical tools to find out the dynamic on the market.
During the analysis stage, feedback from the stakeholder groups would be compared to determine areas of agreement as well as areas of divergence
