

Key Insights
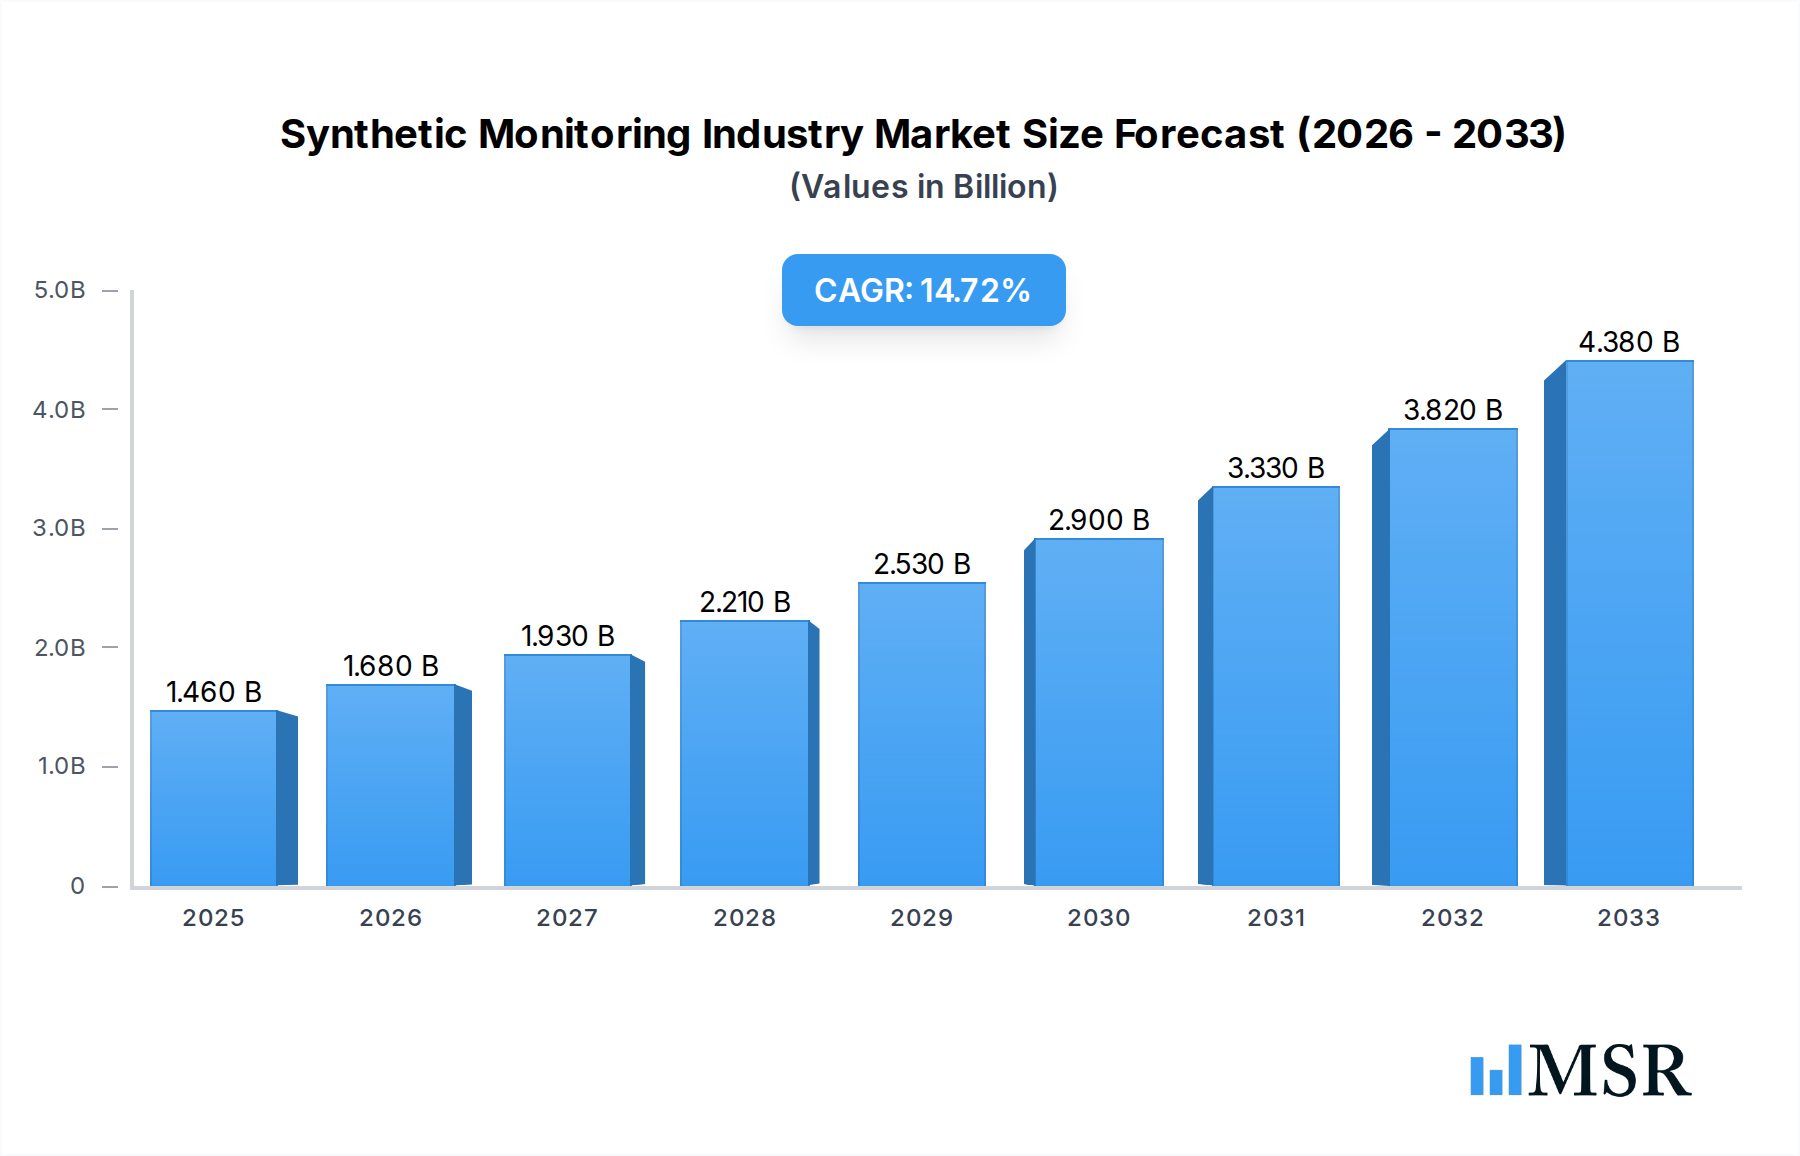
The Synthetic Monitoring market is poised for significant expansion, projected to reach USD 1.46 billion by 2025, with a robust Compound Annual Growth Rate (CAGR) of 15.3% expected throughout the forecast period of 2025-2033. This rapid growth is fueled by an increasing demand for proactive application performance management and a heightened emphasis on delivering seamless digital experiences. Key drivers for this surge include the escalating complexity of IT infrastructures, the proliferation of cloud-native applications, and the critical need for businesses to maintain high levels of availability and responsiveness across their digital services. Organizations across various sectors are recognizing synthetic monitoring not just as a diagnostic tool, but as a strategic imperative for ensuring customer satisfaction and mitigating potential revenue losses due to performance issues.

Synthetic Monitoring Industry Market Size (In Billion)
Emerging trends such as the integration of AI and machine learning for intelligent anomaly detection and predictive analytics are further accelerating market adoption. These advanced capabilities allow businesses to not only identify but also anticipate performance bottlenecks before they impact end-users. The market is segmented across various monitoring types, including API Monitoring, Website Monitoring, and Mobile Application Monitoring, catering to a diverse range of industry verticals such as BFSI, IT and Telecommunication, Retail, Government, Manufacturing and Automotive, and Military and Defense. While the market demonstrates strong growth, potential restraints such as the initial cost of implementation and the need for specialized expertise could pose challenges, but are increasingly being addressed by cloud-based, scalable solutions and enhanced platform usability.
Synthetic Monitoring Industry Company Market Share
Unlocking Digital Performance: Comprehensive Synthetic Monitoring Industry Market Report (2019-2033)
This definitive Synthetic Monitoring Industry report provides an in-depth analysis of the global market landscape, meticulously examining key players, emerging trends, and future growth projections from the historical period of 2019-2024 through to the forecast period of 2025-2033, with 2025 serving as the base year and estimated year. Discover actionable insights for IT leaders, application performance management (APM) professionals, and business strategists navigating the critical domain of synthetic monitoring solutions. Dive into the evolving needs of BFSI, IT and Telecommunication, Retail, Government, Manufacturing and Automotive, Military and Defense, and other sectors as they prioritize seamless digital experiences. This report is your essential guide to understanding the multi-billion dollar synthetic monitoring market, its competitive dynamics, and the technological innovations shaping its trajectory.
Synthetic Monitoring Industry Market Concentration & Dynamics
The synthetic monitoring market exhibits a dynamic concentration, driven by continuous innovation and strategic partnerships among key players. While the market is home to established giants and agile innovators, the landscape is evolving. The innovation ecosystem is fueled by cloud adoption, the rise of microservices architectures, and the increasing demand for proactive application performance insights. Regulatory frameworks, particularly in the BFSI and Government sectors, influence the adoption of robust monitoring solutions to ensure compliance and data security. Substitute products, such as real user monitoring (RUM), complement synthetic monitoring, creating a holistic approach to application performance management. End-user trends point towards a growing reliance on flawless digital customer experiences, driving the adoption of comprehensive monitoring strategies. Merger and acquisition (M&A) activities are prevalent as larger entities seek to consolidate their offerings and expand market reach. For instance, strategic acquisitions are common, reflecting a market where companies like HP Enterprise Company, IBM Corporation, New Relic Inc, AppDynamics Inc (Cisco Systems Inc ), Rigor Inc, Smart Bear Software Inc, Broadcom Inc, BMC Software Inc, Monitis Inc, Oracle Corporation, Apica AB, Dell Technologies Inc, Dynatrace LLC, and SolarWinds Inc vie for dominance. The synthetic monitoring market size is projected to reach hundreds of billions by the end of the forecast period. M&A deal counts have been steadily increasing, indicating consolidation and strategic consolidation.
Synthetic Monitoring Industry Industry Insights & Trends
The synthetic monitoring industry is experiencing robust growth, propelled by several critical market growth drivers. The escalating demand for impeccable digital experiences across all customer touchpoints is a primary catalyst. As businesses increasingly rely on their online presence and digital services, ensuring optimal performance, availability, and responsiveness of websites, APIs, and mobile applications has become paramount. This necessitates proactive monitoring to identify and resolve potential issues before they impact end-users. Technological disruptions, such as the widespread adoption of cloud-native architectures, microservices, and serverless computing, introduce complexity into application environments. Synthetic monitoring solutions are crucial for validating the performance and availability of these distributed systems. Furthermore, the proliferation of mobile devices and the rise of the Internet of Things (IoT) have expanded the scope of digital interactions, requiring comprehensive monitoring across diverse platforms and devices. Evolving consumer behaviors, characterized by a low tolerance for downtime and poor performance, directly translate into a heightened need for sophisticated monitoring tools. Consumers expect instant access to services and applications, and any degradation in experience can lead to churn. The global synthetic monitoring market size is estimated to be in the tens of billions in the base year, with a projected Compound Annual Growth Rate (CAGR) of over 15% throughout the forecast period. The increasing adoption of AI and machine learning within synthetic monitoring platforms is enabling more intelligent anomaly detection and root cause analysis, further enhancing the value proposition for businesses. The integration of synthetic monitoring with other observability tools, such as APM and RUM, is creating a unified view of application performance, which is a significant trend. The expansion of e-commerce and digital transformation initiatives across industries like BFSI, Retail, and IT and Telecommunication are significant market expansion drivers.
Key Markets & Segments Leading Synthetic Monitoring Industry
The synthetic monitoring industry is witnessing dominant growth across specific segments and regions, driven by distinct economic and infrastructural factors.
Dominant Segment by Type:
- API Monitoring: This segment is leading the charge due to the critical role of APIs in modern application architectures, powering everything from microservices communication to third-party integrations. The increasing complexity and interconnectedness of digital services make API uptime and performance non-negotiable. API Monitoring is crucial for ensuring seamless data exchange and service availability, directly impacting business operations.
- Website Monitoring: As the primary digital storefront for most organizations, website availability and performance remain paramount. Fluctuations in website speed or uptime directly affect customer acquisition, conversion rates, and brand reputation. The continued growth of e-commerce and online service delivery reinforces the importance of robust Website Monitoring.
- Mobile Application Monitoring: With the ubiquitous use of smartphones, the performance of mobile applications is a direct reflection of a company's digital engagement strategy. Poor mobile app performance leads to user dissatisfaction and churn, making Mobile Application Monitoring a high-priority segment, especially for Retail and BFSI sectors.
Dominant Segment by End-User Vertical:
- BFSI (Banking, Financial Services, and Insurance): This vertical is a frontrunner due to the highly regulated nature of the industry, the critical need for uninterrupted service availability, and the sensitive nature of financial transactions. Downtime can result in significant financial losses and severe regulatory penalties. BFSI relies heavily on API Monitoring for inter-system communication and Website Monitoring for customer portals.
- IT and Telecommunication: This sector is both a provider and a heavy user of digital services. The constant evolution of network infrastructure, cloud services, and software applications necessitates rigorous monitoring to ensure reliability and performance for their own operations and their end customers. IT and Telecommunication utilizes all types of synthetic monitoring extensively.
- Retail: The rise of e-commerce and omnichannel strategies has made online presence and seamless shopping experiences critical for Retail businesses. Any performance degradation on websites or mobile apps directly impacts sales and customer loyalty. Retail is a significant adopter of Website Monitoring and Mobile Application Monitoring.
Geographic Dominance: North America and Europe currently lead the synthetic monitoring market, driven by the early adoption of advanced technologies, significant investments in digital transformation, and a mature regulatory environment. However, the Asia-Pacific region is poised for substantial growth due to rapid digitalization, increasing internet penetration, and a burgeoning IT sector. Economic growth, extensive digital infrastructure, and government initiatives supporting technological advancements are key drivers in these leading regions.
Synthetic Monitoring Industry Product Developments
The synthetic monitoring industry is characterized by continuous product innovation focused on enhancing proactive performance insights and user experience. Recent advancements include the integration of AI and machine learning for more intelligent anomaly detection and predictive analytics, enabling businesses to anticipate issues before they impact users. Enhanced capabilities in simulating complex user journeys across various devices and network conditions are crucial for ensuring consistent digital experiences. Furthermore, the development of sophisticated dashboards and real-time reporting tools provides IT teams with actionable data for quick troubleshooting and performance optimization. These technological advancements equip organizations with the competitive edge needed to deliver superior digital services.
Challenges in the Synthetic Monitoring Industry Market
Despite robust growth, the synthetic monitoring industry market faces several challenges. The increasing complexity of modern IT infrastructures, including hybrid cloud environments and microservices, makes comprehensive monitoring more challenging. Maintaining accurate and up-to-date synthetic test scripts that reflect real-world user behavior requires continuous effort and specialized skills. The high volume of data generated by monitoring tools can lead to alert fatigue if not managed effectively, potentially causing critical issues to be overlooked. Furthermore, the cost of sophisticated synthetic monitoring solutions can be a barrier for small and medium-sized enterprises (SMEs). Fierce competition among vendors also puts pressure on pricing and necessitates constant innovation to maintain market share.
Forces Driving Synthetic Monitoring Industry Growth
Several powerful forces are propelling the growth of the synthetic monitoring industry. The relentless pursuit of exceptional digital customer experiences is a primary driver, as businesses understand that performance directly impacts customer satisfaction, loyalty, and revenue. The accelerating pace of digital transformation across all sectors, from BFSI to Manufacturing and Automotive, necessitates robust tools to ensure the reliability of new digital services and platforms. Technological advancements, including the proliferation of cloud computing, IoT, and mobile technologies, create more complex environments that demand proactive monitoring. Additionally, the increasing focus on compliance and regulatory requirements, particularly in highly regulated industries, compels organizations to adopt advanced monitoring solutions to ensure service availability and data integrity.
Challenges in the Synthetic Monitoring Industry Market
The long-term growth of the synthetic monitoring industry is underpinned by several catalysts. Continuous innovation in AI and machine learning is enabling more sophisticated predictive analytics and autonomous issue resolution, enhancing the value proposition of synthetic monitoring. Strategic partnerships between synthetic monitoring vendors and other IT service providers are expanding market reach and offering integrated solutions. The growing adoption of synthetic monitoring in emerging markets, driven by increasing digital investments and the need for reliable online services, presents significant expansion opportunities. Furthermore, the evolution of testing methodologies to encompass new technologies like blockchain and augmented reality will fuel future market expansion.
Emerging Opportunities in Synthetic Monitoring Industry
The synthetic monitoring industry is ripe with emerging opportunities. The increasing adoption of DevOps and SRE (Site Reliability Engineering) practices is creating a demand for integrated synthetic monitoring solutions within CI/CD pipelines, enabling continuous performance validation. The expansion of the IoT ecosystem presents a vast untapped market for monitoring the performance and availability of connected devices and their associated cloud services. Furthermore, the growing trend of personalized digital experiences necessitates synthetic monitoring solutions that can simulate and validate these tailored user journeys. The rise of headless CMS and progressive web apps also opens new avenues for specialized synthetic monitoring.
Leading Players in the Synthetic Monitoring Industry Sector
- HP Enterprise Company
- IBM Corporation
- New Relic Inc
- AppDynamics Inc (Cisco Systems Inc )
- Rigor Inc
- Smart Bear Software Inc
- Broadcom Inc
- BMC Software Inc
- Monitis Inc
- Oracle Corporation
- Apica AB
- Dell Technologies Inc
- Dynatrace LLC
- SolarWinds Inc
Key Milestones in Synthetic Monitoring Industry Industry
- December 2022: Broadcom Inc. announced the availability of a new solution that enables enterprises to store their mainframe data anywhere they choose, including the Cloud. Broadcom's CA 1 flexible storage solution provides secure, cost-effective mainframe data storage options for hybrid IT environments, enabling customers to achieve dramatic cost savings and protect against ransomware.
- June 2022: SmartBear Software announced it added web browser testing capabilities into its next-gen mobile app testing platform, BitBar, which offers the most reliable and streamlined cloud-based testing available with instant access to all the latest browsers and devices to support a consistent digital customer experience. BitBar is highly scalable and performant, supporting the diversity of all test automation frameworks, environments, and languages that software testers use today, tomorrow, and in the future. For testing teams responsible for ensuring a consistent, high-quality experience of customers' applications, BitBar enables them to quickly and securely test across real browsers and devices without the burden of maintaining in-house.
Strategic Outlook for Synthetic Monitoring Industry Market
The strategic outlook for the synthetic monitoring industry market is exceptionally positive, driven by the imperative for robust digital performance and user experience. Future growth will be fueled by the integration of AI-powered analytics for proactive issue detection and resolution, as well as the expansion of synthetic monitoring capabilities to encompass emerging technologies like blockchain and edge computing. Strategic partnerships and collaborations will be key for vendors to offer comprehensive observability solutions. The increasing demand from rapidly digitizing economies, particularly in the Asia-Pacific region, presents significant market expansion opportunities. Companies that can offer scalable, intelligent, and cost-effective synthetic monitoring solutions tailored to the evolving needs of diverse industries will be well-positioned for sustained success. The focus will remain on empowering businesses to deliver flawless digital experiences in an increasingly complex technological landscape.
Synthetic Monitoring Industry Segmentation
-
1. Type
- 1.1. API Monitoring
- 1.2. Website Monitoring
- 1.3. Mobile Application Monitoring
-
2. End-User Vertical
- 2.1. BFSI
- 2.2. IT and Telecommunication
- 2.3. Retail
- 2.4. Government
- 2.5. Manufacturing and Automotive
- 2.6. Military and Defense
- 2.7. Other End-user Verticals
Synthetic Monitoring Industry Segmentation By Geography
- 1. North America
- 2. Europe
- 3. Asia Pacific
- 4. Latin America
- 5. Middle East and Africa
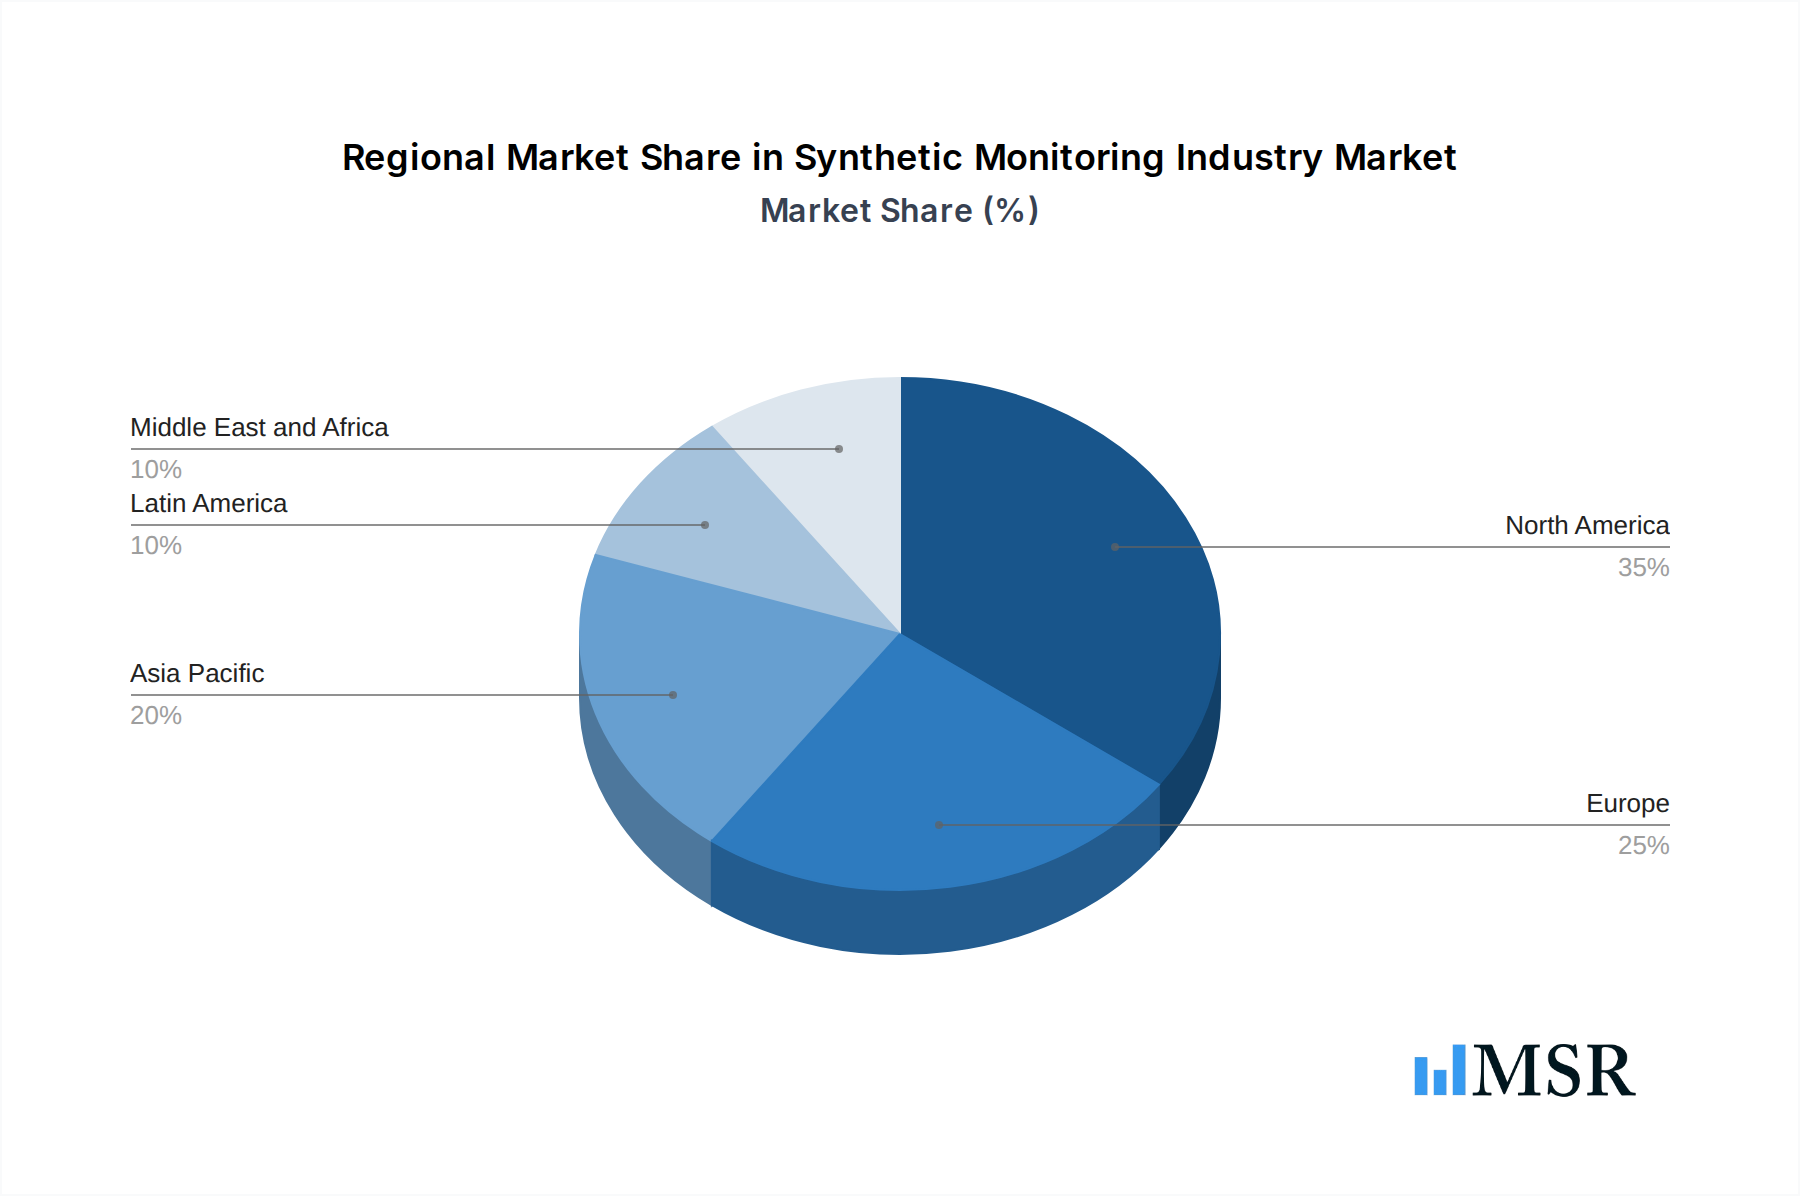
Synthetic Monitoring Industry Regional Market Share
Geographic Coverage of Synthetic Monitoring Industry
Synthetic Monitoring Industry REPORT HIGHLIGHTS
| Aspects | Details |
|---|---|
| Study Period | 2020-2034 |
| Base Year | 2025 |
| Estimated Year | 2026 |
| Forecast Period | 2026-2034 |
| Historical Period | 2020-2025 |
| Growth Rate | CAGR of 15.3% from 2020-2034 |
| Segmentation |
|
Table of Contents
- 1. Introduction
- 1.1. Research Scope
- 1.2. Market Segmentation
- 1.3. Research Objective
- 1.4. Definitions and Assumptions
- 2. Executive Summary
- 2.1. Market Snapshot
- 3. Market Dynamics
- 3.1. Market Drivers
- 3.2. Market Restrains
- 3.3. Market Trends
- 3.4. Market Opportunities
- 4. Market Factor Analysis
- 4.1. Porters Five Forces
- 4.1.1. Bargaining Power of Suppliers
- 4.1.2. Bargaining Power of Buyers
- 4.1.3. Threat of New Entrants
- 4.1.4. Threat of Substitutes
- 4.1.5. Competitive Rivalry
- 4.2. PESTEL analysis
- 4.3. BCG Analysis
- 4.3.1. Stars (High Growth, High Market Share)
- 4.3.2. Cash Cows (Low Growth, High Market Share)
- 4.3.3. Question Mark (High Growth, Low Market Share)
- 4.3.4. Dogs (Low Growth, Low Market Share)
- 4.4. Ansoff Matrix Analysis
- 4.5. Supply Chain Analysis
- 4.6. Regulatory Landscape
- 4.7. Current Market Potential and Opportunity Assessment (TAM–SAM–SOM Framework)
- 4.8. MSR Analyst Note
- 4.1. Porters Five Forces
- 5. Market Analysis, Insights and Forecast 2021-2033
- 5.1. Market Analysis, Insights and Forecast - by Type
- 5.1.1. API Monitoring
- 5.1.2. Website Monitoring
- 5.1.3. Mobile Application Monitoring
- 5.2. Market Analysis, Insights and Forecast - by End-User Vertical
- 5.2.1. BFSI
- 5.2.2. IT and Telecommunication
- 5.2.3. Retail
- 5.2.4. Government
- 5.2.5. Manufacturing and Automotive
- 5.2.6. Military and Defense
- 5.2.7. Other End-user Verticals
- 5.3. Market Analysis, Insights and Forecast - by Region
- 5.3.1. North America
- 5.3.2. Europe
- 5.3.3. Asia Pacific
- 5.3.4. Latin America
- 5.3.5. Middle East and Africa
- 5.1. Market Analysis, Insights and Forecast - by Type
- 6. Global Synthetic Monitoring Industry Analysis, Insights and Forecast, 2021-2033
- 6.1. Market Analysis, Insights and Forecast - by Type
- 6.1.1. API Monitoring
- 6.1.2. Website Monitoring
- 6.1.3. Mobile Application Monitoring
- 6.2. Market Analysis, Insights and Forecast - by End-User Vertical
- 6.2.1. BFSI
- 6.2.2. IT and Telecommunication
- 6.2.3. Retail
- 6.2.4. Government
- 6.2.5. Manufacturing and Automotive
- 6.2.6. Military and Defense
- 6.2.7. Other End-user Verticals
- 6.1. Market Analysis, Insights and Forecast - by Type
- 7. North America Synthetic Monitoring Industry Analysis, Insights and Forecast, 2020-2032
- 7.1. Market Analysis, Insights and Forecast - by Type
- 7.1.1. API Monitoring
- 7.1.2. Website Monitoring
- 7.1.3. Mobile Application Monitoring
- 7.2. Market Analysis, Insights and Forecast - by End-User Vertical
- 7.2.1. BFSI
- 7.2.2. IT and Telecommunication
- 7.2.3. Retail
- 7.2.4. Government
- 7.2.5. Manufacturing and Automotive
- 7.2.6. Military and Defense
- 7.2.7. Other End-user Verticals
- 7.1. Market Analysis, Insights and Forecast - by Type
- 8. Europe Synthetic Monitoring Industry Analysis, Insights and Forecast, 2020-2032
- 8.1. Market Analysis, Insights and Forecast - by Type
- 8.1.1. API Monitoring
- 8.1.2. Website Monitoring
- 8.1.3. Mobile Application Monitoring
- 8.2. Market Analysis, Insights and Forecast - by End-User Vertical
- 8.2.1. BFSI
- 8.2.2. IT and Telecommunication
- 8.2.3. Retail
- 8.2.4. Government
- 8.2.5. Manufacturing and Automotive
- 8.2.6. Military and Defense
- 8.2.7. Other End-user Verticals
- 8.1. Market Analysis, Insights and Forecast - by Type
- 9. Asia Pacific Synthetic Monitoring Industry Analysis, Insights and Forecast, 2020-2032
- 9.1. Market Analysis, Insights and Forecast - by Type
- 9.1.1. API Monitoring
- 9.1.2. Website Monitoring
- 9.1.3. Mobile Application Monitoring
- 9.2. Market Analysis, Insights and Forecast - by End-User Vertical
- 9.2.1. BFSI
- 9.2.2. IT and Telecommunication
- 9.2.3. Retail
- 9.2.4. Government
- 9.2.5. Manufacturing and Automotive
- 9.2.6. Military and Defense
- 9.2.7. Other End-user Verticals
- 9.1. Market Analysis, Insights and Forecast - by Type
- 10. Latin America Synthetic Monitoring Industry Analysis, Insights and Forecast, 2020-2032
- 10.1. Market Analysis, Insights and Forecast - by Type
- 10.1.1. API Monitoring
- 10.1.2. Website Monitoring
- 10.1.3. Mobile Application Monitoring
- 10.2. Market Analysis, Insights and Forecast - by End-User Vertical
- 10.2.1. BFSI
- 10.2.2. IT and Telecommunication
- 10.2.3. Retail
- 10.2.4. Government
- 10.2.5. Manufacturing and Automotive
- 10.2.6. Military and Defense
- 10.2.7. Other End-user Verticals
- 10.1. Market Analysis, Insights and Forecast - by Type
- 11. Middle East and Africa Synthetic Monitoring Industry Analysis, Insights and Forecast, 2020-2032
- 11.1. Market Analysis, Insights and Forecast - by Type
- 11.1.1. API Monitoring
- 11.1.2. Website Monitoring
- 11.1.3. Mobile Application Monitoring
- 11.2. Market Analysis, Insights and Forecast - by End-User Vertical
- 11.2.1. BFSI
- 11.2.2. IT and Telecommunication
- 11.2.3. Retail
- 11.2.4. Government
- 11.2.5. Manufacturing and Automotive
- 11.2.6. Military and Defense
- 11.2.7. Other End-user Verticals
- 11.1. Market Analysis, Insights and Forecast - by Type
- 12. Competitive Analysis
- 12.1. Company Profiles
- 12.1.1 HP Enterprise Company
- 12.1.1.1. Company Overview
- 12.1.1.2. Products
- 12.1.1.3. Company Financials
- 12.1.1.4. SWOT Analysis
- 12.1.2 IBM Corporation
- 12.1.2.1. Company Overview
- 12.1.2.2. Products
- 12.1.2.3. Company Financials
- 12.1.2.4. SWOT Analysis
- 12.1.3 New Relic Inc
- 12.1.3.1. Company Overview
- 12.1.3.2. Products
- 12.1.3.3. Company Financials
- 12.1.3.4. SWOT Analysis
- 12.1.4 AppDynamics Inc (Cisco Systems Inc )
- 12.1.4.1. Company Overview
- 12.1.4.2. Products
- 12.1.4.3. Company Financials
- 12.1.4.4. SWOT Analysis
- 12.1.5 Rigor Inc
- 12.1.5.1. Company Overview
- 12.1.5.2. Products
- 12.1.5.3. Company Financials
- 12.1.5.4. SWOT Analysis
- 12.1.6 Smart Bear Software Inc
- 12.1.6.1. Company Overview
- 12.1.6.2. Products
- 12.1.6.3. Company Financials
- 12.1.6.4. SWOT Analysis
- 12.1.7 Broadcom Inc
- 12.1.7.1. Company Overview
- 12.1.7.2. Products
- 12.1.7.3. Company Financials
- 12.1.7.4. SWOT Analysis
- 12.1.8 BMC Software Inc
- 12.1.8.1. Company Overview
- 12.1.8.2. Products
- 12.1.8.3. Company Financials
- 12.1.8.4. SWOT Analysis
- 12.1.9 Monitis Inc
- 12.1.9.1. Company Overview
- 12.1.9.2. Products
- 12.1.9.3. Company Financials
- 12.1.9.4. SWOT Analysis
- 12.1.10 Oracle Corporation
- 12.1.10.1. Company Overview
- 12.1.10.2. Products
- 12.1.10.3. Company Financials
- 12.1.10.4. SWOT Analysis
- 12.1.11 Apica AB
- 12.1.11.1. Company Overview
- 12.1.11.2. Products
- 12.1.11.3. Company Financials
- 12.1.11.4. SWOT Analysis
- 12.1.12 Dell Technologies Inc
- 12.1.12.1. Company Overview
- 12.1.12.2. Products
- 12.1.12.3. Company Financials
- 12.1.12.4. SWOT Analysis
- 12.1.13 Dynatrace LLC
- 12.1.13.1. Company Overview
- 12.1.13.2. Products
- 12.1.13.3. Company Financials
- 12.1.13.4. SWOT Analysis
- 12.1.14 SolarWinds Inc
- 12.1.14.1. Company Overview
- 12.1.14.2. Products
- 12.1.14.3. Company Financials
- 12.1.14.4. SWOT Analysis
- 12.1.1 HP Enterprise Company
- 12.2. Market Entropy
- 12.2.1 Company's Key Areas Served
- 12.2.2 Recent Developments
- 12.3. Company Market Share Analysis 2025
- 12.3.1 Top 5 Companies Market Share Analysis
- 12.3.2 Top 3 Companies Market Share Analysis
- 12.4. List of Potential Customers
- 13. Research Methodology
List of Figures
- Figure 1: Global Synthetic Monitoring Industry Revenue Breakdown (billion, %) by Region 2025 & 2033
- Figure 2: North America Synthetic Monitoring Industry Revenue (billion), by Type 2025 & 2033
- Figure 3: North America Synthetic Monitoring Industry Revenue Share (%), by Type 2025 & 2033
- Figure 4: North America Synthetic Monitoring Industry Revenue (billion), by End-User Vertical 2025 & 2033
- Figure 5: North America Synthetic Monitoring Industry Revenue Share (%), by End-User Vertical 2025 & 2033
- Figure 6: North America Synthetic Monitoring Industry Revenue (billion), by Country 2025 & 2033
- Figure 7: North America Synthetic Monitoring Industry Revenue Share (%), by Country 2025 & 2033
- Figure 8: Europe Synthetic Monitoring Industry Revenue (billion), by Type 2025 & 2033
- Figure 9: Europe Synthetic Monitoring Industry Revenue Share (%), by Type 2025 & 2033
- Figure 10: Europe Synthetic Monitoring Industry Revenue (billion), by End-User Vertical 2025 & 2033
- Figure 11: Europe Synthetic Monitoring Industry Revenue Share (%), by End-User Vertical 2025 & 2033
- Figure 12: Europe Synthetic Monitoring Industry Revenue (billion), by Country 2025 & 2033
- Figure 13: Europe Synthetic Monitoring Industry Revenue Share (%), by Country 2025 & 2033
- Figure 14: Asia Pacific Synthetic Monitoring Industry Revenue (billion), by Type 2025 & 2033
- Figure 15: Asia Pacific Synthetic Monitoring Industry Revenue Share (%), by Type 2025 & 2033
- Figure 16: Asia Pacific Synthetic Monitoring Industry Revenue (billion), by End-User Vertical 2025 & 2033
- Figure 17: Asia Pacific Synthetic Monitoring Industry Revenue Share (%), by End-User Vertical 2025 & 2033
- Figure 18: Asia Pacific Synthetic Monitoring Industry Revenue (billion), by Country 2025 & 2033
- Figure 19: Asia Pacific Synthetic Monitoring Industry Revenue Share (%), by Country 2025 & 2033
- Figure 20: Latin America Synthetic Monitoring Industry Revenue (billion), by Type 2025 & 2033
- Figure 21: Latin America Synthetic Monitoring Industry Revenue Share (%), by Type 2025 & 2033
- Figure 22: Latin America Synthetic Monitoring Industry Revenue (billion), by End-User Vertical 2025 & 2033
- Figure 23: Latin America Synthetic Monitoring Industry Revenue Share (%), by End-User Vertical 2025 & 2033
- Figure 24: Latin America Synthetic Monitoring Industry Revenue (billion), by Country 2025 & 2033
- Figure 25: Latin America Synthetic Monitoring Industry Revenue Share (%), by Country 2025 & 2033
- Figure 26: Middle East and Africa Synthetic Monitoring Industry Revenue (billion), by Type 2025 & 2033
- Figure 27: Middle East and Africa Synthetic Monitoring Industry Revenue Share (%), by Type 2025 & 2033
- Figure 28: Middle East and Africa Synthetic Monitoring Industry Revenue (billion), by End-User Vertical 2025 & 2033
- Figure 29: Middle East and Africa Synthetic Monitoring Industry Revenue Share (%), by End-User Vertical 2025 & 2033
- Figure 30: Middle East and Africa Synthetic Monitoring Industry Revenue (billion), by Country 2025 & 2033
- Figure 31: Middle East and Africa Synthetic Monitoring Industry Revenue Share (%), by Country 2025 & 2033
List of Tables
- Table 1: Global Synthetic Monitoring Industry Revenue billion Forecast, by Type 2020 & 2033
- Table 2: Global Synthetic Monitoring Industry Revenue billion Forecast, by End-User Vertical 2020 & 2033
- Table 3: Global Synthetic Monitoring Industry Revenue billion Forecast, by Region 2020 & 2033
- Table 4: Global Synthetic Monitoring Industry Revenue billion Forecast, by Type 2020 & 2033
- Table 5: Global Synthetic Monitoring Industry Revenue billion Forecast, by End-User Vertical 2020 & 2033
- Table 6: Global Synthetic Monitoring Industry Revenue billion Forecast, by Country 2020 & 2033
- Table 7: Global Synthetic Monitoring Industry Revenue billion Forecast, by Type 2020 & 2033
- Table 8: Global Synthetic Monitoring Industry Revenue billion Forecast, by End-User Vertical 2020 & 2033
- Table 9: Global Synthetic Monitoring Industry Revenue billion Forecast, by Country 2020 & 2033
- Table 10: Global Synthetic Monitoring Industry Revenue billion Forecast, by Type 2020 & 2033
- Table 11: Global Synthetic Monitoring Industry Revenue billion Forecast, by End-User Vertical 2020 & 2033
- Table 12: Global Synthetic Monitoring Industry Revenue billion Forecast, by Country 2020 & 2033
- Table 13: Global Synthetic Monitoring Industry Revenue billion Forecast, by Type 2020 & 2033
- Table 14: Global Synthetic Monitoring Industry Revenue billion Forecast, by End-User Vertical 2020 & 2033
- Table 15: Global Synthetic Monitoring Industry Revenue billion Forecast, by Country 2020 & 2033
- Table 16: Global Synthetic Monitoring Industry Revenue billion Forecast, by Type 2020 & 2033
- Table 17: Global Synthetic Monitoring Industry Revenue billion Forecast, by End-User Vertical 2020 & 2033
- Table 18: Global Synthetic Monitoring Industry Revenue billion Forecast, by Country 2020 & 2033
Frequently Asked Questions
1. What is the projected Compound Annual Growth Rate (CAGR) of the Synthetic Monitoring Industry?
The projected CAGR is approximately 15.3%.
2. Which companies are prominent players in the Synthetic Monitoring Industry?
Key companies in the market include HP Enterprise Company, IBM Corporation, New Relic Inc, AppDynamics Inc (Cisco Systems Inc ), Rigor Inc, Smart Bear Software Inc, Broadcom Inc, BMC Software Inc, Monitis Inc , Oracle Corporation, Apica AB, Dell Technologies Inc, Dynatrace LLC, SolarWinds Inc.
3. What are the main segments of the Synthetic Monitoring Industry?
The market segments include Type, End-User Vertical.
4. Can you provide details about the market size?
The market size is estimated to be USD 1.46 billion as of 2022.
5. What are some drivers contributing to market growth?
Increasing Need for Monitoring Service Level Agreement (SLA) Targets; Rising Demand for Application Performance Management; Increasing Need for DevOPs.
6. What are the notable trends driving market growth?
IT and Telecommunications is Expected to Show Significant Growth.
7. Are there any restraints impacting market growth?
Increased Demand for Outsourcing and Automation in Pharmaceutical Manufacturing.
8. Can you provide examples of recent developments in the market?
December 2022: Broadcom Inc. announced the availability of a new solution that enables enterprises to store their mainframe data anywhere they choose, including the Cloud. Broadcom's CA 1 flexible storage solution provides secure, cost-effective mainframe data storage options for hybrid IT environments, enabling customers to achieve dramatic cost savings and protect against ransomware.
9. What pricing options are available for accessing the report?
Pricing options include single-user, multi-user, and enterprise licenses priced at USD 4750, USD 5250, and USD 8750 respectively.
10. Is the market size provided in terms of value or volume?
The market size is provided in terms of value, measured in billion.
11. Are there any specific market keywords associated with the report?
Yes, the market keyword associated with the report is "Synthetic Monitoring Industry," which aids in identifying and referencing the specific market segment covered.
12. How do I determine which pricing option suits my needs best?
The pricing options vary based on user requirements and access needs. Individual users may opt for single-user licenses, while businesses requiring broader access may choose multi-user or enterprise licenses for cost-effective access to the report.
13. Are there any additional resources or data provided in the Synthetic Monitoring Industry report?
While the report offers comprehensive insights, it's advisable to review the specific contents or supplementary materials provided to ascertain if additional resources or data are available.
14. How can I stay updated on further developments or reports in the Synthetic Monitoring Industry?
To stay informed about further developments, trends, and reports in the Synthetic Monitoring Industry, consider subscribing to industry newsletters, following relevant companies and organizations, or regularly checking reputable industry news sources and publications.
Methodology
Step 1 - Identification of Relevant Samples Size from Population Database


Step 2 - Approaches for Defining Global Market Size (Value, Volume* & Price*)

Note*: In applicable scenarios
Step 3 - Data Sources
Primary Research
- Web Analytics
- Survey Reports
- Research Institute
- Latest Research Reports
- Opinion Leaders
Secondary Research
- Annual Reports
- White Paper
- Latest Press Release
- Industry Association
- Paid Database
- Investor Presentations

Step 4 - Data Triangulation
Involves using different sources of information in order to increase the validity of a study
These sources are likely to be stakeholders in a program - participants, other researchers, program staff, other community members, and so on.
Then we put all data in single framework & apply various statistical tools to find out the dynamic on the market.
During the analysis stage, feedback from the stakeholder groups would be compared to determine areas of agreement as well as areas of divergence