

Key Insights
The global Water Quality Analysis Sensor market is poised for significant expansion, demonstrating robust growth driven by an increasing emphasis on environmental protection and the demand for clean water across various sectors. Valued at an estimated $5.72 billion in 2024, the market is projected to experience a compound annual growth rate (CAGR) of 6.51% throughout the forecast period (2025-2033). This growth is primarily fueled by the escalating need for accurate and real-time monitoring of water bodies to address pollution, ensure regulatory compliance, and optimize resource management in industries such as food and beverage, pharmaceuticals, agriculture, and aquaculture. Furthermore, the rising adoption of smart technologies and the Internet of Things (IoT) in water management systems is creating new avenues for advanced sensor solutions, enhancing their functionality and accessibility. The increasing prevalence of waterborne diseases and the growing awareness of public health further underpin the demand for sophisticated water quality monitoring tools.
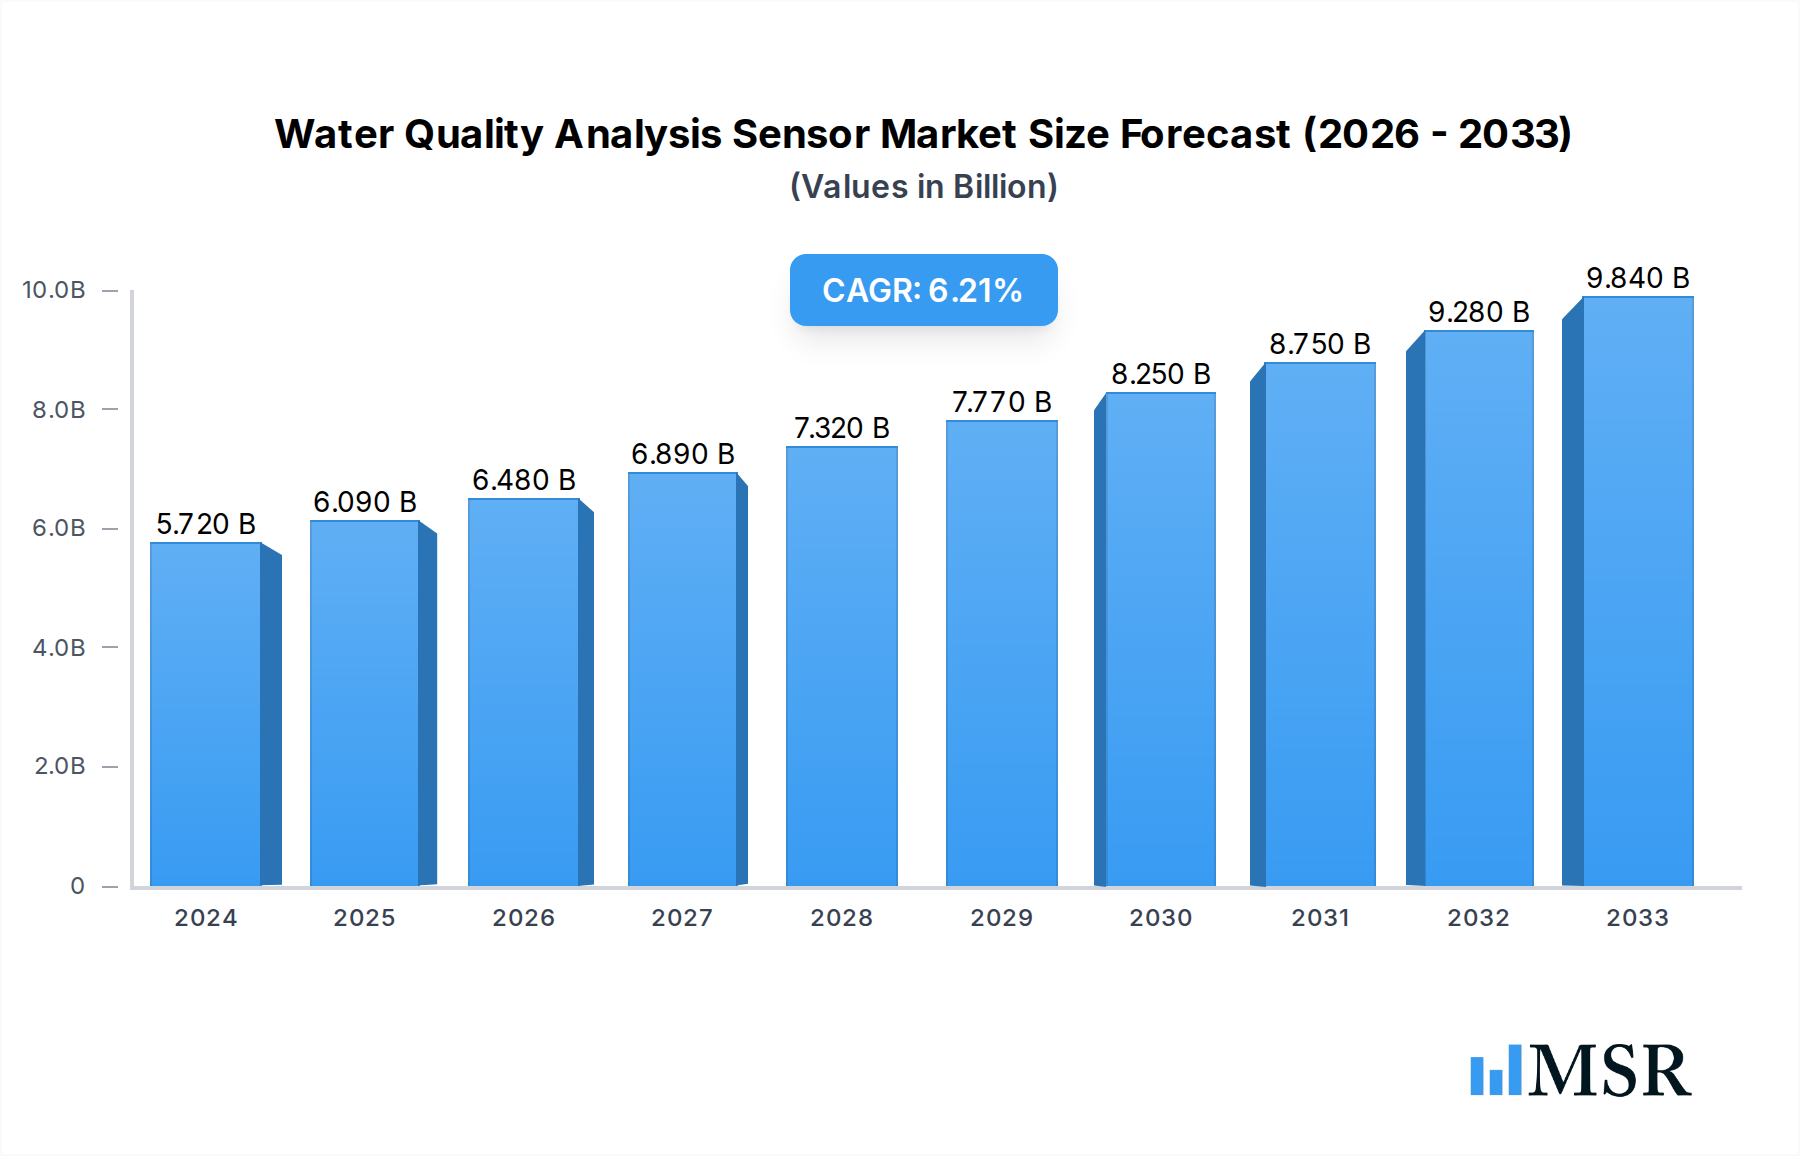
Water Quality Analysis Sensor Market Size (In Billion)
Key drivers for this market include stringent government regulations on water discharge and quality standards, coupled with the growing adoption of treated wastewater in industrial processes and irrigation. The development of more sensitive, reliable, and cost-effective sensor technologies, including combined and differential sensor types, is also contributing to market penetration. While the market presents substantial opportunities, certain restraints, such as the high initial cost of advanced sensor installations and the need for skilled personnel for operation and maintenance, may pose challenges. However, the long-term benefits of proactive water quality management and the continuous innovation in sensor technology are expected to outweigh these hurdles, paving the way for sustained market growth across diverse applications like environmental monitoring, industrial process control, and healthcare.

Water Quality Analysis Sensor Company Market Share
Water Quality Analysis Sensor Market Analysis Report: Forecast to 2033
This comprehensive report delivers an in-depth analysis of the global Water Quality Analysis Sensor market, offering critical insights for industry stakeholders. Spanning the study period of 2019–2033, with a base year of 2025 and a detailed forecast period from 2025–2033, this research provides a robust understanding of market dynamics, key trends, and future projections. Leveraging high-ranking keywords such as "water quality sensors," "environmental monitoring," "industrial water treatment," "food safety sensors," and "IoT water monitoring," this report is optimized for maximum search visibility.
Water Quality Analysis Sensor Market Concentration & Dynamics
The Water Quality Analysis Sensor market exhibits a moderate to high concentration, with key players like HACH, Endress+Hauser, and ABB dominating significant market shares. Innovation ecosystems are thriving, driven by advancements in miniaturization, wireless connectivity, and multi-parameter sensing capabilities. Regulatory frameworks, particularly concerning environmental protection and industrial discharge standards, are increasingly stringent, propelling demand for accurate and reliable sensor technologies. Substitute products, such as manual laboratory testing, continue to exist but are increasingly being displaced by the convenience and real-time data offered by advanced sensors. End-user trends are shifting towards proactive monitoring and predictive maintenance, driven by concerns for public health, food safety, and efficient industrial operations. Mergers and acquisitions (M&A) activities, estimated to be in the range of 10-15 significant deals annually, indicate a strategic consolidation aimed at expanding product portfolios and geographical reach. The market is characterized by a blend of established giants and agile, specialized sensor manufacturers.
Water Quality Analysis Sensor Industry Insights & Trends
The global Water Quality Analysis Sensor market is projected for robust growth, estimated to reach a market size of approximately $15 billion by 2033, with a Compound Annual Growth Rate (CAGR) of around 8.5% during the forecast period. This expansion is fueled by several interconnected factors. Growing global awareness and stringent regulations surrounding water pollution control and environmental sustainability are primary drivers. Industries such as chemical, pharmaceutical, and manufacturing are compelled to invest in advanced water quality monitoring systems to comply with discharge limits and optimize their processes. The increasing demand for clean and safe drinking water, coupled with the rising prevalence of waterborne diseases, further accentuates the need for accurate and real-time water quality assessment. Furthermore, the agricultural and aquaculture sectors are witnessing significant adoption of water quality sensors to improve crop yields, manage livestock health, and ensure sustainable food production. Technological advancements, including the integration of Artificial Intelligence (AI) and the Internet of Things (IoT) into sensor platforms, are enabling remote monitoring, data analytics, and predictive maintenance, thereby enhancing the efficiency and effectiveness of water quality management. The development of multi-parameter sensors that can simultaneously measure parameters like pH, dissolved oxygen, turbidity, and specific ions is also contributing to market growth by offering a more comprehensive and cost-effective solution for users. The growing emphasis on "healthy water" initiatives and the increasing consumer demand for bottled water with verified quality further stimulate the market. The transition from traditional, labor-intensive testing methods to automated, online sensor systems represents a significant market trend, driven by cost savings and improved data accuracy.
Key Markets & Segments Leading Water Quality Analysis Sensor
The Environmental friendly application segment stands out as a dominant force in the Water Quality Analysis Sensor market, driven by intensifying global environmental regulations and a growing societal imperative for sustainable practices. This segment's leadership is underpinned by substantial investments in industrial wastewater treatment, municipal water purification, and natural water body monitoring. Countries with robust environmental protection agencies and proactive government initiatives, such as those in North America and Europe, are at the forefront of this demand. For instance, the implementation of the Clean Water Act in the United States and the Water Framework Directive in the European Union have significantly boosted the adoption of advanced water quality sensors.
- Drivers in Environmental friendly Segment:
- Increasingly stringent environmental regulations and compliance requirements.
- Growing public concern over water pollution and its impact on ecosystems and human health.
- Government initiatives and funding for water quality improvement projects.
- Demand for real-time monitoring in industrial effluent discharge to prevent pollution.
- Development of smart cities and smart water grids requiring integrated monitoring solutions.
The Process Sensor type is another key segment experiencing remarkable growth, essential for real-time process control and optimization across various industries. This dominance is fueled by the need for continuous monitoring in manufacturing, chemical processing, and power generation to ensure product quality, operational efficiency, and safety. The ability of process sensors to provide immediate feedback loops for automated adjustments in industrial settings makes them indispensable.
- Drivers in Process Sensor Segment:
- Need for continuous and real-time monitoring in industrial applications.
- Demand for process optimization and yield improvement.
- Ensuring consistent product quality in chemical, pharmaceutical, and food manufacturing.
- Preventing equipment damage and operational downtime through proactive monitoring.
- Integration with SCADA and DCS systems for automated control.
Other significant application segments contributing to market expansion include Food and Medicine, where stringent quality control and safety standards necessitate precise water quality monitoring. The Chemical industry relies heavily on water quality analysis for raw material purity and process control, while Agriculture and Aquaculture are increasingly adopting sensors for efficient resource management and disease prevention. The Healthy Water segment is also gaining traction as consumer awareness of water's impact on well-being grows.
Water Quality Analysis Sensor Product Developments
Product development in the Water Quality Analysis Sensor market is characterized by a strong emphasis on miniaturization, enhanced accuracy, and multi-parameter capabilities. Innovations include the integration of wireless communication protocols for seamless data transmission, enabling remote monitoring and IoT integration. Advanced materials and sensor designs are leading to improved durability and resistance to harsh industrial environments. The development of 'smart sensors' with embedded processing power for on-device data analysis and predictive diagnostics is a significant competitive edge. Furthermore, the trend towards cost-effective, disposable, or low-maintenance sensors is expanding accessibility across various market segments, from large industrial operations to smaller agricultural applications.
Challenges in the Water Quality Analysis Sensor Market
The Water Quality Analysis Sensor market faces several challenges, including high initial investment costs for advanced sensor systems, particularly for smaller enterprises and in developing regions. The need for regular calibration and maintenance can also be a barrier, requiring skilled personnel. Supply chain disruptions, as observed in recent global events, can impact the availability and cost of critical components. Moreover, the proliferation of diverse data formats and the challenge of interoperability between different sensor systems can hinder seamless integration into existing infrastructure.
Forces Driving Water Quality Analysis Sensor Growth
The primary forces driving growth in the Water Quality Analysis Sensor market are stringent regulatory mandates for environmental protection and public health, coupled with increasing industrialization and urbanization, which elevate the demand for clean water. Technological advancements, particularly in IoT, AI, and sensor miniaturization, are creating more sophisticated and accessible monitoring solutions. Economic development and rising disposable incomes in emerging economies are also contributing to increased investment in water infrastructure and quality management.
Challenges in the Water Quality Analysis Sensor Market
Long-term growth catalysts for the Water Quality Analysis Sensor market lie in continuous innovation and strategic market expansions. The ongoing development of more intelligent sensors with predictive capabilities, capable of identifying subtle changes indicative of potential issues, will drive adoption. Furthermore, strategic partnerships between sensor manufacturers, system integrators, and end-user industries will foster tailored solutions and expand market reach. Exploration of niche applications, such as microplastic detection and advanced pathogen monitoring, presents significant future growth potential.
Emerging Opportunities in Water Quality Analysis Sensor
Emerging opportunities in the Water Quality Analysis Sensor market are abundant, particularly in the realm of smart water management and precision agriculture. The growing adoption of IoT platforms for real-time, cloud-based data analysis presents a significant avenue for growth. The demand for advanced sensors capable of detecting emerging contaminants, such as per- and polyfluoroalkyl substances (PFAS) and microplastics, is rapidly increasing. Furthermore, the expansion of the market into developing regions with nascent water quality monitoring infrastructure offers substantial untapped potential.
Leading Players in the Water Quality Analysis Sensor Sector
- JingxunchangtongIt
- HACH
- Bebur
- Xiao An Instrument
- Metrohm
- ProMinent Fluid Control (Shanghai) Co., Ltd.
- Yushan Sensing
- Shanghai Kelan Instrument Technology Co., Ltd.
- Lanchang Group
- ABB
- Shiptech Group (Aqualabo)
- Endress+Hauser
- Emerson
- Cologne
- Supmea Automation
- WoMaster
- Shanghai Lei Magnetic
- Hefei Raymond Sensor Co., Ltd.
- Qingdao Haiyan Electronics Co., Ltd.
- Noble Technology
- Yantai Chemis Instrument Co., Ltd.
- Xinze Environmental Protection Technology Co., Ltd.
- Shanghai Chunye Instrument Technology Co., Ltd.
- Xiamen Wangyi Technology Co., Ltd.
Key Milestones in Water Quality Analysis Sensor Industry
- 2019: Launch of advanced multi-parameter IoT sensors with cloud connectivity, enabling remote environmental monitoring.
- 2020: Significant increase in demand for sensors in medical and pharmaceutical applications due to heightened hygiene and quality control requirements.
- 2021: Increased M&A activity focused on companies with expertise in AI-driven water quality analytics and predictive maintenance.
- 2022: Development and introduction of highly sensitive sensors for detecting emerging contaminants like PFAS.
- 2023: Growing adoption of modular and scalable sensor systems for flexible deployment in diverse industrial and agricultural settings.
- 2024: Enhanced focus on sustainable sensor manufacturing processes and the development of biodegradable sensor components.
Strategic Outlook for Water Quality Analysis Sensor Market
The strategic outlook for the Water Quality Analysis Sensor market is overwhelmingly positive, driven by an intensified global focus on water security, environmental stewardship, and public health. Continued innovation in AI-powered analytics, predictive maintenance capabilities, and the development of sensors for novel contaminants will be key growth accelerators. Strategic collaborations and partnerships will be crucial for expanding market penetration, particularly in emerging economies. The market is poised for sustained expansion, with significant opportunities for companies that can offer integrated, data-driven solutions that enhance efficiency, compliance, and sustainability in water management.
Water Quality Analysis Sensor Segmentation
-
1. Application
- 1.1. Environmental friendly
- 1.2. Food
- 1.3. Chemical
- 1.4. Medicine
- 1.5. Agriculture
- 1.6. Aquaculture
- 1.7. Healthy Water
-
2. Type
- 2.1. Combined Sensor
- 2.2. Differential Sensor
- 2.3. Lab Sensor
- 2.4. Process Sensor
Water Quality Analysis Sensor Segmentation By Geography
-
1. North America
- 1.1. United States
- 1.2. Canada
- 1.3. Mexico
-
2. South America
- 2.1. Brazil
- 2.2. Argentina
- 2.3. Rest of South America
-
3. Europe
- 3.1. United Kingdom
- 3.2. Germany
- 3.3. France
- 3.4. Italy
- 3.5. Spain
- 3.6. Russia
- 3.7. Benelux
- 3.8. Nordics
- 3.9. Rest of Europe
-
4. Middle East & Africa
- 4.1. Turkey
- 4.2. Israel
- 4.3. GCC
- 4.4. North Africa
- 4.5. South Africa
- 4.6. Rest of Middle East & Africa
-
5. Asia Pacific
- 5.1. China
- 5.2. India
- 5.3. Japan
- 5.4. South Korea
- 5.5. ASEAN
- 5.6. Oceania
- 5.7. Rest of Asia Pacific
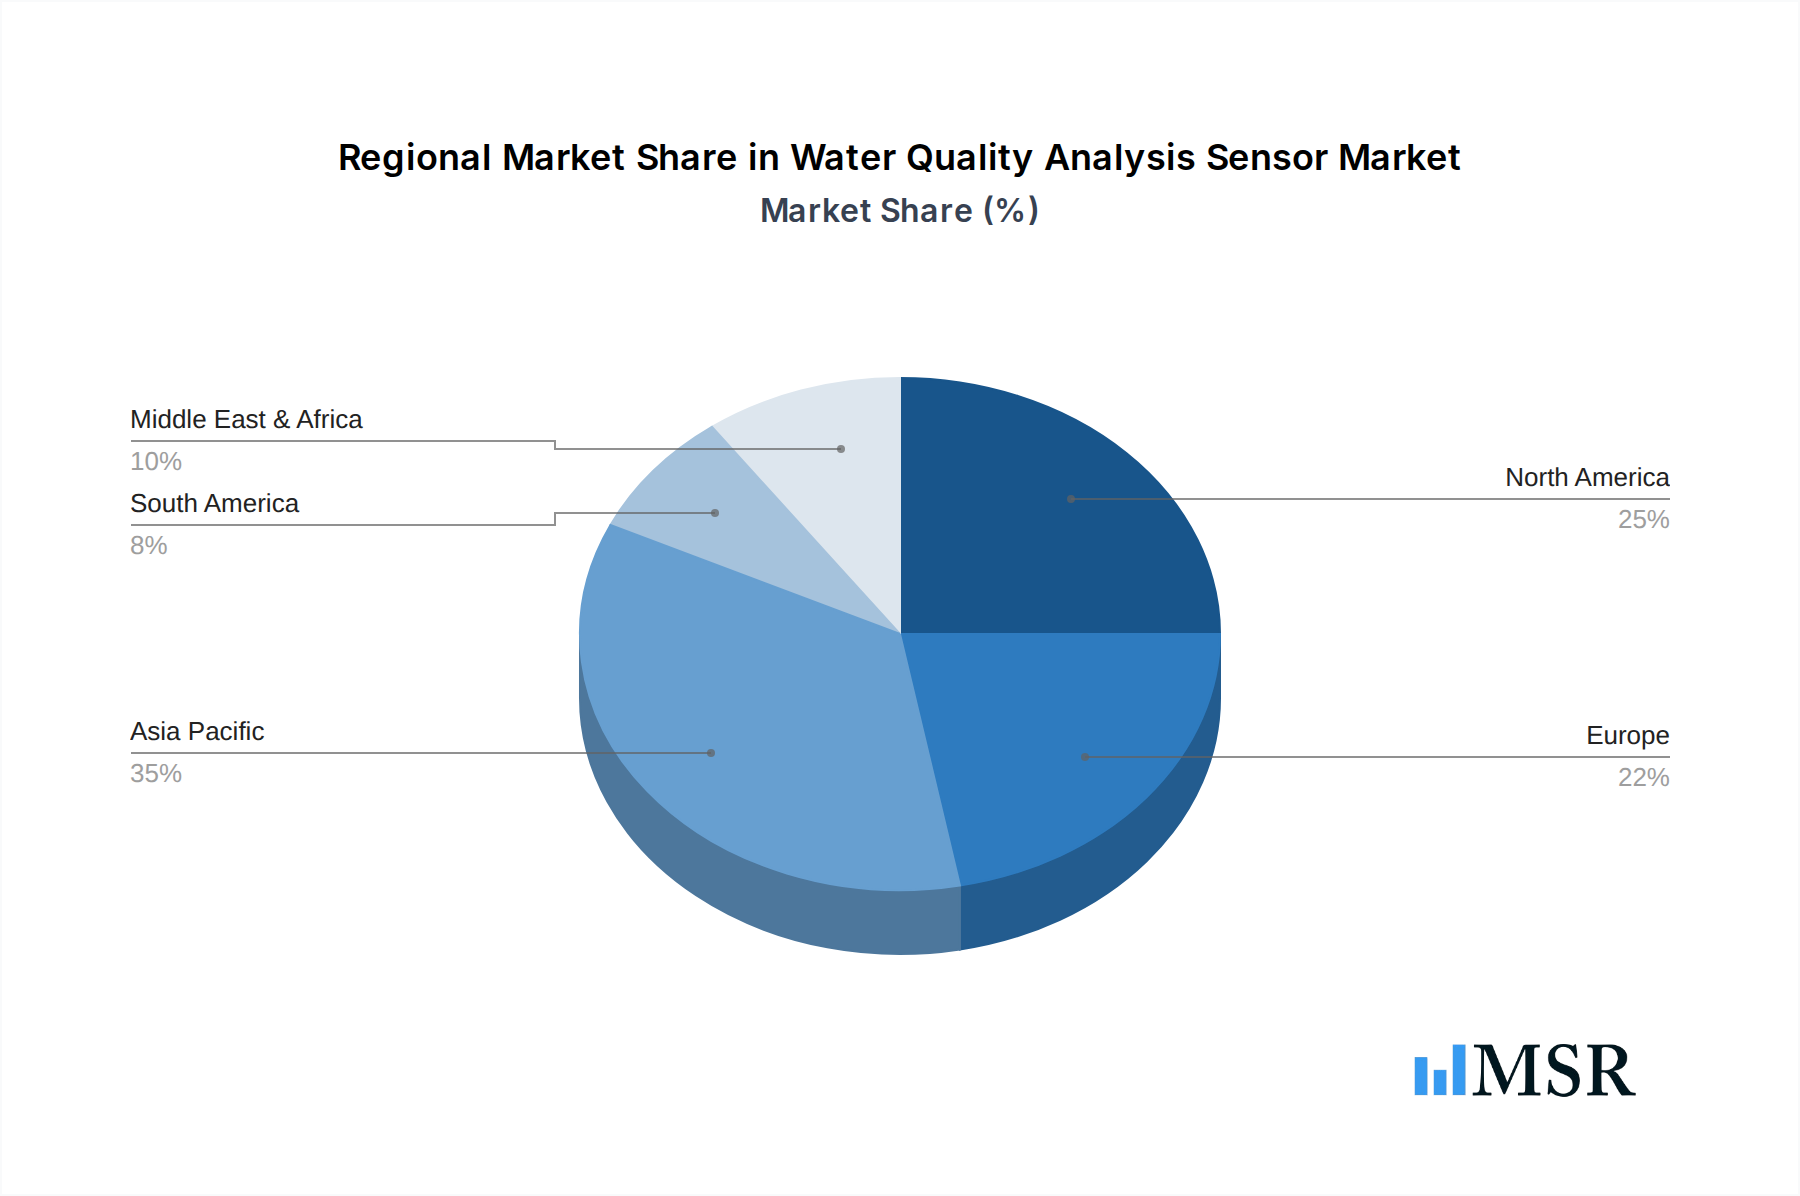
Water Quality Analysis Sensor Regional Market Share
Geographic Coverage of Water Quality Analysis Sensor
Water Quality Analysis Sensor REPORT HIGHLIGHTS
| Aspects | Details |
|---|---|
| Study Period | 2020-2034 |
| Base Year | 2025 |
| Estimated Year | 2026 |
| Forecast Period | 2026-2034 |
| Historical Period | 2020-2025 |
| Growth Rate | CAGR of 6.51% from 2020-2034 |
| Segmentation |
|
Table of Contents
- 1. Introduction
- 1.1. Research Scope
- 1.2. Market Segmentation
- 1.3. Research Objective
- 1.4. Definitions and Assumptions
- 2. Executive Summary
- 2.1. Market Snapshot
- 3. Market Dynamics
- 3.1. Market Drivers
- 3.2. Market Restrains
- 3.3. Market Trends
- 3.4. Market Opportunities
- 4. Market Factor Analysis
- 4.1. Porters Five Forces
- 4.1.1. Bargaining Power of Suppliers
- 4.1.2. Bargaining Power of Buyers
- 4.1.3. Threat of New Entrants
- 4.1.4. Threat of Substitutes
- 4.1.5. Competitive Rivalry
- 4.2. PESTEL analysis
- 4.3. BCG Analysis
- 4.3.1. Stars (High Growth, High Market Share)
- 4.3.2. Cash Cows (Low Growth, High Market Share)
- 4.3.3. Question Mark (High Growth, Low Market Share)
- 4.3.4. Dogs (Low Growth, Low Market Share)
- 4.4. Ansoff Matrix Analysis
- 4.5. Supply Chain Analysis
- 4.6. Regulatory Landscape
- 4.7. Current Market Potential and Opportunity Assessment (TAM–SAM–SOM Framework)
- 4.8. MSR Analyst Note
- 4.1. Porters Five Forces
- 5. Market Analysis, Insights and Forecast 2021-2033
- 5.1. Market Analysis, Insights and Forecast - by Application
- 5.1.1. Environmental friendly
- 5.1.2. Food
- 5.1.3. Chemical
- 5.1.4. Medicine
- 5.1.5. Agriculture
- 5.1.6. Aquaculture
- 5.1.7. Healthy Water
- 5.2. Market Analysis, Insights and Forecast - by Type
- 5.2.1. Combined Sensor
- 5.2.2. Differential Sensor
- 5.2.3. Lab Sensor
- 5.2.4. Process Sensor
- 5.3. Market Analysis, Insights and Forecast - by Region
- 5.3.1. North America
- 5.3.2. South America
- 5.3.3. Europe
- 5.3.4. Middle East & Africa
- 5.3.5. Asia Pacific
- 5.1. Market Analysis, Insights and Forecast - by Application
- 6. Global Water Quality Analysis Sensor Analysis, Insights and Forecast, 2021-2033
- 6.1. Market Analysis, Insights and Forecast - by Application
- 6.1.1. Environmental friendly
- 6.1.2. Food
- 6.1.3. Chemical
- 6.1.4. Medicine
- 6.1.5. Agriculture
- 6.1.6. Aquaculture
- 6.1.7. Healthy Water
- 6.2. Market Analysis, Insights and Forecast - by Type
- 6.2.1. Combined Sensor
- 6.2.2. Differential Sensor
- 6.2.3. Lab Sensor
- 6.2.4. Process Sensor
- 6.1. Market Analysis, Insights and Forecast - by Application
- 7. North America Water Quality Analysis Sensor Analysis, Insights and Forecast, 2020-2032
- 7.1. Market Analysis, Insights and Forecast - by Application
- 7.1.1. Environmental friendly
- 7.1.2. Food
- 7.1.3. Chemical
- 7.1.4. Medicine
- 7.1.5. Agriculture
- 7.1.6. Aquaculture
- 7.1.7. Healthy Water
- 7.2. Market Analysis, Insights and Forecast - by Type
- 7.2.1. Combined Sensor
- 7.2.2. Differential Sensor
- 7.2.3. Lab Sensor
- 7.2.4. Process Sensor
- 7.1. Market Analysis, Insights and Forecast - by Application
- 8. South America Water Quality Analysis Sensor Analysis, Insights and Forecast, 2020-2032
- 8.1. Market Analysis, Insights and Forecast - by Application
- 8.1.1. Environmental friendly
- 8.1.2. Food
- 8.1.3. Chemical
- 8.1.4. Medicine
- 8.1.5. Agriculture
- 8.1.6. Aquaculture
- 8.1.7. Healthy Water
- 8.2. Market Analysis, Insights and Forecast - by Type
- 8.2.1. Combined Sensor
- 8.2.2. Differential Sensor
- 8.2.3. Lab Sensor
- 8.2.4. Process Sensor
- 8.1. Market Analysis, Insights and Forecast - by Application
- 9. Europe Water Quality Analysis Sensor Analysis, Insights and Forecast, 2020-2032
- 9.1. Market Analysis, Insights and Forecast - by Application
- 9.1.1. Environmental friendly
- 9.1.2. Food
- 9.1.3. Chemical
- 9.1.4. Medicine
- 9.1.5. Agriculture
- 9.1.6. Aquaculture
- 9.1.7. Healthy Water
- 9.2. Market Analysis, Insights and Forecast - by Type
- 9.2.1. Combined Sensor
- 9.2.2. Differential Sensor
- 9.2.3. Lab Sensor
- 9.2.4. Process Sensor
- 9.1. Market Analysis, Insights and Forecast - by Application
- 10. Middle East & Africa Water Quality Analysis Sensor Analysis, Insights and Forecast, 2020-2032
- 10.1. Market Analysis, Insights and Forecast - by Application
- 10.1.1. Environmental friendly
- 10.1.2. Food
- 10.1.3. Chemical
- 10.1.4. Medicine
- 10.1.5. Agriculture
- 10.1.6. Aquaculture
- 10.1.7. Healthy Water
- 10.2. Market Analysis, Insights and Forecast - by Type
- 10.2.1. Combined Sensor
- 10.2.2. Differential Sensor
- 10.2.3. Lab Sensor
- 10.2.4. Process Sensor
- 10.1. Market Analysis, Insights and Forecast - by Application
- 11. Asia Pacific Water Quality Analysis Sensor Analysis, Insights and Forecast, 2020-2032
- 11.1. Market Analysis, Insights and Forecast - by Application
- 11.1.1. Environmental friendly
- 11.1.2. Food
- 11.1.3. Chemical
- 11.1.4. Medicine
- 11.1.5. Agriculture
- 11.1.6. Aquaculture
- 11.1.7. Healthy Water
- 11.2. Market Analysis, Insights and Forecast - by Type
- 11.2.1. Combined Sensor
- 11.2.2. Differential Sensor
- 11.2.3. Lab Sensor
- 11.2.4. Process Sensor
- 11.1. Market Analysis, Insights and Forecast - by Application
- 12. Competitive Analysis
- 12.1. Company Profiles
- 12.1.1 JingxunchangtongIt
- 12.1.1.1. Company Overview
- 12.1.1.2. Products
- 12.1.1.3. Company Financials
- 12.1.1.4. SWOT Analysis
- 12.1.2 HACH
- 12.1.2.1. Company Overview
- 12.1.2.2. Products
- 12.1.2.3. Company Financials
- 12.1.2.4. SWOT Analysis
- 12.1.3 Bebur
- 12.1.3.1. Company Overview
- 12.1.3.2. Products
- 12.1.3.3. Company Financials
- 12.1.3.4. SWOT Analysis
- 12.1.4 Xiao An Instrument
- 12.1.4.1. Company Overview
- 12.1.4.2. Products
- 12.1.4.3. Company Financials
- 12.1.4.4. SWOT Analysis
- 12.1.5 Metrohm
- 12.1.5.1. Company Overview
- 12.1.5.2. Products
- 12.1.5.3. Company Financials
- 12.1.5.4. SWOT Analysis
- 12.1.6 ProMinent Fluid Control (Shanghai) Co. Ltd.
- 12.1.6.1. Company Overview
- 12.1.6.2. Products
- 12.1.6.3. Company Financials
- 12.1.6.4. SWOT Analysis
- 12.1.7 Yushan Sensing
- 12.1.7.1. Company Overview
- 12.1.7.2. Products
- 12.1.7.3. Company Financials
- 12.1.7.4. SWOT Analysis
- 12.1.8 Shanghai Kelan Instrument Technology Co. Ltd.
- 12.1.8.1. Company Overview
- 12.1.8.2. Products
- 12.1.8.3. Company Financials
- 12.1.8.4. SWOT Analysis
- 12.1.9 Lanchang Group
- 12.1.9.1. Company Overview
- 12.1.9.2. Products
- 12.1.9.3. Company Financials
- 12.1.9.4. SWOT Analysis
- 12.1.10 ABB
- 12.1.10.1. Company Overview
- 12.1.10.2. Products
- 12.1.10.3. Company Financials
- 12.1.10.4. SWOT Analysis
- 12.1.11 Shiptech Group (Aqualabo)
- 12.1.11.1. Company Overview
- 12.1.11.2. Products
- 12.1.11.3. Company Financials
- 12.1.11.4. SWOT Analysis
- 12.1.12 Endress+Hauser
- 12.1.12.1. Company Overview
- 12.1.12.2. Products
- 12.1.12.3. Company Financials
- 12.1.12.4. SWOT Analysis
- 12.1.13 Emerson
- 12.1.13.1. Company Overview
- 12.1.13.2. Products
- 12.1.13.3. Company Financials
- 12.1.13.4. SWOT Analysis
- 12.1.14 Cologne
- 12.1.14.1. Company Overview
- 12.1.14.2. Products
- 12.1.14.3. Company Financials
- 12.1.14.4. SWOT Analysis
- 12.1.15 Supmea Automation
- 12.1.15.1. Company Overview
- 12.1.15.2. Products
- 12.1.15.3. Company Financials
- 12.1.15.4. SWOT Analysis
- 12.1.16 WoMaster
- 12.1.16.1. Company Overview
- 12.1.16.2. Products
- 12.1.16.3. Company Financials
- 12.1.16.4. SWOT Analysis
- 12.1.17 Shanghai Lei Magnetic
- 12.1.17.1. Company Overview
- 12.1.17.2. Products
- 12.1.17.3. Company Financials
- 12.1.17.4. SWOT Analysis
- 12.1.18 Hefei Raymond Sensor Co. Ltd.
- 12.1.18.1. Company Overview
- 12.1.18.2. Products
- 12.1.18.3. Company Financials
- 12.1.18.4. SWOT Analysis
- 12.1.19 Qingdao Haiyan Electronics Co. Ltd.
- 12.1.19.1. Company Overview
- 12.1.19.2. Products
- 12.1.19.3. Company Financials
- 12.1.19.4. SWOT Analysis
- 12.1.20 Noble Technology
- 12.1.20.1. Company Overview
- 12.1.20.2. Products
- 12.1.20.3. Company Financials
- 12.1.20.4. SWOT Analysis
- 12.1.21 Yantai Chemis Instrument Co. Ltd.
- 12.1.21.1. Company Overview
- 12.1.21.2. Products
- 12.1.21.3. Company Financials
- 12.1.21.4. SWOT Analysis
- 12.1.22 Xinze Environmental Protection Technology Co. Ltd.
- 12.1.22.1. Company Overview
- 12.1.22.2. Products
- 12.1.22.3. Company Financials
- 12.1.22.4. SWOT Analysis
- 12.1.23 Shanghai Chunye Instrument Technology Co. Ltd.
- 12.1.23.1. Company Overview
- 12.1.23.2. Products
- 12.1.23.3. Company Financials
- 12.1.23.4. SWOT Analysis
- 12.1.24 Xiamen Wangyi Technology Co. Ltd.
- 12.1.24.1. Company Overview
- 12.1.24.2. Products
- 12.1.24.3. Company Financials
- 12.1.24.4. SWOT Analysis
- 12.1.1 JingxunchangtongIt
- 12.2. Market Entropy
- 12.2.1 Company's Key Areas Served
- 12.2.2 Recent Developments
- 12.3. Company Market Share Analysis 2025
- 12.3.1 Top 5 Companies Market Share Analysis
- 12.3.2 Top 3 Companies Market Share Analysis
- 12.4. List of Potential Customers
- 13. Research Methodology
List of Figures
- Figure 1: Global Water Quality Analysis Sensor Revenue Breakdown (undefined, %) by Region 2025 & 2033
- Figure 2: North America Water Quality Analysis Sensor Revenue (undefined), by Application 2025 & 2033
- Figure 3: North America Water Quality Analysis Sensor Revenue Share (%), by Application 2025 & 2033
- Figure 4: North America Water Quality Analysis Sensor Revenue (undefined), by Type 2025 & 2033
- Figure 5: North America Water Quality Analysis Sensor Revenue Share (%), by Type 2025 & 2033
- Figure 6: North America Water Quality Analysis Sensor Revenue (undefined), by Country 2025 & 2033
- Figure 7: North America Water Quality Analysis Sensor Revenue Share (%), by Country 2025 & 2033
- Figure 8: South America Water Quality Analysis Sensor Revenue (undefined), by Application 2025 & 2033
- Figure 9: South America Water Quality Analysis Sensor Revenue Share (%), by Application 2025 & 2033
- Figure 10: South America Water Quality Analysis Sensor Revenue (undefined), by Type 2025 & 2033
- Figure 11: South America Water Quality Analysis Sensor Revenue Share (%), by Type 2025 & 2033
- Figure 12: South America Water Quality Analysis Sensor Revenue (undefined), by Country 2025 & 2033
- Figure 13: South America Water Quality Analysis Sensor Revenue Share (%), by Country 2025 & 2033
- Figure 14: Europe Water Quality Analysis Sensor Revenue (undefined), by Application 2025 & 2033
- Figure 15: Europe Water Quality Analysis Sensor Revenue Share (%), by Application 2025 & 2033
- Figure 16: Europe Water Quality Analysis Sensor Revenue (undefined), by Type 2025 & 2033
- Figure 17: Europe Water Quality Analysis Sensor Revenue Share (%), by Type 2025 & 2033
- Figure 18: Europe Water Quality Analysis Sensor Revenue (undefined), by Country 2025 & 2033
- Figure 19: Europe Water Quality Analysis Sensor Revenue Share (%), by Country 2025 & 2033
- Figure 20: Middle East & Africa Water Quality Analysis Sensor Revenue (undefined), by Application 2025 & 2033
- Figure 21: Middle East & Africa Water Quality Analysis Sensor Revenue Share (%), by Application 2025 & 2033
- Figure 22: Middle East & Africa Water Quality Analysis Sensor Revenue (undefined), by Type 2025 & 2033
- Figure 23: Middle East & Africa Water Quality Analysis Sensor Revenue Share (%), by Type 2025 & 2033
- Figure 24: Middle East & Africa Water Quality Analysis Sensor Revenue (undefined), by Country 2025 & 2033
- Figure 25: Middle East & Africa Water Quality Analysis Sensor Revenue Share (%), by Country 2025 & 2033
- Figure 26: Asia Pacific Water Quality Analysis Sensor Revenue (undefined), by Application 2025 & 2033
- Figure 27: Asia Pacific Water Quality Analysis Sensor Revenue Share (%), by Application 2025 & 2033
- Figure 28: Asia Pacific Water Quality Analysis Sensor Revenue (undefined), by Type 2025 & 2033
- Figure 29: Asia Pacific Water Quality Analysis Sensor Revenue Share (%), by Type 2025 & 2033
- Figure 30: Asia Pacific Water Quality Analysis Sensor Revenue (undefined), by Country 2025 & 2033
- Figure 31: Asia Pacific Water Quality Analysis Sensor Revenue Share (%), by Country 2025 & 2033
List of Tables
- Table 1: Global Water Quality Analysis Sensor Revenue undefined Forecast, by Application 2020 & 2033
- Table 2: Global Water Quality Analysis Sensor Revenue undefined Forecast, by Type 2020 & 2033
- Table 3: Global Water Quality Analysis Sensor Revenue undefined Forecast, by Region 2020 & 2033
- Table 4: Global Water Quality Analysis Sensor Revenue undefined Forecast, by Application 2020 & 2033
- Table 5: Global Water Quality Analysis Sensor Revenue undefined Forecast, by Type 2020 & 2033
- Table 6: Global Water Quality Analysis Sensor Revenue undefined Forecast, by Country 2020 & 2033
- Table 7: United States Water Quality Analysis Sensor Revenue (undefined) Forecast, by Application 2020 & 2033
- Table 8: Canada Water Quality Analysis Sensor Revenue (undefined) Forecast, by Application 2020 & 2033
- Table 9: Mexico Water Quality Analysis Sensor Revenue (undefined) Forecast, by Application 2020 & 2033
- Table 10: Global Water Quality Analysis Sensor Revenue undefined Forecast, by Application 2020 & 2033
- Table 11: Global Water Quality Analysis Sensor Revenue undefined Forecast, by Type 2020 & 2033
- Table 12: Global Water Quality Analysis Sensor Revenue undefined Forecast, by Country 2020 & 2033
- Table 13: Brazil Water Quality Analysis Sensor Revenue (undefined) Forecast, by Application 2020 & 2033
- Table 14: Argentina Water Quality Analysis Sensor Revenue (undefined) Forecast, by Application 2020 & 2033
- Table 15: Rest of South America Water Quality Analysis Sensor Revenue (undefined) Forecast, by Application 2020 & 2033
- Table 16: Global Water Quality Analysis Sensor Revenue undefined Forecast, by Application 2020 & 2033
- Table 17: Global Water Quality Analysis Sensor Revenue undefined Forecast, by Type 2020 & 2033
- Table 18: Global Water Quality Analysis Sensor Revenue undefined Forecast, by Country 2020 & 2033
- Table 19: United Kingdom Water Quality Analysis Sensor Revenue (undefined) Forecast, by Application 2020 & 2033
- Table 20: Germany Water Quality Analysis Sensor Revenue (undefined) Forecast, by Application 2020 & 2033
- Table 21: France Water Quality Analysis Sensor Revenue (undefined) Forecast, by Application 2020 & 2033
- Table 22: Italy Water Quality Analysis Sensor Revenue (undefined) Forecast, by Application 2020 & 2033
- Table 23: Spain Water Quality Analysis Sensor Revenue (undefined) Forecast, by Application 2020 & 2033
- Table 24: Russia Water Quality Analysis Sensor Revenue (undefined) Forecast, by Application 2020 & 2033
- Table 25: Benelux Water Quality Analysis Sensor Revenue (undefined) Forecast, by Application 2020 & 2033
- Table 26: Nordics Water Quality Analysis Sensor Revenue (undefined) Forecast, by Application 2020 & 2033
- Table 27: Rest of Europe Water Quality Analysis Sensor Revenue (undefined) Forecast, by Application 2020 & 2033
- Table 28: Global Water Quality Analysis Sensor Revenue undefined Forecast, by Application 2020 & 2033
- Table 29: Global Water Quality Analysis Sensor Revenue undefined Forecast, by Type 2020 & 2033
- Table 30: Global Water Quality Analysis Sensor Revenue undefined Forecast, by Country 2020 & 2033
- Table 31: Turkey Water Quality Analysis Sensor Revenue (undefined) Forecast, by Application 2020 & 2033
- Table 32: Israel Water Quality Analysis Sensor Revenue (undefined) Forecast, by Application 2020 & 2033
- Table 33: GCC Water Quality Analysis Sensor Revenue (undefined) Forecast, by Application 2020 & 2033
- Table 34: North Africa Water Quality Analysis Sensor Revenue (undefined) Forecast, by Application 2020 & 2033
- Table 35: South Africa Water Quality Analysis Sensor Revenue (undefined) Forecast, by Application 2020 & 2033
- Table 36: Rest of Middle East & Africa Water Quality Analysis Sensor Revenue (undefined) Forecast, by Application 2020 & 2033
- Table 37: Global Water Quality Analysis Sensor Revenue undefined Forecast, by Application 2020 & 2033
- Table 38: Global Water Quality Analysis Sensor Revenue undefined Forecast, by Type 2020 & 2033
- Table 39: Global Water Quality Analysis Sensor Revenue undefined Forecast, by Country 2020 & 2033
- Table 40: China Water Quality Analysis Sensor Revenue (undefined) Forecast, by Application 2020 & 2033
- Table 41: India Water Quality Analysis Sensor Revenue (undefined) Forecast, by Application 2020 & 2033
- Table 42: Japan Water Quality Analysis Sensor Revenue (undefined) Forecast, by Application 2020 & 2033
- Table 43: South Korea Water Quality Analysis Sensor Revenue (undefined) Forecast, by Application 2020 & 2033
- Table 44: ASEAN Water Quality Analysis Sensor Revenue (undefined) Forecast, by Application 2020 & 2033
- Table 45: Oceania Water Quality Analysis Sensor Revenue (undefined) Forecast, by Application 2020 & 2033
- Table 46: Rest of Asia Pacific Water Quality Analysis Sensor Revenue (undefined) Forecast, by Application 2020 & 2033
Frequently Asked Questions
1. What is the projected Compound Annual Growth Rate (CAGR) of the Water Quality Analysis Sensor?
The projected CAGR is approximately 6.51%.
2. Which companies are prominent players in the Water Quality Analysis Sensor?
Key companies in the market include JingxunchangtongIt, HACH, Bebur, Xiao An Instrument, Metrohm, ProMinent Fluid Control (Shanghai) Co., Ltd., Yushan Sensing, Shanghai Kelan Instrument Technology Co., Ltd., Lanchang Group, ABB, Shiptech Group (Aqualabo), Endress+Hauser, Emerson, Cologne, Supmea Automation, WoMaster, Shanghai Lei Magnetic, Hefei Raymond Sensor Co., Ltd., Qingdao Haiyan Electronics Co., Ltd., Noble Technology, Yantai Chemis Instrument Co., Ltd., Xinze Environmental Protection Technology Co., Ltd., Shanghai Chunye Instrument Technology Co., Ltd., Xiamen Wangyi Technology Co., Ltd..
3. What are the main segments of the Water Quality Analysis Sensor?
The market segments include Application, Type.
4. Can you provide details about the market size?
The market size is estimated to be USD XXX N/A as of 2022.
5. What are some drivers contributing to market growth?
N/A
6. What are the notable trends driving market growth?
N/A
7. Are there any restraints impacting market growth?
N/A
8. Can you provide examples of recent developments in the market?
N/A
9. What pricing options are available for accessing the report?
Pricing options include single-user, multi-user, and enterprise licenses priced at USD 4250.00, USD 6375.00, and USD 8500.00 respectively.
10. Is the market size provided in terms of value or volume?
The market size is provided in terms of value, measured in N/A.
11. Are there any specific market keywords associated with the report?
Yes, the market keyword associated with the report is "Water Quality Analysis Sensor," which aids in identifying and referencing the specific market segment covered.
12. How do I determine which pricing option suits my needs best?
The pricing options vary based on user requirements and access needs. Individual users may opt for single-user licenses, while businesses requiring broader access may choose multi-user or enterprise licenses for cost-effective access to the report.
13. Are there any additional resources or data provided in the Water Quality Analysis Sensor report?
While the report offers comprehensive insights, it's advisable to review the specific contents or supplementary materials provided to ascertain if additional resources or data are available.
14. How can I stay updated on further developments or reports in the Water Quality Analysis Sensor?
To stay informed about further developments, trends, and reports in the Water Quality Analysis Sensor, consider subscribing to industry newsletters, following relevant companies and organizations, or regularly checking reputable industry news sources and publications.
Methodology
Step 1 - Identification of Relevant Samples Size from Population Database


Step 2 - Approaches for Defining Global Market Size (Value, Volume* & Price*)

Note*: In applicable scenarios
Step 3 - Data Sources
Primary Research
- Web Analytics
- Survey Reports
- Research Institute
- Latest Research Reports
- Opinion Leaders
Secondary Research
- Annual Reports
- White Paper
- Latest Press Release
- Industry Association
- Paid Database
- Investor Presentations

Step 4 - Data Triangulation
Involves using different sources of information in order to increase the validity of a study
These sources are likely to be stakeholders in a program - participants, other researchers, program staff, other community members, and so on.
Then we put all data in single framework & apply various statistical tools to find out the dynamic on the market.
During the analysis stage, feedback from the stakeholder groups would be compared to determine areas of agreement as well as areas of divergence