

Key Insights
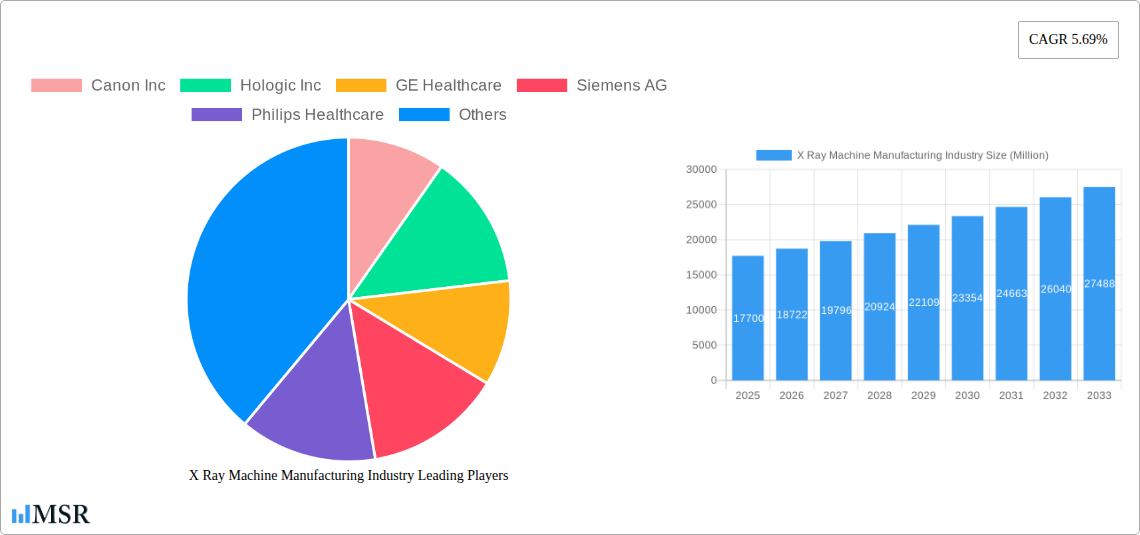
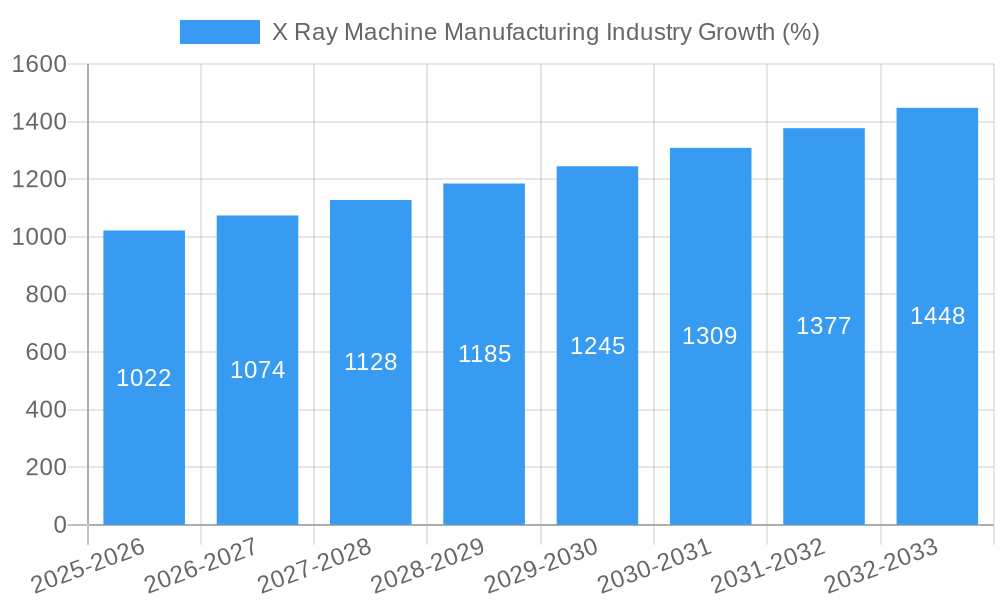
The X-ray machine manufacturing industry, currently valued at $17.70 billion (2025), is projected to experience robust growth, exhibiting a compound annual growth rate (CAGR) of 5.69% from 2025 to 2033. This growth is fueled by several key drivers. Increasing prevalence of chronic diseases necessitating frequent diagnostic imaging in healthcare settings significantly boosts demand. The expansion of healthcare infrastructure, particularly in developing economies, further contributes to market expansion. Technological advancements, such as the development of portable and digital X-ray machines, enhance accessibility and image quality, driving adoption. Furthermore, stringent regulatory frameworks emphasizing patient safety and improved diagnostic accuracy are indirectly propelling market growth by stimulating demand for higher-quality, advanced X-ray systems. While advancements in alternative imaging technologies might present some challenges, the continued reliance on X-ray imaging for its cost-effectiveness and wide applicability will ensure the market's continued expansion.
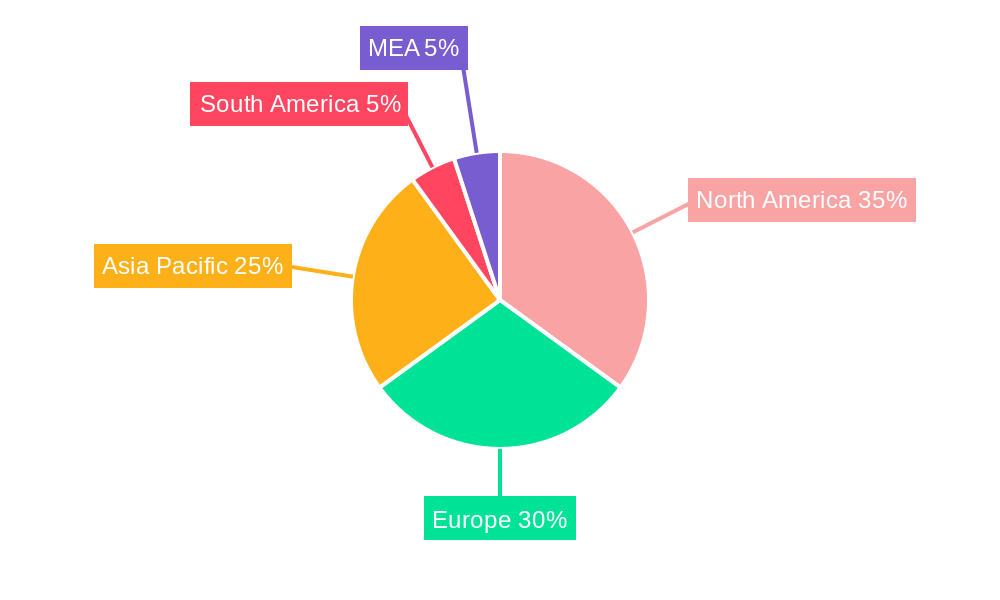
The market segmentation reveals notable trends. The healthcare segment dominates end-user applications, owing to the indispensable role of X-ray machines in diagnosis and treatment. Portable X-ray systems are gaining traction due to their enhanced flexibility and portability, particularly benefiting remote healthcare settings and emergency response situations. The shift from analog to digital X-ray technology is a key market trend, driven by advantages like improved image clarity, reduced radiation exposure, and efficient data management. Regionally, North America and Europe currently hold significant market shares, fueled by established healthcare infrastructure and high technological adoption rates. However, rapidly developing economies in Asia-Pacific are expected to demonstrate substantial growth potential over the forecast period, primarily due to increasing healthcare expenditure and rising awareness about preventive healthcare measures. Major players like Canon, Hologic, GE Healthcare, and Siemens actively contribute to innovation and market competition, pushing the boundaries of X-ray technology.
X-Ray Machine Manufacturing Industry Market Report: 2019-2033
This comprehensive report provides an in-depth analysis of the global X-ray machine manufacturing industry, offering invaluable insights for stakeholders seeking to navigate this dynamic market. The study period covers 2019-2033, with 2025 as the base and estimated year. The report projects a market size exceeding xx Million by 2033, showcasing a robust CAGR of xx%. Key players such as Canon Inc, Hologic Inc, GE Healthcare, Siemens AG, Philips Healthcare, Hindrays, Hitachi Medical Corporation, Vision Medicaid Equipment Private Limited, Shimadzu Corporation, and Fujifilm Holdings Corporation are analyzed extensively, providing a detailed understanding of market concentration and competitive dynamics. The report segments the market by end-user (Healthcare, Transportation & Logistics, Government, Other), product type (Stationary, Portable), and technology (Analog, Digital), delivering granular market intelligence.
X Ray Machine Manufacturing Industry Market Concentration & Dynamics
The X-ray machine manufacturing industry exhibits a moderately concentrated market structure, with a few major players holding significant market share. While precise figures are proprietary, GE Healthcare, Siemens AG, and Philips Healthcare are estimated to collectively command a substantial portion (xx%) of the global market. The industry is characterized by a dynamic innovation ecosystem, driven by continuous advancements in digital radiography, AI-powered image processing, and portable X-ray technologies. Stringent regulatory frameworks governing medical device safety and efficacy significantly impact market entry and product development. Substitute products, such as ultrasound and MRI, present competitive pressures, though X-ray's cost-effectiveness and widespread availability ensure its continued dominance in many applications. End-user trends, particularly the growing demand for advanced imaging solutions in healthcare, are a major growth driver. The historical period (2019-2024) witnessed a moderate number of M&A activities (xx deals), consolidating market share and fostering technological advancements.
- Market Share: GE Healthcare, Siemens AG, and Philips Healthcare hold a combined xx% market share (estimated).
- M&A Activity: Approximately xx mergers and acquisitions occurred between 2019 and 2024.
- Regulatory Landscape: Stringent regulatory approvals significantly impact market entry and product innovation.
- Substitute Products: Ultrasound and MRI technologies present competitive challenges.
X Ray Machine Manufacturing Industry Industry Insights & Trends
The global X-ray machine manufacturing industry is experiencing significant growth, fueled by several key factors. The rising prevalence of chronic diseases necessitating frequent diagnostic imaging, coupled with an aging global population, is a major driver. Technological advancements such as AI-powered image analysis and improved portability are enhancing the efficiency and accessibility of X-ray technology. Increasing healthcare expenditure globally, particularly in emerging economies, further contributes to market expansion. The market size in 2025 is estimated at xx Million, and the projected CAGR from 2025 to 2033 is xx%, indicating substantial growth potential. Consumer behavior is shifting towards preference for digital X-ray systems due to their enhanced image quality, reduced radiation exposure, and ease of integration with electronic health records (EHR) systems. However, high initial investment costs for advanced X-ray systems and the need for skilled technicians can present challenges.
Key Markets & Segments Leading X Ray Machine Manufacturing Industry
The healthcare sector dominates the X-ray machine market, accounting for over xx% of total revenue. Within healthcare, hospitals and diagnostic imaging centers are the primary end-users. The stationary X-ray segment holds a larger market share compared to portable systems, driven by the higher image quality and advanced features offered by stationary units. Digital technology completely dominates the market, replacing analog systems due to its advantages in image quality, efficiency, and data management.
Dominant Regions & Countries: North America and Europe currently hold the largest market shares, while Asia-Pacific is experiencing the fastest growth due to expanding healthcare infrastructure and increasing investments in medical technology.
- By End-User:
- Healthcare: Strongest segment, driven by increasing disease prevalence and rising healthcare expenditure.
- Transportation & Logistics: Smaller segment, used for security screening.
- Government: Moderate segment, used in security and public health initiatives.
- Other End-Users: Includes industrial applications and research institutions.
- By Product Type:
- Stationary: Larger market share due to superior image quality and advanced features.
- Portable: Growing segment due to increasing demand for point-of-care diagnostics.
- By Technology:
- Digital: Dominant technology due to superior image quality, efficiency, and data management.
- Analog: A small niche market, rapidly declining.
Growth Drivers:
- Increased healthcare spending.
- Rising prevalence of chronic diseases.
- Technological advancements in digital radiography and AI.
- Improved accessibility of healthcare in developing countries.
X Ray Machine Manufacturing Industry Product Developments
Recent years have witnessed significant advancements in X-ray machine technology. Key innovations include the integration of artificial intelligence (AI) for improved image analysis, the development of more portable and flexible systems, and the introduction of low-dose radiation technologies to enhance patient safety. Manufacturers are focusing on developing user-friendly interfaces and streamlining workflows to improve efficiency. These developments provide enhanced diagnostic capabilities, improved patient comfort, and increased operational efficiency for healthcare providers, leading to a strong competitive edge in the market.
Challenges in the X Ray Machine Manufacturing Industry Market
The X-ray machine manufacturing industry faces several challenges, including stringent regulatory requirements for medical device approval, which increases time and costs for product launches. Supply chain disruptions, particularly concerning critical components, can lead to production delays and increased costs. Intense competition among established players and the emergence of new entrants create price pressures and necessitate continuous innovation. These factors collectively impact profitability and market share. The estimated impact on revenue is xx Million annually (predicted).
Forces Driving X Ray Machine Manufacturing Industry Growth
Technological advancements, particularly in AI-powered image processing and portable X-ray systems, significantly drive market growth. Rising healthcare expenditure globally, driven by increasing healthcare awareness and aging populations, fuels demand. Government initiatives promoting healthcare infrastructure development and investments in medical technology create further growth opportunities. Examples include government funding for hospital upgrades and expansion of diagnostic imaging facilities.
Challenges in the X Ray Machine Manufacturing Industry Market
Long-term growth hinges on continuous innovation in X-ray technology, focusing on enhanced image quality, reduced radiation exposure, and improved workflow efficiency. Strategic partnerships between manufacturers and healthcare providers can accelerate the adoption of advanced X-ray systems. Expansion into emerging markets with growing healthcare infrastructure presents significant opportunities.
Emerging Opportunities in X Ray Machine Manufacturing Industry
Emerging opportunities include the growing demand for mobile and portable X-ray systems for point-of-care diagnostics, the increasing integration of AI and machine learning in image analysis and diagnosis, and expansion into untapped markets in developing countries. The development of specialized X-ray systems for specific applications, such as dental X-rays and veterinary X-rays, presents niche market potential.
Leading Players in the X Ray Machine Manufacturing Industry Sector
- Canon Inc
- Hologic Inc
- GE Healthcare
- Siemens AG
- Philips Healthcare
- Hindrays
- Hitachi Medical Corporation
- Vision Medicaid Equipment Private Limited
- Shimadzu Corporation
- Fujifilm Holdings Corporation
Key Milestones in X Ray Machine Manufacturing Industry Industry
- November 2022: Konica Minolta Healthcare Americas, Inc. launched groundbreaking digital radiography (DR) technologies, revolutionizing X-ray clinical utility.
- August 2022: GE Healthcare unveiled the Definium 656 HD, a fixed X-ray system with AI-driven image processing, improving image clarity and workflow efficiency.
Strategic Outlook for X Ray Machine Manufacturing Industry Market
The X-ray machine manufacturing industry exhibits strong growth potential driven by continuous technological innovation, increasing healthcare spending, and expanding global healthcare infrastructure. Strategic partnerships, focus on AI-driven solutions, and expansion into emerging markets will be crucial for sustained growth and success. The market is poised for significant expansion in the coming decade, with promising opportunities for both established players and new entrants.
X Ray Machine Manufacturing Industry Segmentation
-
1. Product Type
- 1.1. Stationary
- 1.2. Portable
-
2. Technology
- 2.1. Analog
- 2.2. Digital
-
3. End-user
- 3.1. Healthcare
- 3.2. Transportation and Logistics
- 3.3. Government
- 3.4. Other End-users
X Ray Machine Manufacturing Industry Segmentation By Geography
-
1. North America
- 1.1. United States
- 1.2. Canada
-
2. Europe
- 2.1. United Kingdom
- 2.2. Germany
- 2.3. France
-
3. Asia
- 3.1. China
- 3.2. Japan
- 3.3. India
- 3.4. South Korea
- 4. Latin America
- 5. Middle East and Africa
X Ray Machine Manufacturing Industry REPORT HIGHLIGHTS
| Aspects | Details |
|---|---|
| Study Period | 2019-2033 |
| Base Year | 2024 |
| Estimated Year | 2025 |
| Forecast Period | 2025-2033 |
| Historical Period | 2019-2024 |
| Growth Rate | CAGR of 5.69% from 2019-2033 |
| Segmentation |
|
Table of Contents
- 1. Introduction
- 1.1. Research Scope
- 1.2. Market Segmentation
- 1.3. Research Methodology
- 1.4. Definitions and Assumptions
- 2. Executive Summary
- 2.1. Introduction
- 3. Market Dynamics
- 3.1. Introduction
- 3.2. Market Drivers
- 3.2.1. Rise in Adoption of Digital X-ray Systems; Government Regulations and Investments to Improve Infrastructure
- 3.3. Market Restrains
- 3.3.1. High Cost of the Equipment
- 3.4. Market Trends
- 3.4.1. Healthcare Sector is Expected to Hold a Significant Market Share
- 4. Market Factor Analysis
- 4.1. Porters Five Forces
- 4.2. Supply/Value Chain
- 4.3. PESTEL analysis
- 4.4. Market Entropy
- 4.5. Patent/Trademark Analysis
- 5. Global X Ray Machine Manufacturing Industry Analysis, Insights and Forecast, 2019-2031
- 5.1. Market Analysis, Insights and Forecast - by Product Type
- 5.1.1. Stationary
- 5.1.2. Portable
- 5.2. Market Analysis, Insights and Forecast - by Technology
- 5.2.1. Analog
- 5.2.2. Digital
- 5.3. Market Analysis, Insights and Forecast - by End-user
- 5.3.1. Healthcare
- 5.3.2. Transportation and Logistics
- 5.3.3. Government
- 5.3.4. Other End-users
- 5.4. Market Analysis, Insights and Forecast - by Region
- 5.4.1. North America
- 5.4.2. Europe
- 5.4.3. Asia
- 5.4.4. Latin America
- 5.4.5. Middle East and Africa
- 5.1. Market Analysis, Insights and Forecast - by Product Type
- 6. North America X Ray Machine Manufacturing Industry Analysis, Insights and Forecast, 2019-2031
- 6.1. Market Analysis, Insights and Forecast - by Product Type
- 6.1.1. Stationary
- 6.1.2. Portable
- 6.2. Market Analysis, Insights and Forecast - by Technology
- 6.2.1. Analog
- 6.2.2. Digital
- 6.3. Market Analysis, Insights and Forecast - by End-user
- 6.3.1. Healthcare
- 6.3.2. Transportation and Logistics
- 6.3.3. Government
- 6.3.4. Other End-users
- 6.1. Market Analysis, Insights and Forecast - by Product Type
- 7. Europe X Ray Machine Manufacturing Industry Analysis, Insights and Forecast, 2019-2031
- 7.1. Market Analysis, Insights and Forecast - by Product Type
- 7.1.1. Stationary
- 7.1.2. Portable
- 7.2. Market Analysis, Insights and Forecast - by Technology
- 7.2.1. Analog
- 7.2.2. Digital
- 7.3. Market Analysis, Insights and Forecast - by End-user
- 7.3.1. Healthcare
- 7.3.2. Transportation and Logistics
- 7.3.3. Government
- 7.3.4. Other End-users
- 7.1. Market Analysis, Insights and Forecast - by Product Type
- 8. Asia X Ray Machine Manufacturing Industry Analysis, Insights and Forecast, 2019-2031
- 8.1. Market Analysis, Insights and Forecast - by Product Type
- 8.1.1. Stationary
- 8.1.2. Portable
- 8.2. Market Analysis, Insights and Forecast - by Technology
- 8.2.1. Analog
- 8.2.2. Digital
- 8.3. Market Analysis, Insights and Forecast - by End-user
- 8.3.1. Healthcare
- 8.3.2. Transportation and Logistics
- 8.3.3. Government
- 8.3.4. Other End-users
- 8.1. Market Analysis, Insights and Forecast - by Product Type
- 9. Latin America X Ray Machine Manufacturing Industry Analysis, Insights and Forecast, 2019-2031
- 9.1. Market Analysis, Insights and Forecast - by Product Type
- 9.1.1. Stationary
- 9.1.2. Portable
- 9.2. Market Analysis, Insights and Forecast - by Technology
- 9.2.1. Analog
- 9.2.2. Digital
- 9.3. Market Analysis, Insights and Forecast - by End-user
- 9.3.1. Healthcare
- 9.3.2. Transportation and Logistics
- 9.3.3. Government
- 9.3.4. Other End-users
- 9.1. Market Analysis, Insights and Forecast - by Product Type
- 10. Middle East and Africa X Ray Machine Manufacturing Industry Analysis, Insights and Forecast, 2019-2031
- 10.1. Market Analysis, Insights and Forecast - by Product Type
- 10.1.1. Stationary
- 10.1.2. Portable
- 10.2. Market Analysis, Insights and Forecast - by Technology
- 10.2.1. Analog
- 10.2.2. Digital
- 10.3. Market Analysis, Insights and Forecast - by End-user
- 10.3.1. Healthcare
- 10.3.2. Transportation and Logistics
- 10.3.3. Government
- 10.3.4. Other End-users
- 10.1. Market Analysis, Insights and Forecast - by Product Type
- 11. North America X Ray Machine Manufacturing Industry Analysis, Insights and Forecast, 2019-2031
- 11.1. Market Analysis, Insights and Forecast - By Country/Sub-region
- 11.1.1 United States
- 11.1.2 Canada
- 11.1.3 Mexico
- 12. Europe X Ray Machine Manufacturing Industry Analysis, Insights and Forecast, 2019-2031
- 12.1. Market Analysis, Insights and Forecast - By Country/Sub-region
- 12.1.1 Germany
- 12.1.2 United Kingdom
- 12.1.3 France
- 12.1.4 Spain
- 12.1.5 Italy
- 12.1.6 Spain
- 12.1.7 Belgium
- 12.1.8 Netherland
- 12.1.9 Nordics
- 12.1.10 Rest of Europe
- 13. Asia Pacific X Ray Machine Manufacturing Industry Analysis, Insights and Forecast, 2019-2031
- 13.1. Market Analysis, Insights and Forecast - By Country/Sub-region
- 13.1.1 China
- 13.1.2 Japan
- 13.1.3 India
- 13.1.4 South Korea
- 13.1.5 Southeast Asia
- 13.1.6 Australia
- 13.1.7 Indonesia
- 13.1.8 Phillipes
- 13.1.9 Singapore
- 13.1.10 Thailandc
- 13.1.11 Rest of Asia Pacific
- 14. South America X Ray Machine Manufacturing Industry Analysis, Insights and Forecast, 2019-2031
- 14.1. Market Analysis, Insights and Forecast - By Country/Sub-region
- 14.1.1 Brazil
- 14.1.2 Argentina
- 14.1.3 Peru
- 14.1.4 Chile
- 14.1.5 Colombia
- 14.1.6 Ecuador
- 14.1.7 Venezuela
- 14.1.8 Rest of South America
- 15. North America X Ray Machine Manufacturing Industry Analysis, Insights and Forecast, 2019-2031
- 15.1. Market Analysis, Insights and Forecast - By Country/Sub-region
- 15.1.1 United States
- 15.1.2 Canada
- 15.1.3 Mexico
- 16. MEA X Ray Machine Manufacturing Industry Analysis, Insights and Forecast, 2019-2031
- 16.1. Market Analysis, Insights and Forecast - By Country/Sub-region
- 16.1.1 United Arab Emirates
- 16.1.2 Saudi Arabia
- 16.1.3 South Africa
- 16.1.4 Rest of Middle East and Africa
- 17. Competitive Analysis
- 17.1. Global Market Share Analysis 2024
- 17.2. Company Profiles
- 17.2.1 Canon Inc
- 17.2.1.1. Overview
- 17.2.1.2. Products
- 17.2.1.3. SWOT Analysis
- 17.2.1.4. Recent Developments
- 17.2.1.5. Financials (Based on Availability)
- 17.2.2 Hologic Inc
- 17.2.2.1. Overview
- 17.2.2.2. Products
- 17.2.2.3. SWOT Analysis
- 17.2.2.4. Recent Developments
- 17.2.2.5. Financials (Based on Availability)
- 17.2.3 GE Healthcare
- 17.2.3.1. Overview
- 17.2.3.2. Products
- 17.2.3.3. SWOT Analysis
- 17.2.3.4. Recent Developments
- 17.2.3.5. Financials (Based on Availability)
- 17.2.4 Siemens AG
- 17.2.4.1. Overview
- 17.2.4.2. Products
- 17.2.4.3. SWOT Analysis
- 17.2.4.4. Recent Developments
- 17.2.4.5. Financials (Based on Availability)
- 17.2.5 Philips Healthcare
- 17.2.5.1. Overview
- 17.2.5.2. Products
- 17.2.5.3. SWOT Analysis
- 17.2.5.4. Recent Developments
- 17.2.5.5. Financials (Based on Availability)
- 17.2.6 Hindrays
- 17.2.6.1. Overview
- 17.2.6.2. Products
- 17.2.6.3. SWOT Analysis
- 17.2.6.4. Recent Developments
- 17.2.6.5. Financials (Based on Availability)
- 17.2.7 Hitachi Medical Corporation
- 17.2.7.1. Overview
- 17.2.7.2. Products
- 17.2.7.3. SWOT Analysis
- 17.2.7.4. Recent Developments
- 17.2.7.5. Financials (Based on Availability)
- 17.2.8 Vision Medicaid Equipment Private Limited
- 17.2.8.1. Overview
- 17.2.8.2. Products
- 17.2.8.3. SWOT Analysis
- 17.2.8.4. Recent Developments
- 17.2.8.5. Financials (Based on Availability)
- 17.2.9 Shimadzu Corporation
- 17.2.9.1. Overview
- 17.2.9.2. Products
- 17.2.9.3. SWOT Analysis
- 17.2.9.4. Recent Developments
- 17.2.9.5. Financials (Based on Availability)
- 17.2.10 Fujifilm Holdings Corporation
- 17.2.10.1. Overview
- 17.2.10.2. Products
- 17.2.10.3. SWOT Analysis
- 17.2.10.4. Recent Developments
- 17.2.10.5. Financials (Based on Availability)
- 17.2.1 Canon Inc
List of Figures
- Figure 1: Global X Ray Machine Manufacturing Industry Revenue Breakdown (Million, %) by Region 2024 & 2032
- Figure 2: Global X Ray Machine Manufacturing Industry Volume Breakdown (K Unit, %) by Region 2024 & 2032
- Figure 3: North America X Ray Machine Manufacturing Industry Revenue (Million), by Country 2024 & 2032
- Figure 4: North America X Ray Machine Manufacturing Industry Volume (K Unit), by Country 2024 & 2032
- Figure 5: North America X Ray Machine Manufacturing Industry Revenue Share (%), by Country 2024 & 2032
- Figure 6: North America X Ray Machine Manufacturing Industry Volume Share (%), by Country 2024 & 2032
- Figure 7: Europe X Ray Machine Manufacturing Industry Revenue (Million), by Country 2024 & 2032
- Figure 8: Europe X Ray Machine Manufacturing Industry Volume (K Unit), by Country 2024 & 2032
- Figure 9: Europe X Ray Machine Manufacturing Industry Revenue Share (%), by Country 2024 & 2032
- Figure 10: Europe X Ray Machine Manufacturing Industry Volume Share (%), by Country 2024 & 2032
- Figure 11: Asia Pacific X Ray Machine Manufacturing Industry Revenue (Million), by Country 2024 & 2032
- Figure 12: Asia Pacific X Ray Machine Manufacturing Industry Volume (K Unit), by Country 2024 & 2032
- Figure 13: Asia Pacific X Ray Machine Manufacturing Industry Revenue Share (%), by Country 2024 & 2032
- Figure 14: Asia Pacific X Ray Machine Manufacturing Industry Volume Share (%), by Country 2024 & 2032
- Figure 15: South America X Ray Machine Manufacturing Industry Revenue (Million), by Country 2024 & 2032
- Figure 16: South America X Ray Machine Manufacturing Industry Volume (K Unit), by Country 2024 & 2032
- Figure 17: South America X Ray Machine Manufacturing Industry Revenue Share (%), by Country 2024 & 2032
- Figure 18: South America X Ray Machine Manufacturing Industry Volume Share (%), by Country 2024 & 2032
- Figure 19: North America X Ray Machine Manufacturing Industry Revenue (Million), by Country 2024 & 2032
- Figure 20: North America X Ray Machine Manufacturing Industry Volume (K Unit), by Country 2024 & 2032
- Figure 21: North America X Ray Machine Manufacturing Industry Revenue Share (%), by Country 2024 & 2032
- Figure 22: North America X Ray Machine Manufacturing Industry Volume Share (%), by Country 2024 & 2032
- Figure 23: MEA X Ray Machine Manufacturing Industry Revenue (Million), by Country 2024 & 2032
- Figure 24: MEA X Ray Machine Manufacturing Industry Volume (K Unit), by Country 2024 & 2032
- Figure 25: MEA X Ray Machine Manufacturing Industry Revenue Share (%), by Country 2024 & 2032
- Figure 26: MEA X Ray Machine Manufacturing Industry Volume Share (%), by Country 2024 & 2032
- Figure 27: North America X Ray Machine Manufacturing Industry Revenue (Million), by Product Type 2024 & 2032
- Figure 28: North America X Ray Machine Manufacturing Industry Volume (K Unit), by Product Type 2024 & 2032
- Figure 29: North America X Ray Machine Manufacturing Industry Revenue Share (%), by Product Type 2024 & 2032
- Figure 30: North America X Ray Machine Manufacturing Industry Volume Share (%), by Product Type 2024 & 2032
- Figure 31: North America X Ray Machine Manufacturing Industry Revenue (Million), by Technology 2024 & 2032
- Figure 32: North America X Ray Machine Manufacturing Industry Volume (K Unit), by Technology 2024 & 2032
- Figure 33: North America X Ray Machine Manufacturing Industry Revenue Share (%), by Technology 2024 & 2032
- Figure 34: North America X Ray Machine Manufacturing Industry Volume Share (%), by Technology 2024 & 2032
- Figure 35: North America X Ray Machine Manufacturing Industry Revenue (Million), by End-user 2024 & 2032
- Figure 36: North America X Ray Machine Manufacturing Industry Volume (K Unit), by End-user 2024 & 2032
- Figure 37: North America X Ray Machine Manufacturing Industry Revenue Share (%), by End-user 2024 & 2032
- Figure 38: North America X Ray Machine Manufacturing Industry Volume Share (%), by End-user 2024 & 2032
- Figure 39: North America X Ray Machine Manufacturing Industry Revenue (Million), by Country 2024 & 2032
- Figure 40: North America X Ray Machine Manufacturing Industry Volume (K Unit), by Country 2024 & 2032
- Figure 41: North America X Ray Machine Manufacturing Industry Revenue Share (%), by Country 2024 & 2032
- Figure 42: North America X Ray Machine Manufacturing Industry Volume Share (%), by Country 2024 & 2032
- Figure 43: Europe X Ray Machine Manufacturing Industry Revenue (Million), by Product Type 2024 & 2032
- Figure 44: Europe X Ray Machine Manufacturing Industry Volume (K Unit), by Product Type 2024 & 2032
- Figure 45: Europe X Ray Machine Manufacturing Industry Revenue Share (%), by Product Type 2024 & 2032
- Figure 46: Europe X Ray Machine Manufacturing Industry Volume Share (%), by Product Type 2024 & 2032
- Figure 47: Europe X Ray Machine Manufacturing Industry Revenue (Million), by Technology 2024 & 2032
- Figure 48: Europe X Ray Machine Manufacturing Industry Volume (K Unit), by Technology 2024 & 2032
- Figure 49: Europe X Ray Machine Manufacturing Industry Revenue Share (%), by Technology 2024 & 2032
- Figure 50: Europe X Ray Machine Manufacturing Industry Volume Share (%), by Technology 2024 & 2032
- Figure 51: Europe X Ray Machine Manufacturing Industry Revenue (Million), by End-user 2024 & 2032
- Figure 52: Europe X Ray Machine Manufacturing Industry Volume (K Unit), by End-user 2024 & 2032
- Figure 53: Europe X Ray Machine Manufacturing Industry Revenue Share (%), by End-user 2024 & 2032
- Figure 54: Europe X Ray Machine Manufacturing Industry Volume Share (%), by End-user 2024 & 2032
- Figure 55: Europe X Ray Machine Manufacturing Industry Revenue (Million), by Country 2024 & 2032
- Figure 56: Europe X Ray Machine Manufacturing Industry Volume (K Unit), by Country 2024 & 2032
- Figure 57: Europe X Ray Machine Manufacturing Industry Revenue Share (%), by Country 2024 & 2032
- Figure 58: Europe X Ray Machine Manufacturing Industry Volume Share (%), by Country 2024 & 2032
- Figure 59: Asia X Ray Machine Manufacturing Industry Revenue (Million), by Product Type 2024 & 2032
- Figure 60: Asia X Ray Machine Manufacturing Industry Volume (K Unit), by Product Type 2024 & 2032
- Figure 61: Asia X Ray Machine Manufacturing Industry Revenue Share (%), by Product Type 2024 & 2032
- Figure 62: Asia X Ray Machine Manufacturing Industry Volume Share (%), by Product Type 2024 & 2032
- Figure 63: Asia X Ray Machine Manufacturing Industry Revenue (Million), by Technology 2024 & 2032
- Figure 64: Asia X Ray Machine Manufacturing Industry Volume (K Unit), by Technology 2024 & 2032
- Figure 65: Asia X Ray Machine Manufacturing Industry Revenue Share (%), by Technology 2024 & 2032
- Figure 66: Asia X Ray Machine Manufacturing Industry Volume Share (%), by Technology 2024 & 2032
- Figure 67: Asia X Ray Machine Manufacturing Industry Revenue (Million), by End-user 2024 & 2032
- Figure 68: Asia X Ray Machine Manufacturing Industry Volume (K Unit), by End-user 2024 & 2032
- Figure 69: Asia X Ray Machine Manufacturing Industry Revenue Share (%), by End-user 2024 & 2032
- Figure 70: Asia X Ray Machine Manufacturing Industry Volume Share (%), by End-user 2024 & 2032
- Figure 71: Asia X Ray Machine Manufacturing Industry Revenue (Million), by Country 2024 & 2032
- Figure 72: Asia X Ray Machine Manufacturing Industry Volume (K Unit), by Country 2024 & 2032
- Figure 73: Asia X Ray Machine Manufacturing Industry Revenue Share (%), by Country 2024 & 2032
- Figure 74: Asia X Ray Machine Manufacturing Industry Volume Share (%), by Country 2024 & 2032
- Figure 75: Latin America X Ray Machine Manufacturing Industry Revenue (Million), by Product Type 2024 & 2032
- Figure 76: Latin America X Ray Machine Manufacturing Industry Volume (K Unit), by Product Type 2024 & 2032
- Figure 77: Latin America X Ray Machine Manufacturing Industry Revenue Share (%), by Product Type 2024 & 2032
- Figure 78: Latin America X Ray Machine Manufacturing Industry Volume Share (%), by Product Type 2024 & 2032
- Figure 79: Latin America X Ray Machine Manufacturing Industry Revenue (Million), by Technology 2024 & 2032
- Figure 80: Latin America X Ray Machine Manufacturing Industry Volume (K Unit), by Technology 2024 & 2032
- Figure 81: Latin America X Ray Machine Manufacturing Industry Revenue Share (%), by Technology 2024 & 2032
- Figure 82: Latin America X Ray Machine Manufacturing Industry Volume Share (%), by Technology 2024 & 2032
- Figure 83: Latin America X Ray Machine Manufacturing Industry Revenue (Million), by End-user 2024 & 2032
- Figure 84: Latin America X Ray Machine Manufacturing Industry Volume (K Unit), by End-user 2024 & 2032
- Figure 85: Latin America X Ray Machine Manufacturing Industry Revenue Share (%), by End-user 2024 & 2032
- Figure 86: Latin America X Ray Machine Manufacturing Industry Volume Share (%), by End-user 2024 & 2032
- Figure 87: Latin America X Ray Machine Manufacturing Industry Revenue (Million), by Country 2024 & 2032
- Figure 88: Latin America X Ray Machine Manufacturing Industry Volume (K Unit), by Country 2024 & 2032
- Figure 89: Latin America X Ray Machine Manufacturing Industry Revenue Share (%), by Country 2024 & 2032
- Figure 90: Latin America X Ray Machine Manufacturing Industry Volume Share (%), by Country 2024 & 2032
- Figure 91: Middle East and Africa X Ray Machine Manufacturing Industry Revenue (Million), by Product Type 2024 & 2032
- Figure 92: Middle East and Africa X Ray Machine Manufacturing Industry Volume (K Unit), by Product Type 2024 & 2032
- Figure 93: Middle East and Africa X Ray Machine Manufacturing Industry Revenue Share (%), by Product Type 2024 & 2032
- Figure 94: Middle East and Africa X Ray Machine Manufacturing Industry Volume Share (%), by Product Type 2024 & 2032
- Figure 95: Middle East and Africa X Ray Machine Manufacturing Industry Revenue (Million), by Technology 2024 & 2032
- Figure 96: Middle East and Africa X Ray Machine Manufacturing Industry Volume (K Unit), by Technology 2024 & 2032
- Figure 97: Middle East and Africa X Ray Machine Manufacturing Industry Revenue Share (%), by Technology 2024 & 2032
- Figure 98: Middle East and Africa X Ray Machine Manufacturing Industry Volume Share (%), by Technology 2024 & 2032
- Figure 99: Middle East and Africa X Ray Machine Manufacturing Industry Revenue (Million), by End-user 2024 & 2032
- Figure 100: Middle East and Africa X Ray Machine Manufacturing Industry Volume (K Unit), by End-user 2024 & 2032
- Figure 101: Middle East and Africa X Ray Machine Manufacturing Industry Revenue Share (%), by End-user 2024 & 2032
- Figure 102: Middle East and Africa X Ray Machine Manufacturing Industry Volume Share (%), by End-user 2024 & 2032
- Figure 103: Middle East and Africa X Ray Machine Manufacturing Industry Revenue (Million), by Country 2024 & 2032
- Figure 104: Middle East and Africa X Ray Machine Manufacturing Industry Volume (K Unit), by Country 2024 & 2032
- Figure 105: Middle East and Africa X Ray Machine Manufacturing Industry Revenue Share (%), by Country 2024 & 2032
- Figure 106: Middle East and Africa X Ray Machine Manufacturing Industry Volume Share (%), by Country 2024 & 2032
List of Tables
- Table 1: Global X Ray Machine Manufacturing Industry Revenue Million Forecast, by Region 2019 & 2032
- Table 2: Global X Ray Machine Manufacturing Industry Volume K Unit Forecast, by Region 2019 & 2032
- Table 3: Global X Ray Machine Manufacturing Industry Revenue Million Forecast, by Product Type 2019 & 2032
- Table 4: Global X Ray Machine Manufacturing Industry Volume K Unit Forecast, by Product Type 2019 & 2032
- Table 5: Global X Ray Machine Manufacturing Industry Revenue Million Forecast, by Technology 2019 & 2032
- Table 6: Global X Ray Machine Manufacturing Industry Volume K Unit Forecast, by Technology 2019 & 2032
- Table 7: Global X Ray Machine Manufacturing Industry Revenue Million Forecast, by End-user 2019 & 2032
- Table 8: Global X Ray Machine Manufacturing Industry Volume K Unit Forecast, by End-user 2019 & 2032
- Table 9: Global X Ray Machine Manufacturing Industry Revenue Million Forecast, by Region 2019 & 2032
- Table 10: Global X Ray Machine Manufacturing Industry Volume K Unit Forecast, by Region 2019 & 2032
- Table 11: Global X Ray Machine Manufacturing Industry Revenue Million Forecast, by Country 2019 & 2032
- Table 12: Global X Ray Machine Manufacturing Industry Volume K Unit Forecast, by Country 2019 & 2032
- Table 13: United States X Ray Machine Manufacturing Industry Revenue (Million) Forecast, by Application 2019 & 2032
- Table 14: United States X Ray Machine Manufacturing Industry Volume (K Unit) Forecast, by Application 2019 & 2032
- Table 15: Canada X Ray Machine Manufacturing Industry Revenue (Million) Forecast, by Application 2019 & 2032
- Table 16: Canada X Ray Machine Manufacturing Industry Volume (K Unit) Forecast, by Application 2019 & 2032
- Table 17: Mexico X Ray Machine Manufacturing Industry Revenue (Million) Forecast, by Application 2019 & 2032
- Table 18: Mexico X Ray Machine Manufacturing Industry Volume (K Unit) Forecast, by Application 2019 & 2032
- Table 19: Global X Ray Machine Manufacturing Industry Revenue Million Forecast, by Country 2019 & 2032
- Table 20: Global X Ray Machine Manufacturing Industry Volume K Unit Forecast, by Country 2019 & 2032
- Table 21: Germany X Ray Machine Manufacturing Industry Revenue (Million) Forecast, by Application 2019 & 2032
- Table 22: Germany X Ray Machine Manufacturing Industry Volume (K Unit) Forecast, by Application 2019 & 2032
- Table 23: United Kingdom X Ray Machine Manufacturing Industry Revenue (Million) Forecast, by Application 2019 & 2032
- Table 24: United Kingdom X Ray Machine Manufacturing Industry Volume (K Unit) Forecast, by Application 2019 & 2032
- Table 25: France X Ray Machine Manufacturing Industry Revenue (Million) Forecast, by Application 2019 & 2032
- Table 26: France X Ray Machine Manufacturing Industry Volume (K Unit) Forecast, by Application 2019 & 2032
- Table 27: Spain X Ray Machine Manufacturing Industry Revenue (Million) Forecast, by Application 2019 & 2032
- Table 28: Spain X Ray Machine Manufacturing Industry Volume (K Unit) Forecast, by Application 2019 & 2032
- Table 29: Italy X Ray Machine Manufacturing Industry Revenue (Million) Forecast, by Application 2019 & 2032
- Table 30: Italy X Ray Machine Manufacturing Industry Volume (K Unit) Forecast, by Application 2019 & 2032
- Table 31: Spain X Ray Machine Manufacturing Industry Revenue (Million) Forecast, by Application 2019 & 2032
- Table 32: Spain X Ray Machine Manufacturing Industry Volume (K Unit) Forecast, by Application 2019 & 2032
- Table 33: Belgium X Ray Machine Manufacturing Industry Revenue (Million) Forecast, by Application 2019 & 2032
- Table 34: Belgium X Ray Machine Manufacturing Industry Volume (K Unit) Forecast, by Application 2019 & 2032
- Table 35: Netherland X Ray Machine Manufacturing Industry Revenue (Million) Forecast, by Application 2019 & 2032
- Table 36: Netherland X Ray Machine Manufacturing Industry Volume (K Unit) Forecast, by Application 2019 & 2032
- Table 37: Nordics X Ray Machine Manufacturing Industry Revenue (Million) Forecast, by Application 2019 & 2032
- Table 38: Nordics X Ray Machine Manufacturing Industry Volume (K Unit) Forecast, by Application 2019 & 2032
- Table 39: Rest of Europe X Ray Machine Manufacturing Industry Revenue (Million) Forecast, by Application 2019 & 2032
- Table 40: Rest of Europe X Ray Machine Manufacturing Industry Volume (K Unit) Forecast, by Application 2019 & 2032
- Table 41: Global X Ray Machine Manufacturing Industry Revenue Million Forecast, by Country 2019 & 2032
- Table 42: Global X Ray Machine Manufacturing Industry Volume K Unit Forecast, by Country 2019 & 2032
- Table 43: China X Ray Machine Manufacturing Industry Revenue (Million) Forecast, by Application 2019 & 2032
- Table 44: China X Ray Machine Manufacturing Industry Volume (K Unit) Forecast, by Application 2019 & 2032
- Table 45: Japan X Ray Machine Manufacturing Industry Revenue (Million) Forecast, by Application 2019 & 2032
- Table 46: Japan X Ray Machine Manufacturing Industry Volume (K Unit) Forecast, by Application 2019 & 2032
- Table 47: India X Ray Machine Manufacturing Industry Revenue (Million) Forecast, by Application 2019 & 2032
- Table 48: India X Ray Machine Manufacturing Industry Volume (K Unit) Forecast, by Application 2019 & 2032
- Table 49: South Korea X Ray Machine Manufacturing Industry Revenue (Million) Forecast, by Application 2019 & 2032
- Table 50: South Korea X Ray Machine Manufacturing Industry Volume (K Unit) Forecast, by Application 2019 & 2032
- Table 51: Southeast Asia X Ray Machine Manufacturing Industry Revenue (Million) Forecast, by Application 2019 & 2032
- Table 52: Southeast Asia X Ray Machine Manufacturing Industry Volume (K Unit) Forecast, by Application 2019 & 2032
- Table 53: Australia X Ray Machine Manufacturing Industry Revenue (Million) Forecast, by Application 2019 & 2032
- Table 54: Australia X Ray Machine Manufacturing Industry Volume (K Unit) Forecast, by Application 2019 & 2032
- Table 55: Indonesia X Ray Machine Manufacturing Industry Revenue (Million) Forecast, by Application 2019 & 2032
- Table 56: Indonesia X Ray Machine Manufacturing Industry Volume (K Unit) Forecast, by Application 2019 & 2032
- Table 57: Phillipes X Ray Machine Manufacturing Industry Revenue (Million) Forecast, by Application 2019 & 2032
- Table 58: Phillipes X Ray Machine Manufacturing Industry Volume (K Unit) Forecast, by Application 2019 & 2032
- Table 59: Singapore X Ray Machine Manufacturing Industry Revenue (Million) Forecast, by Application 2019 & 2032
- Table 60: Singapore X Ray Machine Manufacturing Industry Volume (K Unit) Forecast, by Application 2019 & 2032
- Table 61: Thailandc X Ray Machine Manufacturing Industry Revenue (Million) Forecast, by Application 2019 & 2032
- Table 62: Thailandc X Ray Machine Manufacturing Industry Volume (K Unit) Forecast, by Application 2019 & 2032
- Table 63: Rest of Asia Pacific X Ray Machine Manufacturing Industry Revenue (Million) Forecast, by Application 2019 & 2032
- Table 64: Rest of Asia Pacific X Ray Machine Manufacturing Industry Volume (K Unit) Forecast, by Application 2019 & 2032
- Table 65: Global X Ray Machine Manufacturing Industry Revenue Million Forecast, by Country 2019 & 2032
- Table 66: Global X Ray Machine Manufacturing Industry Volume K Unit Forecast, by Country 2019 & 2032
- Table 67: Brazil X Ray Machine Manufacturing Industry Revenue (Million) Forecast, by Application 2019 & 2032
- Table 68: Brazil X Ray Machine Manufacturing Industry Volume (K Unit) Forecast, by Application 2019 & 2032
- Table 69: Argentina X Ray Machine Manufacturing Industry Revenue (Million) Forecast, by Application 2019 & 2032
- Table 70: Argentina X Ray Machine Manufacturing Industry Volume (K Unit) Forecast, by Application 2019 & 2032
- Table 71: Peru X Ray Machine Manufacturing Industry Revenue (Million) Forecast, by Application 2019 & 2032
- Table 72: Peru X Ray Machine Manufacturing Industry Volume (K Unit) Forecast, by Application 2019 & 2032
- Table 73: Chile X Ray Machine Manufacturing Industry Revenue (Million) Forecast, by Application 2019 & 2032
- Table 74: Chile X Ray Machine Manufacturing Industry Volume (K Unit) Forecast, by Application 2019 & 2032
- Table 75: Colombia X Ray Machine Manufacturing Industry Revenue (Million) Forecast, by Application 2019 & 2032
- Table 76: Colombia X Ray Machine Manufacturing Industry Volume (K Unit) Forecast, by Application 2019 & 2032
- Table 77: Ecuador X Ray Machine Manufacturing Industry Revenue (Million) Forecast, by Application 2019 & 2032
- Table 78: Ecuador X Ray Machine Manufacturing Industry Volume (K Unit) Forecast, by Application 2019 & 2032
- Table 79: Venezuela X Ray Machine Manufacturing Industry Revenue (Million) Forecast, by Application 2019 & 2032
- Table 80: Venezuela X Ray Machine Manufacturing Industry Volume (K Unit) Forecast, by Application 2019 & 2032
- Table 81: Rest of South America X Ray Machine Manufacturing Industry Revenue (Million) Forecast, by Application 2019 & 2032
- Table 82: Rest of South America X Ray Machine Manufacturing Industry Volume (K Unit) Forecast, by Application 2019 & 2032
- Table 83: Global X Ray Machine Manufacturing Industry Revenue Million Forecast, by Country 2019 & 2032
- Table 84: Global X Ray Machine Manufacturing Industry Volume K Unit Forecast, by Country 2019 & 2032
- Table 85: United States X Ray Machine Manufacturing Industry Revenue (Million) Forecast, by Application 2019 & 2032
- Table 86: United States X Ray Machine Manufacturing Industry Volume (K Unit) Forecast, by Application 2019 & 2032
- Table 87: Canada X Ray Machine Manufacturing Industry Revenue (Million) Forecast, by Application 2019 & 2032
- Table 88: Canada X Ray Machine Manufacturing Industry Volume (K Unit) Forecast, by Application 2019 & 2032
- Table 89: Mexico X Ray Machine Manufacturing Industry Revenue (Million) Forecast, by Application 2019 & 2032
- Table 90: Mexico X Ray Machine Manufacturing Industry Volume (K Unit) Forecast, by Application 2019 & 2032
- Table 91: Global X Ray Machine Manufacturing Industry Revenue Million Forecast, by Country 2019 & 2032
- Table 92: Global X Ray Machine Manufacturing Industry Volume K Unit Forecast, by Country 2019 & 2032
- Table 93: United Arab Emirates X Ray Machine Manufacturing Industry Revenue (Million) Forecast, by Application 2019 & 2032
- Table 94: United Arab Emirates X Ray Machine Manufacturing Industry Volume (K Unit) Forecast, by Application 2019 & 2032
- Table 95: Saudi Arabia X Ray Machine Manufacturing Industry Revenue (Million) Forecast, by Application 2019 & 2032
- Table 96: Saudi Arabia X Ray Machine Manufacturing Industry Volume (K Unit) Forecast, by Application 2019 & 2032
- Table 97: South Africa X Ray Machine Manufacturing Industry Revenue (Million) Forecast, by Application 2019 & 2032
- Table 98: South Africa X Ray Machine Manufacturing Industry Volume (K Unit) Forecast, by Application 2019 & 2032
- Table 99: Rest of Middle East and Africa X Ray Machine Manufacturing Industry Revenue (Million) Forecast, by Application 2019 & 2032
- Table 100: Rest of Middle East and Africa X Ray Machine Manufacturing Industry Volume (K Unit) Forecast, by Application 2019 & 2032
- Table 101: Global X Ray Machine Manufacturing Industry Revenue Million Forecast, by Product Type 2019 & 2032
- Table 102: Global X Ray Machine Manufacturing Industry Volume K Unit Forecast, by Product Type 2019 & 2032
- Table 103: Global X Ray Machine Manufacturing Industry Revenue Million Forecast, by Technology 2019 & 2032
- Table 104: Global X Ray Machine Manufacturing Industry Volume K Unit Forecast, by Technology 2019 & 2032
- Table 105: Global X Ray Machine Manufacturing Industry Revenue Million Forecast, by End-user 2019 & 2032
- Table 106: Global X Ray Machine Manufacturing Industry Volume K Unit Forecast, by End-user 2019 & 2032
- Table 107: Global X Ray Machine Manufacturing Industry Revenue Million Forecast, by Country 2019 & 2032
- Table 108: Global X Ray Machine Manufacturing Industry Volume K Unit Forecast, by Country 2019 & 2032
- Table 109: United States X Ray Machine Manufacturing Industry Revenue (Million) Forecast, by Application 2019 & 2032
- Table 110: United States X Ray Machine Manufacturing Industry Volume (K Unit) Forecast, by Application 2019 & 2032
- Table 111: Canada X Ray Machine Manufacturing Industry Revenue (Million) Forecast, by Application 2019 & 2032
- Table 112: Canada X Ray Machine Manufacturing Industry Volume (K Unit) Forecast, by Application 2019 & 2032
- Table 113: Global X Ray Machine Manufacturing Industry Revenue Million Forecast, by Product Type 2019 & 2032
- Table 114: Global X Ray Machine Manufacturing Industry Volume K Unit Forecast, by Product Type 2019 & 2032
- Table 115: Global X Ray Machine Manufacturing Industry Revenue Million Forecast, by Technology 2019 & 2032
- Table 116: Global X Ray Machine Manufacturing Industry Volume K Unit Forecast, by Technology 2019 & 2032
- Table 117: Global X Ray Machine Manufacturing Industry Revenue Million Forecast, by End-user 2019 & 2032
- Table 118: Global X Ray Machine Manufacturing Industry Volume K Unit Forecast, by End-user 2019 & 2032
- Table 119: Global X Ray Machine Manufacturing Industry Revenue Million Forecast, by Country 2019 & 2032
- Table 120: Global X Ray Machine Manufacturing Industry Volume K Unit Forecast, by Country 2019 & 2032
- Table 121: United Kingdom X Ray Machine Manufacturing Industry Revenue (Million) Forecast, by Application 2019 & 2032
- Table 122: United Kingdom X Ray Machine Manufacturing Industry Volume (K Unit) Forecast, by Application 2019 & 2032
- Table 123: Germany X Ray Machine Manufacturing Industry Revenue (Million) Forecast, by Application 2019 & 2032
- Table 124: Germany X Ray Machine Manufacturing Industry Volume (K Unit) Forecast, by Application 2019 & 2032
- Table 125: France X Ray Machine Manufacturing Industry Revenue (Million) Forecast, by Application 2019 & 2032
- Table 126: France X Ray Machine Manufacturing Industry Volume (K Unit) Forecast, by Application 2019 & 2032
- Table 127: Global X Ray Machine Manufacturing Industry Revenue Million Forecast, by Product Type 2019 & 2032
- Table 128: Global X Ray Machine Manufacturing Industry Volume K Unit Forecast, by Product Type 2019 & 2032
- Table 129: Global X Ray Machine Manufacturing Industry Revenue Million Forecast, by Technology 2019 & 2032
- Table 130: Global X Ray Machine Manufacturing Industry Volume K Unit Forecast, by Technology 2019 & 2032
- Table 131: Global X Ray Machine Manufacturing Industry Revenue Million Forecast, by End-user 2019 & 2032
- Table 132: Global X Ray Machine Manufacturing Industry Volume K Unit Forecast, by End-user 2019 & 2032
- Table 133: Global X Ray Machine Manufacturing Industry Revenue Million Forecast, by Country 2019 & 2032
- Table 134: Global X Ray Machine Manufacturing Industry Volume K Unit Forecast, by Country 2019 & 2032
- Table 135: China X Ray Machine Manufacturing Industry Revenue (Million) Forecast, by Application 2019 & 2032
- Table 136: China X Ray Machine Manufacturing Industry Volume (K Unit) Forecast, by Application 2019 & 2032
- Table 137: Japan X Ray Machine Manufacturing Industry Revenue (Million) Forecast, by Application 2019 & 2032
- Table 138: Japan X Ray Machine Manufacturing Industry Volume (K Unit) Forecast, by Application 2019 & 2032
- Table 139: India X Ray Machine Manufacturing Industry Revenue (Million) Forecast, by Application 2019 & 2032
- Table 140: India X Ray Machine Manufacturing Industry Volume (K Unit) Forecast, by Application 2019 & 2032
- Table 141: South Korea X Ray Machine Manufacturing Industry Revenue (Million) Forecast, by Application 2019 & 2032
- Table 142: South Korea X Ray Machine Manufacturing Industry Volume (K Unit) Forecast, by Application 2019 & 2032
- Table 143: Global X Ray Machine Manufacturing Industry Revenue Million Forecast, by Product Type 2019 & 2032
- Table 144: Global X Ray Machine Manufacturing Industry Volume K Unit Forecast, by Product Type 2019 & 2032
- Table 145: Global X Ray Machine Manufacturing Industry Revenue Million Forecast, by Technology 2019 & 2032
- Table 146: Global X Ray Machine Manufacturing Industry Volume K Unit Forecast, by Technology 2019 & 2032
- Table 147: Global X Ray Machine Manufacturing Industry Revenue Million Forecast, by End-user 2019 & 2032
- Table 148: Global X Ray Machine Manufacturing Industry Volume K Unit Forecast, by End-user 2019 & 2032
- Table 149: Global X Ray Machine Manufacturing Industry Revenue Million Forecast, by Country 2019 & 2032
- Table 150: Global X Ray Machine Manufacturing Industry Volume K Unit Forecast, by Country 2019 & 2032
- Table 151: Global X Ray Machine Manufacturing Industry Revenue Million Forecast, by Product Type 2019 & 2032
- Table 152: Global X Ray Machine Manufacturing Industry Volume K Unit Forecast, by Product Type 2019 & 2032
- Table 153: Global X Ray Machine Manufacturing Industry Revenue Million Forecast, by Technology 2019 & 2032
- Table 154: Global X Ray Machine Manufacturing Industry Volume K Unit Forecast, by Technology 2019 & 2032
- Table 155: Global X Ray Machine Manufacturing Industry Revenue Million Forecast, by End-user 2019 & 2032
- Table 156: Global X Ray Machine Manufacturing Industry Volume K Unit Forecast, by End-user 2019 & 2032
- Table 157: Global X Ray Machine Manufacturing Industry Revenue Million Forecast, by Country 2019 & 2032
- Table 158: Global X Ray Machine Manufacturing Industry Volume K Unit Forecast, by Country 2019 & 2032
Frequently Asked Questions
1. What is the projected Compound Annual Growth Rate (CAGR) of the X Ray Machine Manufacturing Industry?
The projected CAGR is approximately 5.69%.
2. Which companies are prominent players in the X Ray Machine Manufacturing Industry?
Key companies in the market include Canon Inc, Hologic Inc, GE Healthcare, Siemens AG, Philips Healthcare, Hindrays, Hitachi Medical Corporation, Vision Medicaid Equipment Private Limited, Shimadzu Corporation, Fujifilm Holdings Corporation.
3. What are the main segments of the X Ray Machine Manufacturing Industry?
The market segments include Product Type, Technology, End-user.
4. Can you provide details about the market size?
The market size is estimated to be USD 17.70 Million as of 2022.
5. What are some drivers contributing to market growth?
Rise in Adoption of Digital X-ray Systems; Government Regulations and Investments to Improve Infrastructure.
6. What are the notable trends driving market growth?
Healthcare Sector is Expected to Hold a Significant Market Share.
7. Are there any restraints impacting market growth?
High Cost of the Equipment.
8. Can you provide examples of recent developments in the market?
November 2022: Konica Minolta Healthcare Americas, Inc., a global leader in medical diagnostic imaging and healthcare information technology, introduced groundbreaking digital radiography (DR) technologies designed to revolutionize the clinical utility of X-rays.
9. What pricing options are available for accessing the report?
Pricing options include single-user, multi-user, and enterprise licenses priced at USD 4750, USD 5250, and USD 8750 respectively.
10. Is the market size provided in terms of value or volume?
The market size is provided in terms of value, measured in Million and volume, measured in K Unit.
11. Are there any specific market keywords associated with the report?
Yes, the market keyword associated with the report is "X Ray Machine Manufacturing Industry," which aids in identifying and referencing the specific market segment covered.
12. How do I determine which pricing option suits my needs best?
The pricing options vary based on user requirements and access needs. Individual users may opt for single-user licenses, while businesses requiring broader access may choose multi-user or enterprise licenses for cost-effective access to the report.
13. Are there any additional resources or data provided in the X Ray Machine Manufacturing Industry report?
While the report offers comprehensive insights, it's advisable to review the specific contents or supplementary materials provided to ascertain if additional resources or data are available.
14. How can I stay updated on further developments or reports in the X Ray Machine Manufacturing Industry?
To stay informed about further developments, trends, and reports in the X Ray Machine Manufacturing Industry, consider subscribing to industry newsletters, following relevant companies and organizations, or regularly checking reputable industry news sources and publications.
Methodology
Step 1 - Identification of Relevant Samples Size from Population Database


Step 2 - Approaches for Defining Global Market Size (Value, Volume* & Price*)

Note*: In applicable scenarios
Step 3 - Data Sources
Primary Research
- Web Analytics
- Survey Reports
- Research Institute
- Latest Research Reports
- Opinion Leaders
Secondary Research
- Annual Reports
- White Paper
- Latest Press Release
- Industry Association
- Paid Database
- Investor Presentations

Step 4 - Data Triangulation
Involves using different sources of information in order to increase the validity of a study
These sources are likely to be stakeholders in a program - participants, other researchers, program staff, other community members, and so on.
Then we put all data in single framework & apply various statistical tools to find out the dynamic on the market.
During the analysis stage, feedback from the stakeholder groups would be compared to determine areas of agreement as well as areas of divergence
