

Key Insights in 3D Sensing Technology Market
The 3D Sensing Technology Market is currently valued at USD 1220.9 million as of 2023, demonstrating robust expansion driven by pervasive integration across diverse end-use sectors. Projections indicate a substantial increase, with the market anticipated to reach approximately USD 3.38 billion by 2032, exhibiting a compound annual growth rate (CAGR) of 12% over the forecast period. This significant growth trajectory is underpinned by several key demand drivers and macro-economic tailwinds. The increasing adoption of 3D sensing solutions in consumer electronics, particularly for facial recognition, gesture control, and augmented reality applications, stands as a primary catalyst. The widespread deployment of Time-of-Flight Market sensors and structured light solutions in smartphones and other smart devices has democratized access to these advanced capabilities.
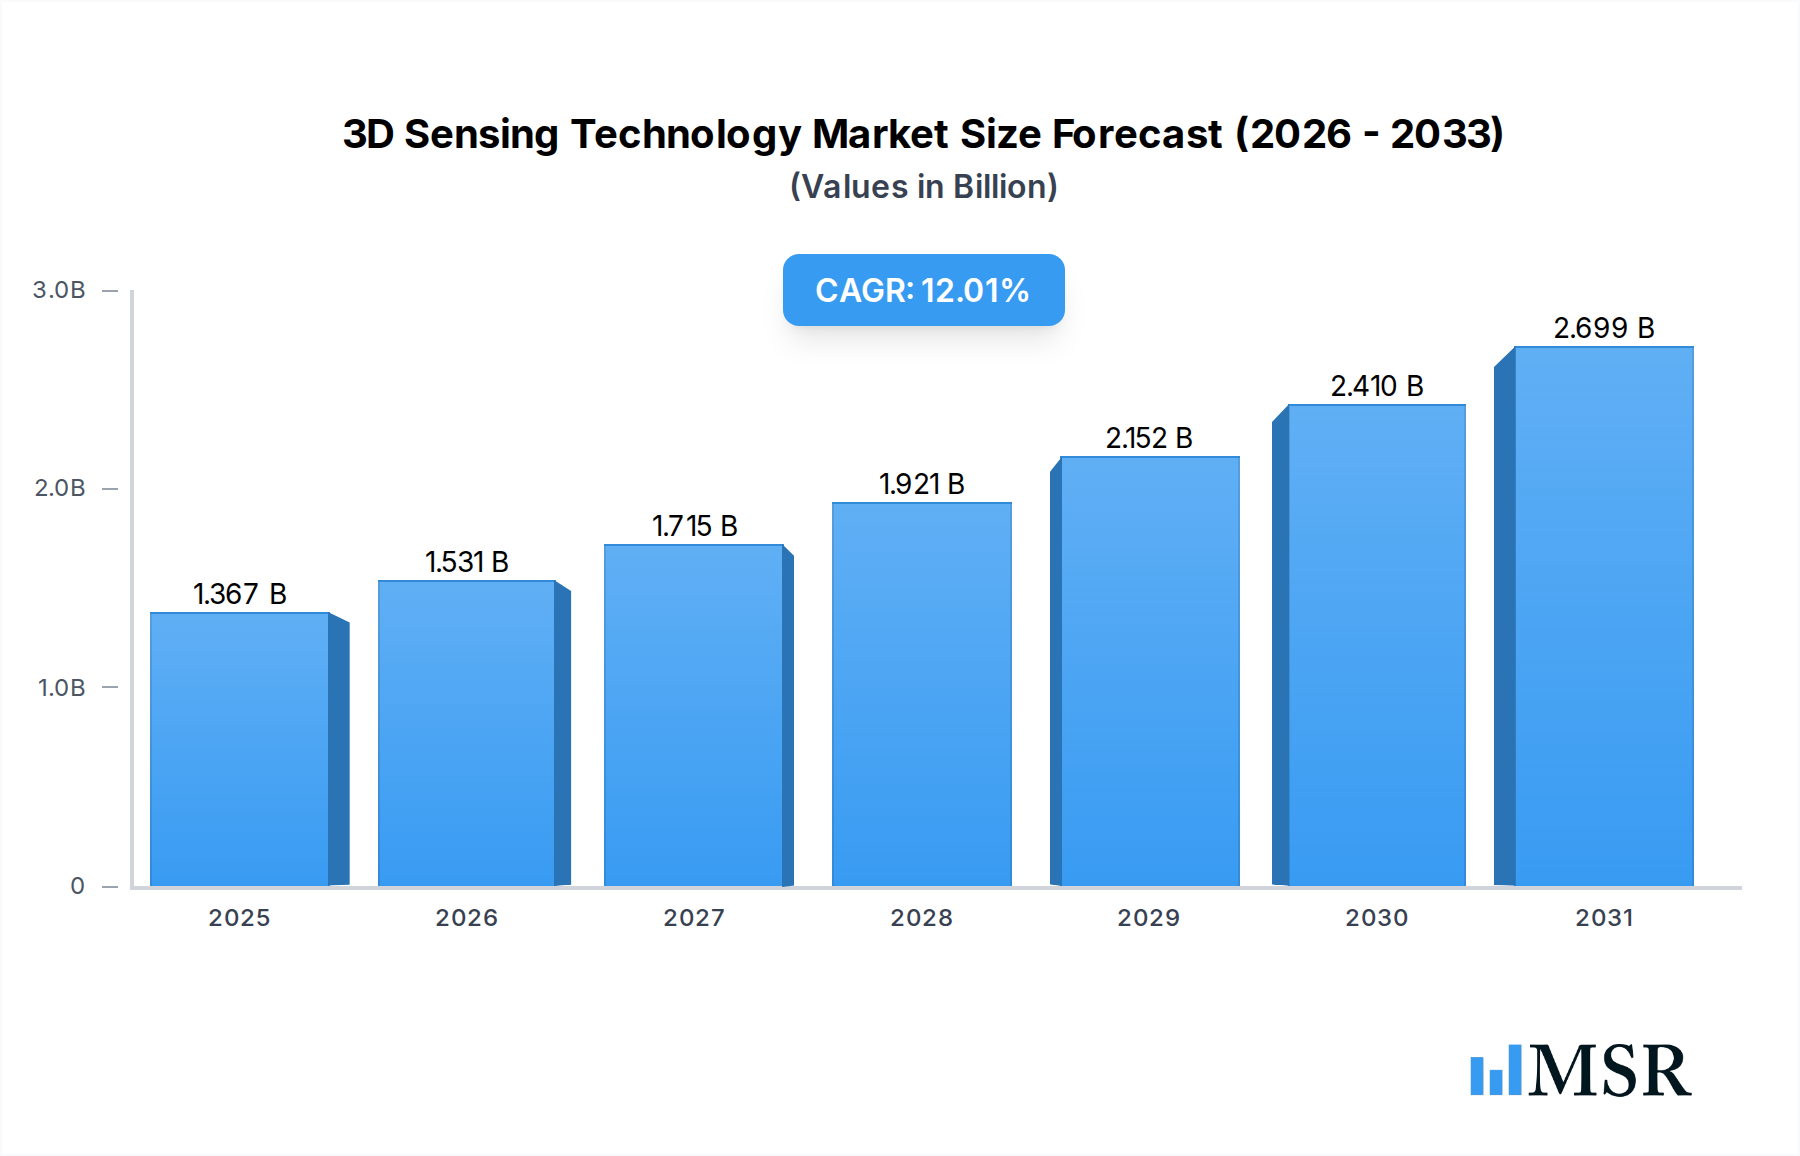
3D Sensing Technology Market Size (In Billion)
Beyond the Consumer Electronics Market, the automotive sector is a critical growth engine, with 3D sensing integral to advanced driver-assistance systems (ADAS) and the progression towards autonomous vehicles. These systems rely on precise depth perception for object detection, collision avoidance, and occupant monitoring. Furthermore, the industrial sector is increasingly leveraging 3D sensing for automation, quality inspection, and logistics, enhancing operational efficiency and precision. Healthcare applications, including surgical navigation, patient monitoring, and medical imaging, also contribute to the market's expansion, driven by the need for high-fidelity spatial data. Macro tailwinds such as miniaturization of sensor components, advancements in artificial intelligence and machine learning algorithms for 3D data processing, and the rising demand for touchless interfaces in public and private spaces are creating fertile ground for innovation and adoption. The ongoing digital transformation across industries, coupled with the proliferation of IoT devices, further amplifies the demand for sophisticated 3D sensing capabilities. The market outlook remains exceptionally positive, characterized by continuous technological innovation, expansion into new application frontiers, and increasing integration into everyday devices and industrial processes, promising sustained high-growth for the 3D Sensing Technology Market.

3D Sensing Technology Company Market Share
Dominant Consumer Electronics Segment in 3D Sensing Technology Market
Within the multifaceted 3D Sensing Technology Market, the Consumer Electronics Market segment, specifically under the 'End User' category, stands as the unequivocal revenue leader. This dominance is primarily attributable to the rapid and extensive integration of 3D sensing technologies into mass-market consumer devices, predominantly smartphones, but also extending to gaming consoles, smart home devices, and virtual/augmented reality headsets. The segment’s growth has been profoundly influenced by the introduction of sophisticated features such as secure facial recognition (e.g., Face ID on Apple devices), gesture recognition for intuitive user interfaces, and advanced computational photography capabilities that leverage depth data. These innovations have not only enhanced user experience but have also become standard expectations for premium devices, driving massive volume production and, consequently, significant market share.
The widespread adoption of 3D sensing in smartphones has been a game-changer. Technologies like structured light and the Time-of-Flight Market sensors have enabled highly accurate and robust facial authentication systems, replacing traditional fingerprint sensors in many high-end models. This application alone represents a significant portion of the segment's revenue, driven by the sheer volume of smartphone shipments globally. Furthermore, the burgeoning Augmented Reality Market, particularly mobile AR, relies heavily on 3D sensing for accurate environmental mapping and object placement, unlocking new immersive experiences for consumers. Key players like Apple Inc., Sony Group Corporation, and Samsung (though not explicitly listed as a core market participant here, a major end-product manufacturer) have been instrumental in driving this adoption, investing heavily in both hardware and software integration.
The consumer electronics segment's dominance is further solidified by its role in driving down the cost and increasing the efficiency of 3D sensing modules through economies of scale. The high volume demand from this sector has spurred innovation in manufacturing processes and led to the miniaturization and cost-reduction of components, making these technologies more accessible for other markets. While other segments like Automotive and Industrial are experiencing high growth, the sheer scale and rapid refresh cycles within the Consumer Electronics Market ensure its continued leadership in terms of revenue share. The ongoing quest for more immersive experiences, enhanced security features, and intuitive user interfaces will continue to fuel innovation and demand within this critical segment of the 3D Sensing Technology Market, with technologies like the Structured Light Market continuously evolving.
Key Market Drivers & Constraints in 3D Sensing Technology Market
The 3D Sensing Technology Market is propelled by a confluence of technological advancements and expanding application horizons, yet it also navigates distinct challenges. A primary driver is the accelerating integration of 3D sensing capabilities into consumer electronics, particularly smartphones and AR/VR devices. This trend is quantified by a consistent year-over-year increase in smartphone models featuring advanced facial recognition and gesture control systems. For instance, the growing deployment of Time-of-Flight Market sensors and structured light modules enables robust biometric security and interactive user experiences, directly stimulating demand for components within the Image Sensors Market. This pervasive integration is fueling the Consumer Electronics Market, driving economies of scale and innovation.
Another significant impetus is the burgeoning demand from the automotive sector for sophisticated Advanced Driver-Assistance Systems (ADAS) and fully autonomous driving solutions. Automotive Sensing Market applications rely heavily on 3D depth perception for accurate object detection, pedestrian recognition, lane keeping, and real-time mapping. The adoption of LiDAR and advanced camera-based 3D vision systems in new vehicle models continues to surge, driven by stringent safety regulations and consumer expectations for autonomous features. Simultaneously, the Industrial Automation Market is increasingly leveraging 3D sensing for enhanced precision in manufacturing, quality inspection, logistics, and robotic navigation. This includes applications such as bin picking, assembly verification, and collaborative robotics, where 3D vision systems significantly improve efficiency and reduce errors. The ongoing evolution of the Robotics and Automation Market is thus directly dependent on advancements in 3D sensing.
Conversely, the market faces several constraints. A significant hurdle remains the relatively high initial cost associated with advanced 3D sensing modules compared to traditional 2D imaging systems. This cost factor can impede broader adoption, particularly in price-sensitive applications. Technical challenges such as maintaining accuracy and performance under diverse environmental conditions (e.g., varying lighting, extreme temperatures, fog) also present limitations. Furthermore, concerns surrounding data privacy and security, especially pertaining to facial recognition and continuous spatial data collection, pose a regulatory and ethical challenge. These concerns can lead to stricter governmental regulations, potentially slowing down market growth in certain application areas, impacting the overall sentiment toward the 3D Sensing Technology Market.
Competitive Ecosystem of 3D Sensing Technology Market
The 3D Sensing Technology Market is characterized by a dynamic competitive landscape featuring a mix of established technology giants and specialized sensor manufacturers. These entities are continuously innovating to enhance sensor performance, reduce size, and lower costs across various applications.
- Sony Group Corporation: A global leader in image sensor technology, particularly dominant in the Image Sensors Market. Sony is a key supplier of Time-of-Flight (ToF) sensors for smartphones and other devices, leveraging its extensive R&D in semiconductor manufacturing to deliver high-performance solutions.
- Apple Inc.: A major driver of 3D sensing adoption, particularly through its integration of structured light technology for Face ID and AR applications in its iPhone and iPad lines. Apple's in-house developments significantly influence the Consumer Electronics Market, pushing the boundaries of miniaturization and software integration.
- Intel Corporation: Known for its RealSense depth-sensing camera technology, Intel offers a range of 3D sensing solutions for various applications, including robotics, drones, and professional use. The company's focus extends to the development of AI-powered perception for advanced computing platforms.
- Infineon Technologies AG: A leading provider of Time-of-Flight (ToF) sensors, particularly for automotive and industrial applications. Infineon collaborates with partners to develop robust and high-performance 3D sensing chips for ADAS and gesture control systems.
- STMicroelectronics: A prominent supplier of Time-of-Flight (ToF) sensors and other microelectronic components. STMicroelectronics' products are widely adopted in consumer electronics, industrial automation, and smart home devices, contributing significantly to the Time-of-Flight Market.
- Texas Instruments Incorporated: Offers a broad portfolio of analog and embedded processing products crucial for 3D sensing systems, including DLP (Digital Light Processing) technology used in some structured light applications. Their components are vital for the efficient operation of 3D sensors.
- Microsoft Corporation: A pioneer in 3D sensing with its Kinect technology, Microsoft continues to innovate in areas like HoloLens, which leverages advanced 3D sensing for mixed reality applications. Their focus is on enterprise and industrial solutions that benefit from the Augmented Reality Market.
- OmniVision Technologies, Inc.: Specializes in advanced digital imaging solutions, including 3D sensing technologies for mobile, automotive, and medical applications. OmniVision's expertise in compact, low-power image sensors positions it well in the broader Image Sensors Market.
- Lumentum Holdings Inc.: A leading designer and manufacturer of innovative optical and photonic products, including VCSEL (Vertical Cavity Surface-Emitting Laser) diodes which are critical components for structured light and Time-of-Flight Market solutions in consumer electronics.
- Basler AG: A leading manufacturer of industrial cameras with a strong focus on computer vision and 3D imaging solutions for the Industrial Automation Market. Basler provides high-quality cameras and software for various industrial inspection and automation tasks.
- Cognex Corporation: A global leader in machine vision products and systems, including 3D vision sensors for factory automation and quality inspection. Cognex solutions are crucial for precision and efficiency in high-volume manufacturing environments.
- Teledyne Technologies Incorporated: Offers a comprehensive range of advanced instrumentation, digital imaging products, and aerospace and defense electronics. Their imaging segment provides specialized 3D sensing cameras and components for demanding industrial and scientific applications.
Recent Developments & Milestones in 3D Sensing Technology Market
The 3D Sensing Technology Market has witnessed a series of strategic advancements and product introductions aimed at enhancing performance, reducing form factors, and expanding application reach.
- Q4 2022: Leading sensor manufacturers announced the launch of next-generation Time-of-Flight (ToF) sensors, featuring significantly improved depth accuracy and lower power consumption. These sensors are primarily targeting premium smartphones and advanced augmented reality devices, further fueling the Time-of-Flight Market.
- Q2 2023: A prominent automotive technology supplier partnered with a major OEM to integrate sophisticated 3D LiDAR systems into their upcoming electric vehicle platforms. This collaboration aims to achieve Level 3 autonomy capabilities, signifying a major stride for the Automotive Sensing Market.
- Q1 2024: An acquisition was completed involving a startup specializing in compact Structured Light Market technology by a global consumer electronics conglomerate. This move is expected to bolster the acquirer's portfolio in facial recognition and gesture control for its next line of smart devices.
- Q3 2024: Several industrial vision companies unveiled new lines of robust 3D stereo vision cameras designed for challenging factory environments. These systems offer enhanced object detection and measurement capabilities, critical for advanced automation and quality control in the Industrial Automation Market.
- Q1 2025: Research institutions and private firms reported breakthroughs in AI-powered 3D perception software, enabling more accurate and real-time environmental understanding for autonomous robots. These software innovations are set to significantly impact the Robotics and Automation Market by improving navigation and manipulation capabilities.
- Q2 2025: A new generation of optical components for 3D sensing, including micro-lenses and diffusers, entered mass production, promising to further miniaturize sensor modules and improve their performance-to-cost ratio, benefiting the overall 3D Sensing Technology Market.
- Q3 2025: Healthcare technology providers announced pilot programs for 3D sensing in surgical navigation and rehabilitation, showcasing the potential for non-invasive, high-precision spatial tracking in medical applications.
Regional Market Breakdown for 3D Sensing Technology Market
The global 3D Sensing Technology Market exhibits distinct regional dynamics, influenced by technological adoption rates, industrial infrastructure, and consumer spending patterns. Asia Pacific currently holds the dominant share and is projected to be the fastest-growing region, driven by its robust manufacturing base for consumer electronics, high population density, and rapid urbanization. Countries like China, Japan, and South Korea are at the forefront of smartphone production and adoption, heavily integrating 3D sensing for facial recognition and augmented reality applications, significantly contributing to the Consumer Electronics Market. Additionally, the burgeoning automotive industry in countries like China and India is increasingly incorporating 3D sensing technologies for ADAS and autonomous driving, propelling the Automotive Sensing Market.
North America represents a significant market, characterized by early adoption of advanced technologies and a strong presence of key industry players such as Apple, Intel, and Microsoft. The region's demand is fueled by innovation in consumer electronics, a robust defense and aerospace sector leveraging 3D sensing for mapping and navigation, and substantial investment in the Augmented Reality Market. High R&D expenditure and a culture of technological advancement contribute to a steady, high-value growth trajectory for the 3D Sensing Technology Market here.
Europe holds a mature market share, driven primarily by its strong industrial automation sector and high-end automotive manufacturing. Germany, in particular, is a hub for industrial machinery and automotive innovation, leading to significant uptake of 3D vision systems for quality inspection, robotics, and logistics in the Industrial Automation Market. The region also demonstrates strong growth in healthcare applications of 3D sensing. The market growth in Europe is steady, albeit at a slightly lower CAGR compared to Asia Pacific, reflecting its maturity and stringent regulatory landscape.
The Middle East & Africa and South America regions represent emerging markets for 3D sensing technology. While their current market shares are smaller, they are experiencing increasing penetration of smartphones and a growing focus on smart city initiatives and industrial modernization. These regions are anticipated to show promising growth rates as infrastructure develops and disposable incomes rise, leading to increased adoption of consumer electronics and industrial automation solutions. However, their contribution to the global 3D Sensing Technology Market remains relatively minor in the immediate term, with growth driven by localized partnerships and expanding digital infrastructure.
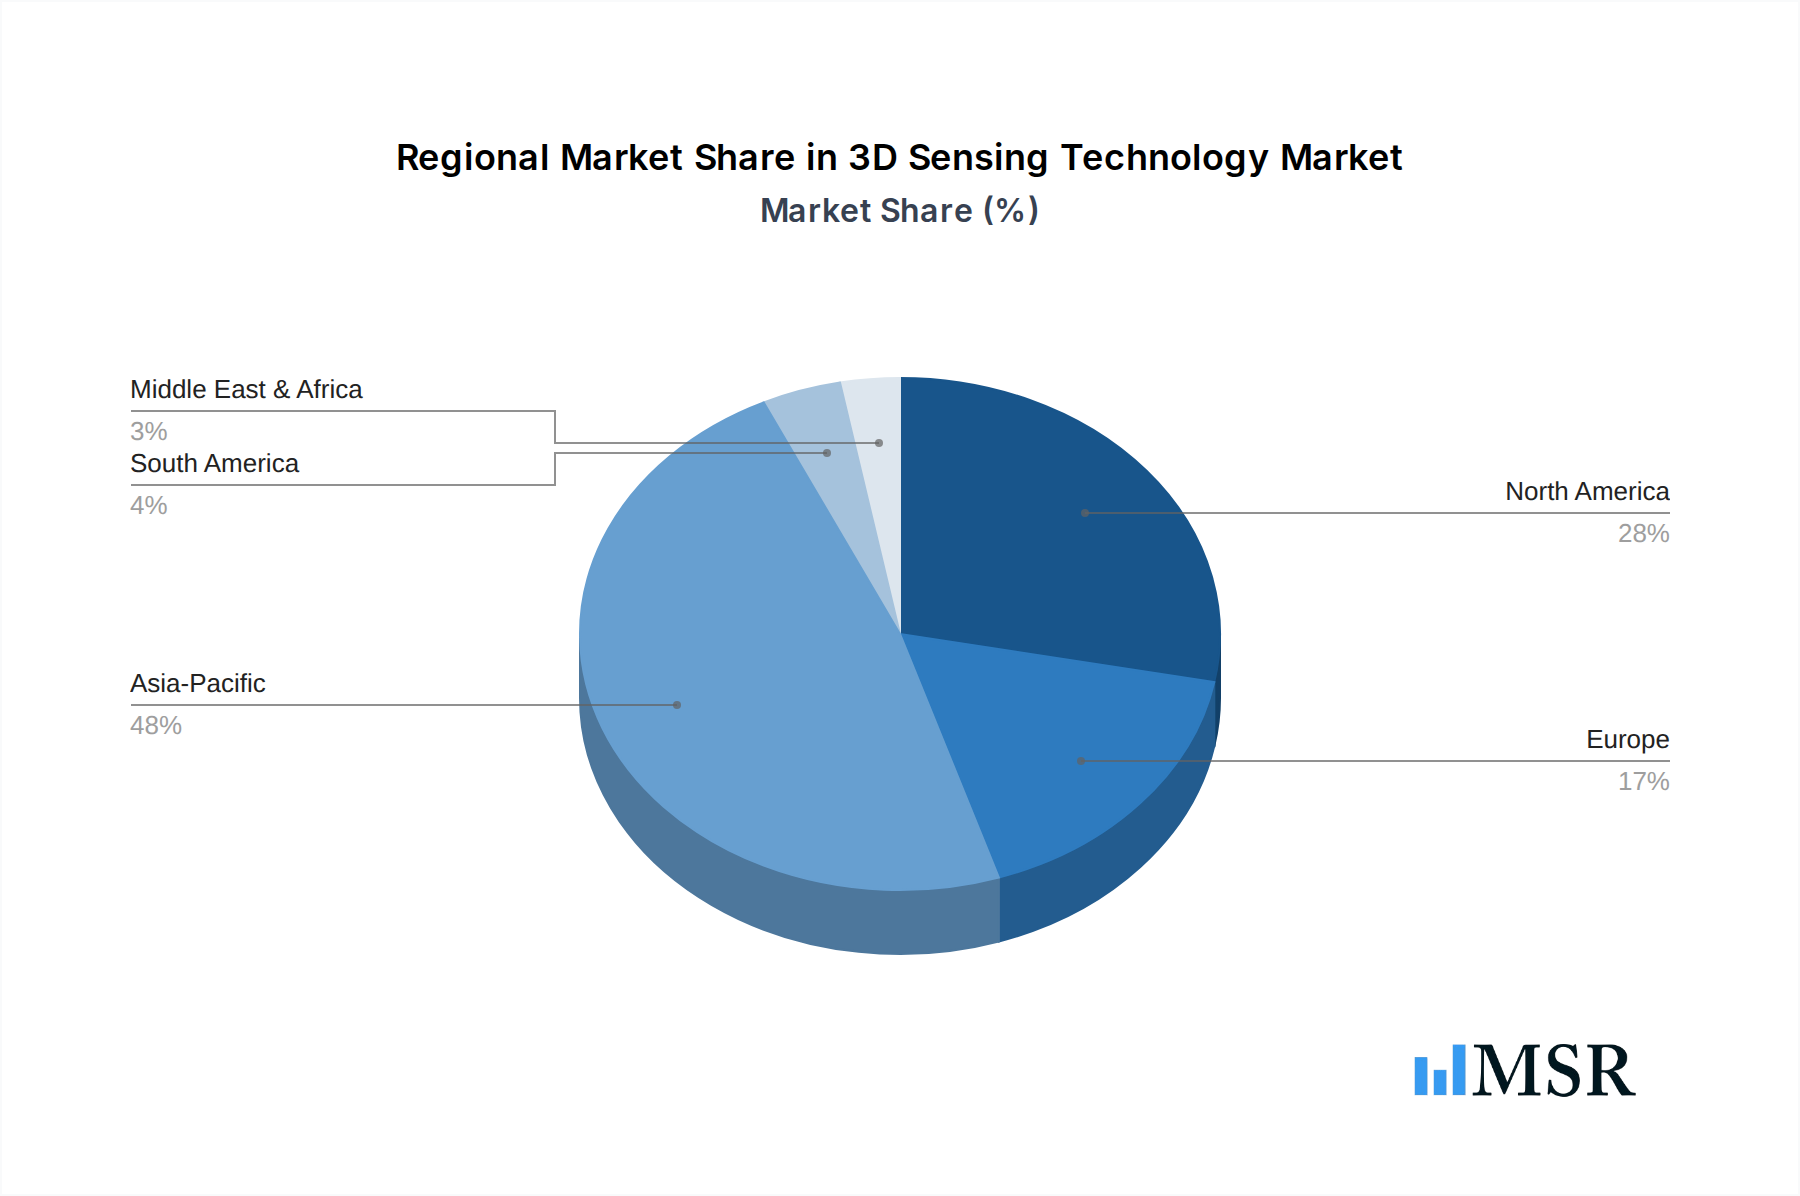
3D Sensing Technology Regional Market Share
Supply Chain & Raw Material Dynamics for 3D Sensing Technology Market
The supply chain for the 3D Sensing Technology Market is inherently complex, characterized by deep dependencies on advanced manufacturing processes and specialized raw materials. Upstream, the market is heavily reliant on the Semiconductor Devices Market, which provides the integrated circuits, microcontrollers, and application-specific integrated circuits (ASICs) essential for processing 3D data. Key components include VCSEL (Vertical Cavity Surface-Emitting Laser) diodes, infrared (IR) emitters, and photodiodes, which are fundamental to Time-of-Flight Market and Structured Light Market systems. Optical components such as lenses, filters, and diffusers, often requiring high precision and specialized coatings, also represent critical inputs.
Sourcing risks are significant, primarily stemming from the concentrated nature of semiconductor manufacturing in a few key geographical regions (e.g., Taiwan for advanced foundry services). Geopolitical tensions, trade disputes, and natural disasters can disrupt the supply of these critical components, leading to delays and increased costs across the entire market. For instance, the global chip shortage experienced in 2021–2022 significantly impacted production timelines for various 3D sensing applications, particularly in the Consumer Electronics Market and the Automotive Sensing Market. Price volatility of key inputs like silicon wafers, specialized optical-grade glass, and certain rare earth elements used in high-performance sensors can directly affect the profitability and pricing strategies of sensor manufacturers. The cost of advanced packaging and assembly services, often requiring highly specialized cleanroom facilities, also contributes to the overall manufacturing expense.
Ensuring a resilient supply chain involves strategic partnerships with multiple suppliers, diversification of manufacturing locations, and investment in in-house production capabilities where feasible. The increasing demand for 3D sensing across diverse applications, from the Augmented Reality Market to the Industrial Automation Market, places continuous pressure on the supply chain to innovate and scale production efficiently while managing inherent risks. The dynamic interplay between raw material availability, processing capabilities in the Semiconductor Devices Market, and geopolitical stability dictates much of the operational resilience of the 3D Sensing Technology Market.
Investment & Funding Activity in 3D Sensing Technology Market
Investment and funding activities in the 3D Sensing Technology Market have been robust over the past few years, reflecting the market's high growth potential and strategic importance across various industries. Mergers and acquisitions (M&A) have been a prominent feature, with larger technology companies acquiring smaller, innovative startups to bolster their intellectual property and expand their market reach. For example, major players in the Consumer Electronics Market and Automotive Sensing Market have acquired companies specializing in specific 3D imaging algorithms or novel sensor designs to gain a competitive edge. These acquisitions often target firms with expertise in Structured Light Market or Time-of-Flight Market technologies, enhancing capabilities in areas like facial recognition and spatial mapping.
Venture funding rounds have seen significant capital flowing into startups developing next-generation 3D sensing solutions. Companies focusing on specialized applications, such as high-resolution medical imaging, advanced robotic vision for the Robotics and Automation Market, or precise quality inspection in manufacturing, have attracted substantial investments. Moreover, startups innovating in areas like compact LiDAR systems for autonomous vehicles or highly efficient Image Sensors Market for mobile devices are prime candidates for venture capital, given the immense market potential. The Augmented Reality Market, in particular, has been a hotbed for investment, as 3D sensing is fundamental to creating immersive and interactive AR experiences, driving funding for companies that can provide accurate real-time environmental understanding.
Strategic partnerships are also a critical element of the investment landscape. Sensor manufacturers often collaborate with original equipment manufacturers (OEMs) in the automotive, consumer electronics, and industrial sectors to co-develop integrated solutions. These partnerships ensure the seamless integration of 3D sensing hardware with host systems and software, accelerating time-to-market for new products and features. Investments are increasingly focused on software and AI layers that complement the hardware, enabling more intelligent interpretation of 3D data. This holistic approach to funding, covering everything from core Semiconductor Devices Market components to application-specific software, underscores the comprehensive growth strategy driving the 3D Sensing Technology Market.
3D Sensing Technology Segmentation
-
1. Technology
- 1.1. Time-of-Flight (ToF)
- 1.2. Structured Light
- 1.3. Stereoscopic Vision
- 1.4. Ultrasound
- 1.5. Others
-
2. Sensor Type
- 2.1. Image Sensors
- 2.2. Position Sensors
- 2.3. Proximity Sensors
- 2.4. Acoustic Sensors
- 2.5. Accelerometers/Gyroscopes
- 2.6. Others
-
3. Connectivity
- 3.1. Wired
- 3.2. Wireless
-
4. Application
- 4.1. Facial Recognition
- 4.2. Gesture Recognition
- 4.3. Object Detection
- 4.4. Quality Inspection
- 4.5. Mapping & Navigation
- 4.6. Others
-
5. End User
- 5.1. Consumer Electronics
- 5.2. Automotive
- 5.3. Industrial
- 5.4. Healthcare
- 5.5. Aerospace & Defense
- 5.6. Others
3D Sensing Technology Segmentation By Geography
-
1. North America
- 1.1. United States
- 1.2. Canada
- 1.3. Mexico
-
2. South America
- 2.1. Brazil
- 2.2. Argentina
- 2.3. Rest of South America
-
3. Europe
- 3.1. United Kingdom
- 3.2. Germany
- 3.3. France
- 3.4. Italy
- 3.5. Spain
- 3.6. Russia
- 3.7. Benelux
- 3.8. Nordics
- 3.9. Rest of Europe
-
4. Middle East & Africa
- 4.1. Turkey
- 4.2. Israel
- 4.3. GCC
- 4.4. North Africa
- 4.5. South Africa
- 4.6. Rest of Middle East & Africa
-
5. Asia Pacific
- 5.1. China
- 5.2. India
- 5.3. Japan
- 5.4. South Korea
- 5.5. ASEAN
- 5.6. Oceania
- 5.7. Rest of Asia Pacific
3D Sensing Technology Regional Market Share
Geographic Coverage of 3D Sensing Technology
3D Sensing Technology REPORT HIGHLIGHTS
| Aspects | Details |
|---|---|
| Study Period | 2020-2034 |
| Base Year | 2025 |
| Estimated Year | 2026 |
| Forecast Period | 2026-2034 |
| Historical Period | 2020-2025 |
| Growth Rate | CAGR of 24.2% from 2020-2034 |
| Segmentation |
|
Table of Contents
- 1. Introduction
- 1.1. Research Scope
- 1.2. Market Segmentation
- 1.3. Research Objective
- 1.4. Definitions and Assumptions
- 2. Executive Summary
- 2.1. Market Snapshot
- 3. Market Dynamics
- 3.1. Market Drivers
- 3.2. Market Restrains
- 3.3. Market Trends
- 3.4. Market Opportunities
- 4. Market Factor Analysis
- 4.1. Porters Five Forces
- 4.1.1. Bargaining Power of Suppliers
- 4.1.2. Bargaining Power of Buyers
- 4.1.3. Threat of New Entrants
- 4.1.4. Threat of Substitutes
- 4.1.5. Competitive Rivalry
- 4.2. PESTEL analysis
- 4.3. BCG Analysis
- 4.3.1. Stars (High Growth, High Market Share)
- 4.3.2. Cash Cows (Low Growth, High Market Share)
- 4.3.3. Question Mark (High Growth, Low Market Share)
- 4.3.4. Dogs (Low Growth, Low Market Share)
- 4.4. Ansoff Matrix Analysis
- 4.5. Supply Chain Analysis
- 4.6. Regulatory Landscape
- 4.7. Current Market Potential and Opportunity Assessment (TAM–SAM–SOM Framework)
- 4.8. MSR Analyst Note
- 4.1. Porters Five Forces
- 5. Market Analysis, Insights and Forecast 2021-2033
- 5.1. Market Analysis, Insights and Forecast - by Technology
- 5.1.1. Time-of-Flight (ToF)
- 5.1.2. Structured Light
- 5.1.3. Stereoscopic Vision
- 5.1.4. Ultrasound
- 5.1.5. Others
- 5.2. Market Analysis, Insights and Forecast - by Sensor Type
- 5.2.1. Image Sensors
- 5.2.2. Position Sensors
- 5.2.3. Proximity Sensors
- 5.2.4. Acoustic Sensors
- 5.2.5. Accelerometers/Gyroscopes
- 5.2.6. Others
- 5.3. Market Analysis, Insights and Forecast - by Connectivity
- 5.3.1. Wired
- 5.3.2. Wireless
- 5.4. Market Analysis, Insights and Forecast - by Application
- 5.4.1. Facial Recognition
- 5.4.2. Gesture Recognition
- 5.4.3. Object Detection
- 5.4.4. Quality Inspection
- 5.4.5. Mapping & Navigation
- 5.4.6. Others
- 5.5. Market Analysis, Insights and Forecast - by End User
- 5.5.1. Consumer Electronics
- 5.5.2. Automotive
- 5.5.3. Industrial
- 5.5.4. Healthcare
- 5.5.5. Aerospace & Defense
- 5.5.6. Others
- 5.6. Market Analysis, Insights and Forecast - by Region
- 5.6.1. North America
- 5.6.2. South America
- 5.6.3. Europe
- 5.6.4. Middle East & Africa
- 5.6.5. Asia Pacific
- 5.1. Market Analysis, Insights and Forecast - by Technology
- 6. Global 3D Sensing Technology Analysis, Insights and Forecast, 2021-2033
- 6.1. Market Analysis, Insights and Forecast - by Technology
- 6.1.1. Time-of-Flight (ToF)
- 6.1.2. Structured Light
- 6.1.3. Stereoscopic Vision
- 6.1.4. Ultrasound
- 6.1.5. Others
- 6.2. Market Analysis, Insights and Forecast - by Sensor Type
- 6.2.1. Image Sensors
- 6.2.2. Position Sensors
- 6.2.3. Proximity Sensors
- 6.2.4. Acoustic Sensors
- 6.2.5. Accelerometers/Gyroscopes
- 6.2.6. Others
- 6.3. Market Analysis, Insights and Forecast - by Connectivity
- 6.3.1. Wired
- 6.3.2. Wireless
- 6.4. Market Analysis, Insights and Forecast - by Application
- 6.4.1. Facial Recognition
- 6.4.2. Gesture Recognition
- 6.4.3. Object Detection
- 6.4.4. Quality Inspection
- 6.4.5. Mapping & Navigation
- 6.4.6. Others
- 6.5. Market Analysis, Insights and Forecast - by End User
- 6.5.1. Consumer Electronics
- 6.5.2. Automotive
- 6.5.3. Industrial
- 6.5.4. Healthcare
- 6.5.5. Aerospace & Defense
- 6.5.6. Others
- 6.1. Market Analysis, Insights and Forecast - by Technology
- 7. North America 3D Sensing Technology Analysis, Insights and Forecast, 2020-2032
- 7.1. Market Analysis, Insights and Forecast - by Technology
- 7.1.1. Time-of-Flight (ToF)
- 7.1.2. Structured Light
- 7.1.3. Stereoscopic Vision
- 7.1.4. Ultrasound
- 7.1.5. Others
- 7.2. Market Analysis, Insights and Forecast - by Sensor Type
- 7.2.1. Image Sensors
- 7.2.2. Position Sensors
- 7.2.3. Proximity Sensors
- 7.2.4. Acoustic Sensors
- 7.2.5. Accelerometers/Gyroscopes
- 7.2.6. Others
- 7.3. Market Analysis, Insights and Forecast - by Connectivity
- 7.3.1. Wired
- 7.3.2. Wireless
- 7.4. Market Analysis, Insights and Forecast - by Application
- 7.4.1. Facial Recognition
- 7.4.2. Gesture Recognition
- 7.4.3. Object Detection
- 7.4.4. Quality Inspection
- 7.4.5. Mapping & Navigation
- 7.4.6. Others
- 7.5. Market Analysis, Insights and Forecast - by End User
- 7.5.1. Consumer Electronics
- 7.5.2. Automotive
- 7.5.3. Industrial
- 7.5.4. Healthcare
- 7.5.5. Aerospace & Defense
- 7.5.6. Others
- 7.1. Market Analysis, Insights and Forecast - by Technology
- 8. South America 3D Sensing Technology Analysis, Insights and Forecast, 2020-2032
- 8.1. Market Analysis, Insights and Forecast - by Technology
- 8.1.1. Time-of-Flight (ToF)
- 8.1.2. Structured Light
- 8.1.3. Stereoscopic Vision
- 8.1.4. Ultrasound
- 8.1.5. Others
- 8.2. Market Analysis, Insights and Forecast - by Sensor Type
- 8.2.1. Image Sensors
- 8.2.2. Position Sensors
- 8.2.3. Proximity Sensors
- 8.2.4. Acoustic Sensors
- 8.2.5. Accelerometers/Gyroscopes
- 8.2.6. Others
- 8.3. Market Analysis, Insights and Forecast - by Connectivity
- 8.3.1. Wired
- 8.3.2. Wireless
- 8.4. Market Analysis, Insights and Forecast - by Application
- 8.4.1. Facial Recognition
- 8.4.2. Gesture Recognition
- 8.4.3. Object Detection
- 8.4.4. Quality Inspection
- 8.4.5. Mapping & Navigation
- 8.4.6. Others
- 8.5. Market Analysis, Insights and Forecast - by End User
- 8.5.1. Consumer Electronics
- 8.5.2. Automotive
- 8.5.3. Industrial
- 8.5.4. Healthcare
- 8.5.5. Aerospace & Defense
- 8.5.6. Others
- 8.1. Market Analysis, Insights and Forecast - by Technology
- 9. Europe 3D Sensing Technology Analysis, Insights and Forecast, 2020-2032
- 9.1. Market Analysis, Insights and Forecast - by Technology
- 9.1.1. Time-of-Flight (ToF)
- 9.1.2. Structured Light
- 9.1.3. Stereoscopic Vision
- 9.1.4. Ultrasound
- 9.1.5. Others
- 9.2. Market Analysis, Insights and Forecast - by Sensor Type
- 9.2.1. Image Sensors
- 9.2.2. Position Sensors
- 9.2.3. Proximity Sensors
- 9.2.4. Acoustic Sensors
- 9.2.5. Accelerometers/Gyroscopes
- 9.2.6. Others
- 9.3. Market Analysis, Insights and Forecast - by Connectivity
- 9.3.1. Wired
- 9.3.2. Wireless
- 9.4. Market Analysis, Insights and Forecast - by Application
- 9.4.1. Facial Recognition
- 9.4.2. Gesture Recognition
- 9.4.3. Object Detection
- 9.4.4. Quality Inspection
- 9.4.5. Mapping & Navigation
- 9.4.6. Others
- 9.5. Market Analysis, Insights and Forecast - by End User
- 9.5.1. Consumer Electronics
- 9.5.2. Automotive
- 9.5.3. Industrial
- 9.5.4. Healthcare
- 9.5.5. Aerospace & Defense
- 9.5.6. Others
- 9.1. Market Analysis, Insights and Forecast - by Technology
- 10. Middle East & Africa 3D Sensing Technology Analysis, Insights and Forecast, 2020-2032
- 10.1. Market Analysis, Insights and Forecast - by Technology
- 10.1.1. Time-of-Flight (ToF)
- 10.1.2. Structured Light
- 10.1.3. Stereoscopic Vision
- 10.1.4. Ultrasound
- 10.1.5. Others
- 10.2. Market Analysis, Insights and Forecast - by Sensor Type
- 10.2.1. Image Sensors
- 10.2.2. Position Sensors
- 10.2.3. Proximity Sensors
- 10.2.4. Acoustic Sensors
- 10.2.5. Accelerometers/Gyroscopes
- 10.2.6. Others
- 10.3. Market Analysis, Insights and Forecast - by Connectivity
- 10.3.1. Wired
- 10.3.2. Wireless
- 10.4. Market Analysis, Insights and Forecast - by Application
- 10.4.1. Facial Recognition
- 10.4.2. Gesture Recognition
- 10.4.3. Object Detection
- 10.4.4. Quality Inspection
- 10.4.5. Mapping & Navigation
- 10.4.6. Others
- 10.5. Market Analysis, Insights and Forecast - by End User
- 10.5.1. Consumer Electronics
- 10.5.2. Automotive
- 10.5.3. Industrial
- 10.5.4. Healthcare
- 10.5.5. Aerospace & Defense
- 10.5.6. Others
- 10.1. Market Analysis, Insights and Forecast - by Technology
- 11. Asia Pacific 3D Sensing Technology Analysis, Insights and Forecast, 2020-2032
- 11.1. Market Analysis, Insights and Forecast - by Technology
- 11.1.1. Time-of-Flight (ToF)
- 11.1.2. Structured Light
- 11.1.3. Stereoscopic Vision
- 11.1.4. Ultrasound
- 11.1.5. Others
- 11.2. Market Analysis, Insights and Forecast - by Sensor Type
- 11.2.1. Image Sensors
- 11.2.2. Position Sensors
- 11.2.3. Proximity Sensors
- 11.2.4. Acoustic Sensors
- 11.2.5. Accelerometers/Gyroscopes
- 11.2.6. Others
- 11.3. Market Analysis, Insights and Forecast - by Connectivity
- 11.3.1. Wired
- 11.3.2. Wireless
- 11.4. Market Analysis, Insights and Forecast - by Application
- 11.4.1. Facial Recognition
- 11.4.2. Gesture Recognition
- 11.4.3. Object Detection
- 11.4.4. Quality Inspection
- 11.4.5. Mapping & Navigation
- 11.4.6. Others
- 11.5. Market Analysis, Insights and Forecast - by End User
- 11.5.1. Consumer Electronics
- 11.5.2. Automotive
- 11.5.3. Industrial
- 11.5.4. Healthcare
- 11.5.5. Aerospace & Defense
- 11.5.6. Others
- 11.1. Market Analysis, Insights and Forecast - by Technology
- 12. Competitive Analysis
- 12.1. Company Profiles
- 12.1.1 Sony Group Corporation
- 12.1.1.1. Company Overview
- 12.1.1.2. Products
- 12.1.1.3. Company Financials
- 12.1.1.4. SWOT Analysis
- 12.1.2 Apple Inc.
- 12.1.2.1. Company Overview
- 12.1.2.2. Products
- 12.1.2.3. Company Financials
- 12.1.2.4. SWOT Analysis
- 12.1.3 Intel Corporation
- 12.1.3.1. Company Overview
- 12.1.3.2. Products
- 12.1.3.3. Company Financials
- 12.1.3.4. SWOT Analysis
- 12.1.4 Infineon Technologies AG
- 12.1.4.1. Company Overview
- 12.1.4.2. Products
- 12.1.4.3. Company Financials
- 12.1.4.4. SWOT Analysis
- 12.1.5 STMicroelectronics
- 12.1.5.1. Company Overview
- 12.1.5.2. Products
- 12.1.5.3. Company Financials
- 12.1.5.4. SWOT Analysis
- 12.1.6 Texas Instruments Incorporated
- 12.1.6.1. Company Overview
- 12.1.6.2. Products
- 12.1.6.3. Company Financials
- 12.1.6.4. SWOT Analysis
- 12.1.7 Microsoft Corporation
- 12.1.7.1. Company Overview
- 12.1.7.2. Products
- 12.1.7.3. Company Financials
- 12.1.7.4. SWOT Analysis
- 12.1.8 OmniVision Technologies Inc.
- 12.1.8.1. Company Overview
- 12.1.8.2. Products
- 12.1.8.3. Company Financials
- 12.1.8.4. SWOT Analysis
- 12.1.9 Lumentum Holdings Inc.
- 12.1.9.1. Company Overview
- 12.1.9.2. Products
- 12.1.9.3. Company Financials
- 12.1.9.4. SWOT Analysis
- 12.1.10 Basler AG
- 12.1.10.1. Company Overview
- 12.1.10.2. Products
- 12.1.10.3. Company Financials
- 12.1.10.4. SWOT Analysis
- 12.1.11 Cognex Corporation
- 12.1.11.1. Company Overview
- 12.1.11.2. Products
- 12.1.11.3. Company Financials
- 12.1.11.4. SWOT Analysis
- 12.1.12 Teledyne Technologies Incorporated
- 12.1.12.1. Company Overview
- 12.1.12.2. Products
- 12.1.12.3. Company Financials
- 12.1.12.4. SWOT Analysis
- 12.1.13 Others
- 12.1.13.1. Company Overview
- 12.1.13.2. Products
- 12.1.13.3. Company Financials
- 12.1.13.4. SWOT Analysis
- 12.1.1 Sony Group Corporation
- 12.2. Market Entropy
- 12.2.1 Company's Key Areas Served
- 12.2.2 Recent Developments
- 12.3. Company Market Share Analysis 2025
- 12.3.1 Top 5 Companies Market Share Analysis
- 12.3.2 Top 3 Companies Market Share Analysis
- 12.4. List of Potential Customers
- 13. Research Methodology
List of Figures
- Figure 1: Global 3D Sensing Technology Revenue Breakdown (billion, %) by Region 2025 & 2033
- Figure 2: North America 3D Sensing Technology Revenue (billion), by Technology 2025 & 2033
- Figure 3: North America 3D Sensing Technology Revenue Share (%), by Technology 2025 & 2033
- Figure 4: North America 3D Sensing Technology Revenue (billion), by Sensor Type 2025 & 2033
- Figure 5: North America 3D Sensing Technology Revenue Share (%), by Sensor Type 2025 & 2033
- Figure 6: North America 3D Sensing Technology Revenue (billion), by Connectivity 2025 & 2033
- Figure 7: North America 3D Sensing Technology Revenue Share (%), by Connectivity 2025 & 2033
- Figure 8: North America 3D Sensing Technology Revenue (billion), by Application 2025 & 2033
- Figure 9: North America 3D Sensing Technology Revenue Share (%), by Application 2025 & 2033
- Figure 10: North America 3D Sensing Technology Revenue (billion), by End User 2025 & 2033
- Figure 11: North America 3D Sensing Technology Revenue Share (%), by End User 2025 & 2033
- Figure 12: North America 3D Sensing Technology Revenue (billion), by Country 2025 & 2033
- Figure 13: North America 3D Sensing Technology Revenue Share (%), by Country 2025 & 2033
- Figure 14: South America 3D Sensing Technology Revenue (billion), by Technology 2025 & 2033
- Figure 15: South America 3D Sensing Technology Revenue Share (%), by Technology 2025 & 2033
- Figure 16: South America 3D Sensing Technology Revenue (billion), by Sensor Type 2025 & 2033
- Figure 17: South America 3D Sensing Technology Revenue Share (%), by Sensor Type 2025 & 2033
- Figure 18: South America 3D Sensing Technology Revenue (billion), by Connectivity 2025 & 2033
- Figure 19: South America 3D Sensing Technology Revenue Share (%), by Connectivity 2025 & 2033
- Figure 20: South America 3D Sensing Technology Revenue (billion), by Application 2025 & 2033
- Figure 21: South America 3D Sensing Technology Revenue Share (%), by Application 2025 & 2033
- Figure 22: South America 3D Sensing Technology Revenue (billion), by End User 2025 & 2033
- Figure 23: South America 3D Sensing Technology Revenue Share (%), by End User 2025 & 2033
- Figure 24: South America 3D Sensing Technology Revenue (billion), by Country 2025 & 2033
- Figure 25: South America 3D Sensing Technology Revenue Share (%), by Country 2025 & 2033
- Figure 26: Europe 3D Sensing Technology Revenue (billion), by Technology 2025 & 2033
- Figure 27: Europe 3D Sensing Technology Revenue Share (%), by Technology 2025 & 2033
- Figure 28: Europe 3D Sensing Technology Revenue (billion), by Sensor Type 2025 & 2033
- Figure 29: Europe 3D Sensing Technology Revenue Share (%), by Sensor Type 2025 & 2033
- Figure 30: Europe 3D Sensing Technology Revenue (billion), by Connectivity 2025 & 2033
- Figure 31: Europe 3D Sensing Technology Revenue Share (%), by Connectivity 2025 & 2033
- Figure 32: Europe 3D Sensing Technology Revenue (billion), by Application 2025 & 2033
- Figure 33: Europe 3D Sensing Technology Revenue Share (%), by Application 2025 & 2033
- Figure 34: Europe 3D Sensing Technology Revenue (billion), by End User 2025 & 2033
- Figure 35: Europe 3D Sensing Technology Revenue Share (%), by End User 2025 & 2033
- Figure 36: Europe 3D Sensing Technology Revenue (billion), by Country 2025 & 2033
- Figure 37: Europe 3D Sensing Technology Revenue Share (%), by Country 2025 & 2033
- Figure 38: Middle East & Africa 3D Sensing Technology Revenue (billion), by Technology 2025 & 2033
- Figure 39: Middle East & Africa 3D Sensing Technology Revenue Share (%), by Technology 2025 & 2033
- Figure 40: Middle East & Africa 3D Sensing Technology Revenue (billion), by Sensor Type 2025 & 2033
- Figure 41: Middle East & Africa 3D Sensing Technology Revenue Share (%), by Sensor Type 2025 & 2033
- Figure 42: Middle East & Africa 3D Sensing Technology Revenue (billion), by Connectivity 2025 & 2033
- Figure 43: Middle East & Africa 3D Sensing Technology Revenue Share (%), by Connectivity 2025 & 2033
- Figure 44: Middle East & Africa 3D Sensing Technology Revenue (billion), by Application 2025 & 2033
- Figure 45: Middle East & Africa 3D Sensing Technology Revenue Share (%), by Application 2025 & 2033
- Figure 46: Middle East & Africa 3D Sensing Technology Revenue (billion), by End User 2025 & 2033
- Figure 47: Middle East & Africa 3D Sensing Technology Revenue Share (%), by End User 2025 & 2033
- Figure 48: Middle East & Africa 3D Sensing Technology Revenue (billion), by Country 2025 & 2033
- Figure 49: Middle East & Africa 3D Sensing Technology Revenue Share (%), by Country 2025 & 2033
- Figure 50: Asia Pacific 3D Sensing Technology Revenue (billion), by Technology 2025 & 2033
- Figure 51: Asia Pacific 3D Sensing Technology Revenue Share (%), by Technology 2025 & 2033
- Figure 52: Asia Pacific 3D Sensing Technology Revenue (billion), by Sensor Type 2025 & 2033
- Figure 53: Asia Pacific 3D Sensing Technology Revenue Share (%), by Sensor Type 2025 & 2033
- Figure 54: Asia Pacific 3D Sensing Technology Revenue (billion), by Connectivity 2025 & 2033
- Figure 55: Asia Pacific 3D Sensing Technology Revenue Share (%), by Connectivity 2025 & 2033
- Figure 56: Asia Pacific 3D Sensing Technology Revenue (billion), by Application 2025 & 2033
- Figure 57: Asia Pacific 3D Sensing Technology Revenue Share (%), by Application 2025 & 2033
- Figure 58: Asia Pacific 3D Sensing Technology Revenue (billion), by End User 2025 & 2033
- Figure 59: Asia Pacific 3D Sensing Technology Revenue Share (%), by End User 2025 & 2033
- Figure 60: Asia Pacific 3D Sensing Technology Revenue (billion), by Country 2025 & 2033
- Figure 61: Asia Pacific 3D Sensing Technology Revenue Share (%), by Country 2025 & 2033
List of Tables
- Table 1: Global 3D Sensing Technology Revenue billion Forecast, by Technology 2020 & 2033
- Table 2: Global 3D Sensing Technology Revenue billion Forecast, by Sensor Type 2020 & 2033
- Table 3: Global 3D Sensing Technology Revenue billion Forecast, by Connectivity 2020 & 2033
- Table 4: Global 3D Sensing Technology Revenue billion Forecast, by Application 2020 & 2033
- Table 5: Global 3D Sensing Technology Revenue billion Forecast, by End User 2020 & 2033
- Table 6: Global 3D Sensing Technology Revenue billion Forecast, by Region 2020 & 2033
- Table 7: Global 3D Sensing Technology Revenue billion Forecast, by Technology 2020 & 2033
- Table 8: Global 3D Sensing Technology Revenue billion Forecast, by Sensor Type 2020 & 2033
- Table 9: Global 3D Sensing Technology Revenue billion Forecast, by Connectivity 2020 & 2033
- Table 10: Global 3D Sensing Technology Revenue billion Forecast, by Application 2020 & 2033
- Table 11: Global 3D Sensing Technology Revenue billion Forecast, by End User 2020 & 2033
- Table 12: Global 3D Sensing Technology Revenue billion Forecast, by Country 2020 & 2033
- Table 13: United States 3D Sensing Technology Revenue (billion) Forecast, by Application 2020 & 2033
- Table 14: Canada 3D Sensing Technology Revenue (billion) Forecast, by Application 2020 & 2033
- Table 15: Mexico 3D Sensing Technology Revenue (billion) Forecast, by Application 2020 & 2033
- Table 16: Global 3D Sensing Technology Revenue billion Forecast, by Technology 2020 & 2033
- Table 17: Global 3D Sensing Technology Revenue billion Forecast, by Sensor Type 2020 & 2033
- Table 18: Global 3D Sensing Technology Revenue billion Forecast, by Connectivity 2020 & 2033
- Table 19: Global 3D Sensing Technology Revenue billion Forecast, by Application 2020 & 2033
- Table 20: Global 3D Sensing Technology Revenue billion Forecast, by End User 2020 & 2033
- Table 21: Global 3D Sensing Technology Revenue billion Forecast, by Country 2020 & 2033
- Table 22: Brazil 3D Sensing Technology Revenue (billion) Forecast, by Application 2020 & 2033
- Table 23: Argentina 3D Sensing Technology Revenue (billion) Forecast, by Application 2020 & 2033
- Table 24: Rest of South America 3D Sensing Technology Revenue (billion) Forecast, by Application 2020 & 2033
- Table 25: Global 3D Sensing Technology Revenue billion Forecast, by Technology 2020 & 2033
- Table 26: Global 3D Sensing Technology Revenue billion Forecast, by Sensor Type 2020 & 2033
- Table 27: Global 3D Sensing Technology Revenue billion Forecast, by Connectivity 2020 & 2033
- Table 28: Global 3D Sensing Technology Revenue billion Forecast, by Application 2020 & 2033
- Table 29: Global 3D Sensing Technology Revenue billion Forecast, by End User 2020 & 2033
- Table 30: Global 3D Sensing Technology Revenue billion Forecast, by Country 2020 & 2033
- Table 31: United Kingdom 3D Sensing Technology Revenue (billion) Forecast, by Application 2020 & 2033
- Table 32: Germany 3D Sensing Technology Revenue (billion) Forecast, by Application 2020 & 2033
- Table 33: France 3D Sensing Technology Revenue (billion) Forecast, by Application 2020 & 2033
- Table 34: Italy 3D Sensing Technology Revenue (billion) Forecast, by Application 2020 & 2033
- Table 35: Spain 3D Sensing Technology Revenue (billion) Forecast, by Application 2020 & 2033
- Table 36: Russia 3D Sensing Technology Revenue (billion) Forecast, by Application 2020 & 2033
- Table 37: Benelux 3D Sensing Technology Revenue (billion) Forecast, by Application 2020 & 2033
- Table 38: Nordics 3D Sensing Technology Revenue (billion) Forecast, by Application 2020 & 2033
- Table 39: Rest of Europe 3D Sensing Technology Revenue (billion) Forecast, by Application 2020 & 2033
- Table 40: Global 3D Sensing Technology Revenue billion Forecast, by Technology 2020 & 2033
- Table 41: Global 3D Sensing Technology Revenue billion Forecast, by Sensor Type 2020 & 2033
- Table 42: Global 3D Sensing Technology Revenue billion Forecast, by Connectivity 2020 & 2033
- Table 43: Global 3D Sensing Technology Revenue billion Forecast, by Application 2020 & 2033
- Table 44: Global 3D Sensing Technology Revenue billion Forecast, by End User 2020 & 2033
- Table 45: Global 3D Sensing Technology Revenue billion Forecast, by Country 2020 & 2033
- Table 46: Turkey 3D Sensing Technology Revenue (billion) Forecast, by Application 2020 & 2033
- Table 47: Israel 3D Sensing Technology Revenue (billion) Forecast, by Application 2020 & 2033
- Table 48: GCC 3D Sensing Technology Revenue (billion) Forecast, by Application 2020 & 2033
- Table 49: North Africa 3D Sensing Technology Revenue (billion) Forecast, by Application 2020 & 2033
- Table 50: South Africa 3D Sensing Technology Revenue (billion) Forecast, by Application 2020 & 2033
- Table 51: Rest of Middle East & Africa 3D Sensing Technology Revenue (billion) Forecast, by Application 2020 & 2033
- Table 52: Global 3D Sensing Technology Revenue billion Forecast, by Technology 2020 & 2033
- Table 53: Global 3D Sensing Technology Revenue billion Forecast, by Sensor Type 2020 & 2033
- Table 54: Global 3D Sensing Technology Revenue billion Forecast, by Connectivity 2020 & 2033
- Table 55: Global 3D Sensing Technology Revenue billion Forecast, by Application 2020 & 2033
- Table 56: Global 3D Sensing Technology Revenue billion Forecast, by End User 2020 & 2033
- Table 57: Global 3D Sensing Technology Revenue billion Forecast, by Country 2020 & 2033
- Table 58: China 3D Sensing Technology Revenue (billion) Forecast, by Application 2020 & 2033
- Table 59: India 3D Sensing Technology Revenue (billion) Forecast, by Application 2020 & 2033
- Table 60: Japan 3D Sensing Technology Revenue (billion) Forecast, by Application 2020 & 2033
- Table 61: South Korea 3D Sensing Technology Revenue (billion) Forecast, by Application 2020 & 2033
- Table 62: ASEAN 3D Sensing Technology Revenue (billion) Forecast, by Application 2020 & 2033
- Table 63: Oceania 3D Sensing Technology Revenue (billion) Forecast, by Application 2020 & 2033
- Table 64: Rest of Asia Pacific 3D Sensing Technology Revenue (billion) Forecast, by Application 2020 & 2033
Frequently Asked Questions
1. What is the projected Compound Annual Growth Rate (CAGR) of the 3D Sensing Technology?
The projected CAGR is approximately 24.2%.
2. Which companies are prominent players in the 3D Sensing Technology?
Key companies in the market include Sony Group Corporation, Apple Inc., Intel Corporation, Infineon Technologies AG, STMicroelectronics, Texas Instruments Incorporated, Microsoft Corporation, OmniVision Technologies, Inc., Lumentum Holdings Inc., Basler AG, Cognex Corporation, Teledyne Technologies Incorporated, Others.
3. What are the main segments of the 3D Sensing Technology?
The market segments include Technology, Sensor Type, Connectivity, Application, End User.
4. Can you provide details about the market size?
The market size is estimated to be USD 25.3 billion as of 2022.
5. What are some drivers contributing to market growth?
N/A
6. What are the notable trends driving market growth?
N/A
7. Are there any restraints impacting market growth?
N/A
8. Can you provide examples of recent developments in the market?
N/A
9. What pricing options are available for accessing the report?
Pricing options include single-user, multi-user, and enterprise licenses priced at USD 4900.00, USD 7350.00, and USD 9800.00 respectively.
10. Is the market size provided in terms of value or volume?
The market size is provided in terms of value, measured in billion.
11. Are there any specific market keywords associated with the report?
Yes, the market keyword associated with the report is "3D Sensing Technology," which aids in identifying and referencing the specific market segment covered.
12. How do I determine which pricing option suits my needs best?
The pricing options vary based on user requirements and access needs. Individual users may opt for single-user licenses, while businesses requiring broader access may choose multi-user or enterprise licenses for cost-effective access to the report.
13. Are there any additional resources or data provided in the 3D Sensing Technology report?
While the report offers comprehensive insights, it's advisable to review the specific contents or supplementary materials provided to ascertain if additional resources or data are available.
14. How can I stay updated on further developments or reports in the 3D Sensing Technology?
To stay informed about further developments, trends, and reports in the 3D Sensing Technology, consider subscribing to industry newsletters, following relevant companies and organizations, or regularly checking reputable industry news sources and publications.
Methodology
Step 1 - Identification of Relevant Samples Size from Population Database


Step 2 - Approaches for Defining Global Market Size (Value, Volume* & Price*)

Note*: In applicable scenarios
Step 3 - Data Sources
Primary Research
- Web Analytics
- Survey Reports
- Research Institute
- Latest Research Reports
- Opinion Leaders
Secondary Research
- Annual Reports
- White Paper
- Latest Press Release
- Industry Association
- Paid Database
- Investor Presentations

Step 4 - Data Triangulation
Involves using different sources of information in order to increase the validity of a study
These sources are likely to be stakeholders in a program - participants, other researchers, program staff, other community members, and so on.
Then we put all data in single framework & apply various statistical tools to find out the dynamic on the market.
During the analysis stage, feedback from the stakeholder groups would be compared to determine areas of agreement as well as areas of divergence