

Key Insights
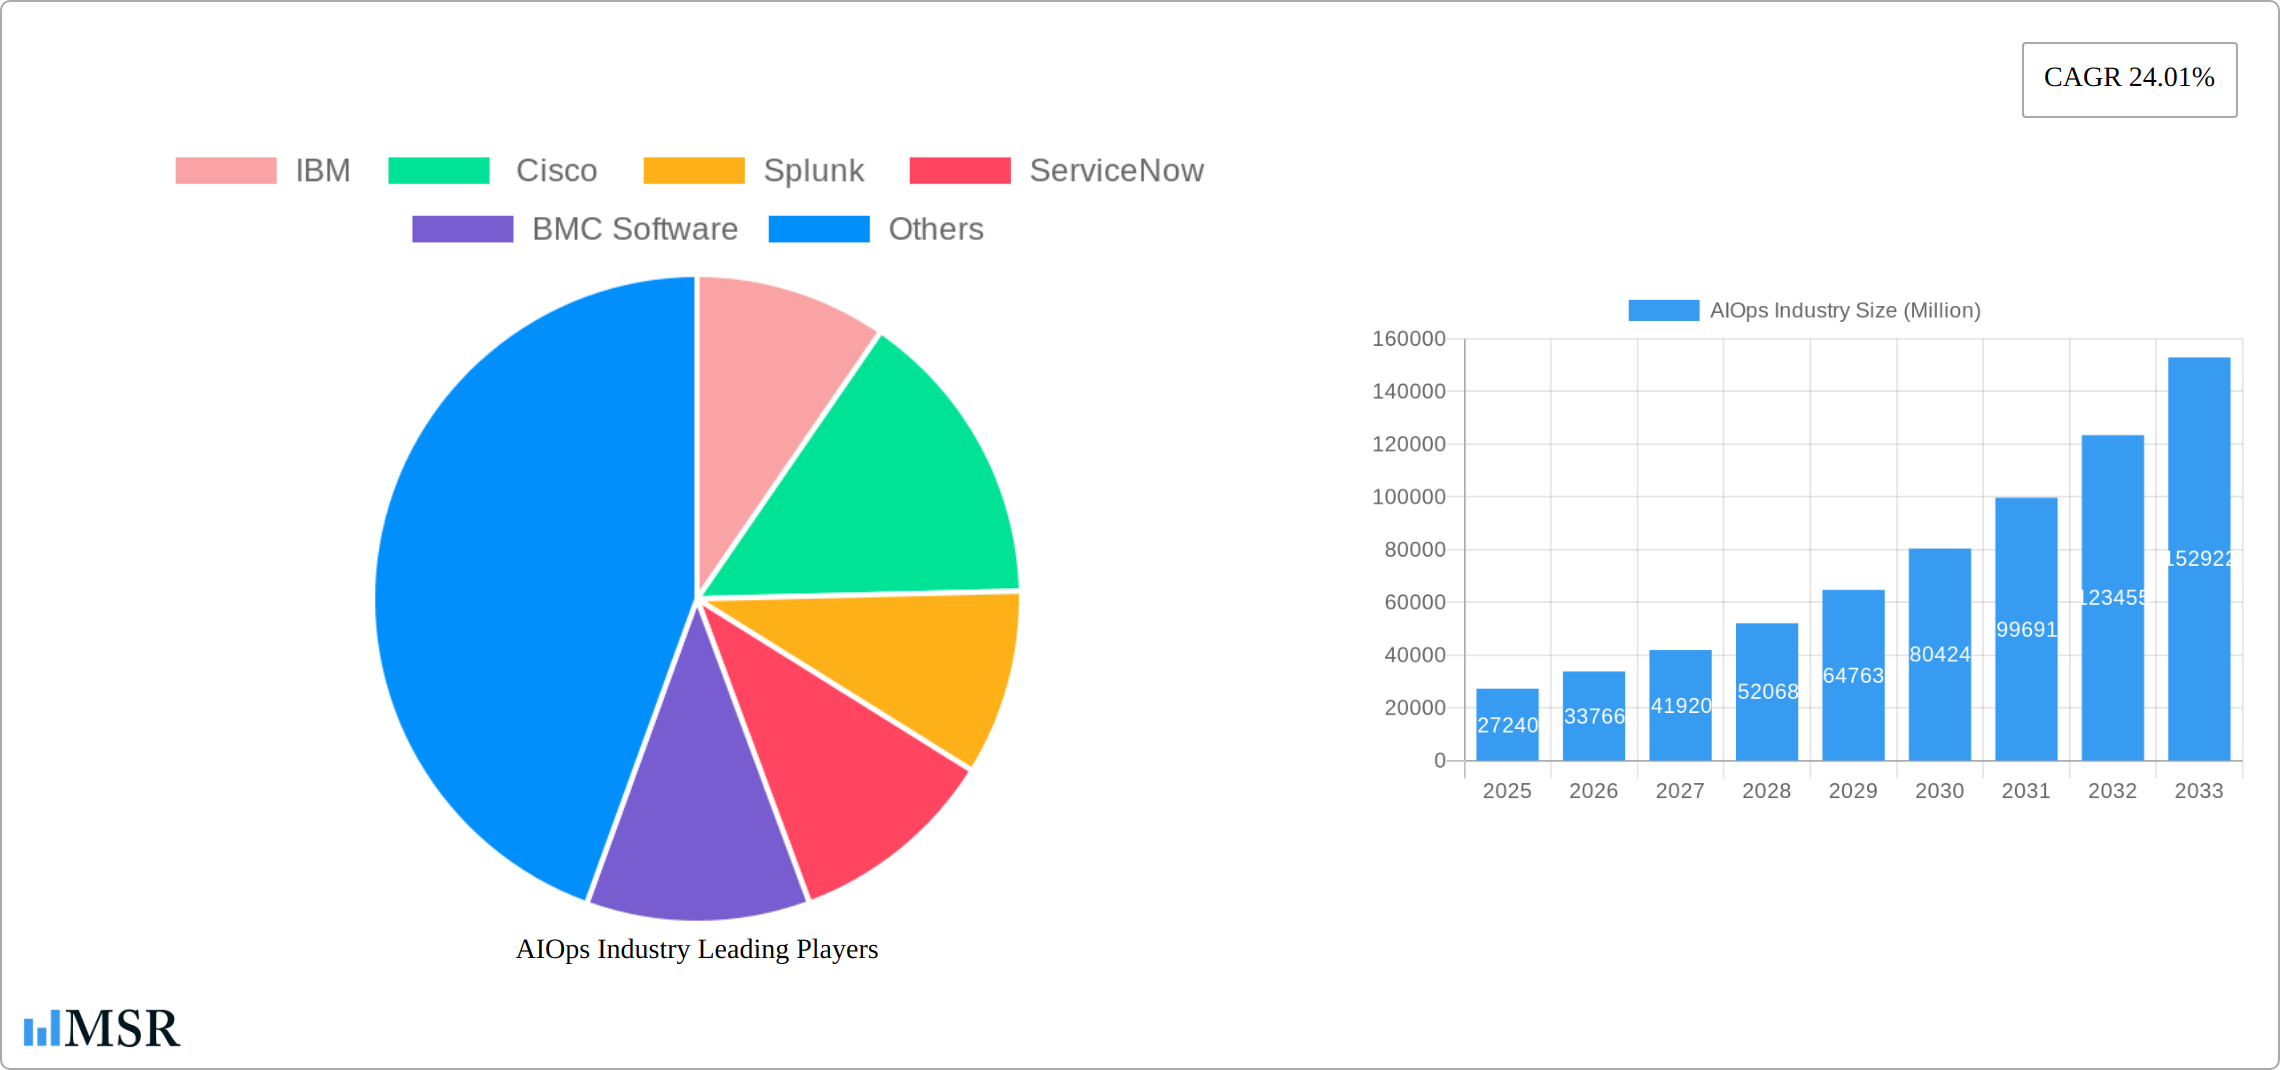
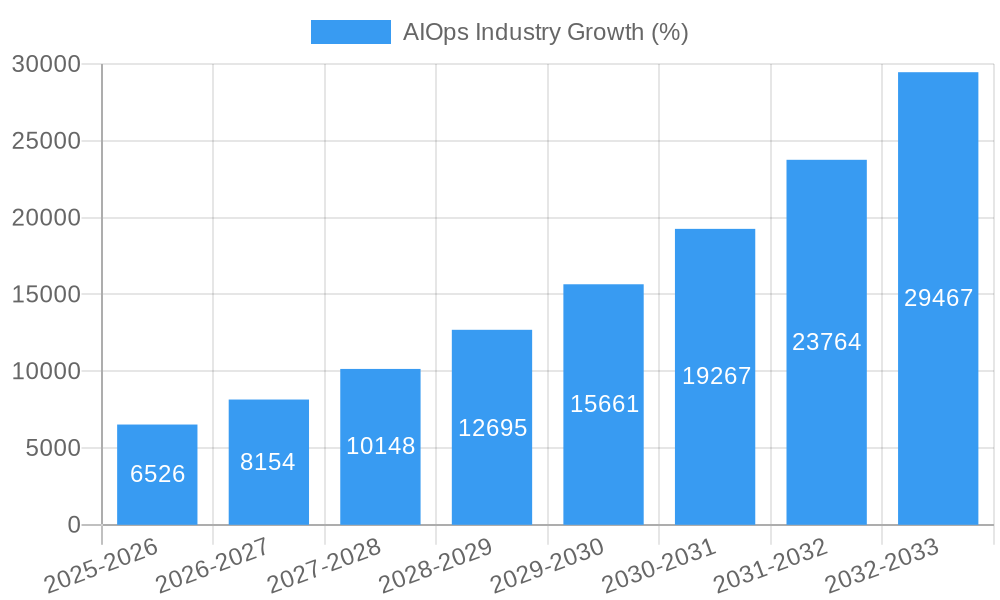
The AIOps market is experiencing robust growth, projected to reach $27.24 billion in 2025 and exhibiting a remarkable Compound Annual Growth Rate (CAGR) of 24.01%. This expansion is fueled by several key drivers. The increasing complexity of IT infrastructure, coupled with the explosion of data generated by digital transformation initiatives, necessitates sophisticated solutions for proactive monitoring, anomaly detection, and automated remediation. Businesses across all sectors are embracing AIOps to enhance operational efficiency, reduce downtime, and improve overall IT performance. The shift towards cloud-based deployments and the rising adoption of SaaS models are further contributing to market growth. Specific industries such as BFSI (Banking, Financial Services, and Insurance), IT and Telecom, and Media and Entertainment are early adopters, leveraging AIOps to improve customer experience, manage risk, and gain a competitive edge. Large enterprises are leading the adoption, driven by the need to manage extensive and complex IT environments. However, the market faces certain challenges, including the need for skilled professionals to implement and manage AIOps solutions, concerns about data security and privacy, and the initial high cost of implementation. Despite these restraints, the long-term outlook for the AIOps market remains exceptionally positive, driven by ongoing technological advancements and the increasing reliance on AI and machine learning for IT management.
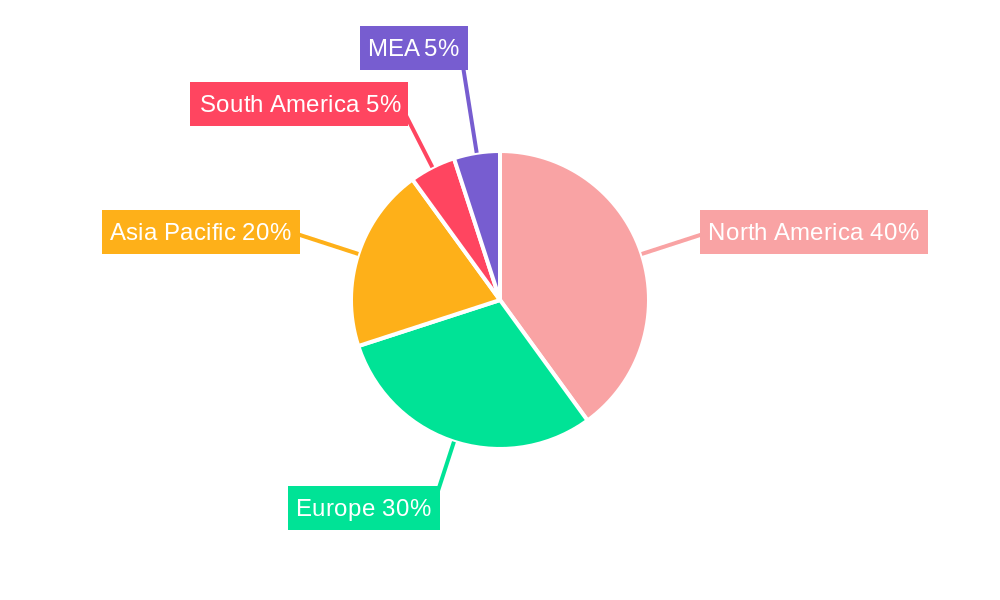
The geographical distribution of the AIOps market reflects global digital transformation trends. North America currently holds a significant market share due to early adoption and the presence of major technology players. However, regions like Asia-Pacific are witnessing rapid growth fueled by increasing IT infrastructure investments and digital initiatives in countries such as India, China, and Japan. Europe also demonstrates steady growth driven by a strong focus on digitalization across various sectors. While North America maintains a leading position, the growth trajectory in other regions indicates a shift towards a more balanced global market distribution in the coming years. Competitive landscape analysis reveals key players such as IBM, Cisco, Splunk, ServiceNow, and BMC Software actively shaping the market through innovative solutions and strategic partnerships. The market is witnessing increased competition with new entrants constantly emerging, fostering innovation and driving down prices, making AIOps accessible to a wider range of organizations.
AIOps Industry Market Report: 2019-2033 Forecast
This comprehensive report provides a detailed analysis of the AIOps (Artificial Intelligence for IT Operations) industry, encompassing market size, growth drivers, key players, and future trends. The study period covers 2019-2033, with a focus on the estimated year 2025. This report is essential for businesses, investors, and stakeholders seeking to understand and capitalize on the rapidly evolving AIOps landscape. The global AIOps market is projected to reach $xx Million by 2033, exhibiting a CAGR of xx% during the forecast period (2025-2033).
AIOps Industry Market Concentration & Dynamics
The AIOps market exhibits a moderately concentrated landscape, with several major players holding significant market share. IBM, Cisco, Splunk, ServiceNow, and BMC Software are prominent examples, collectively accounting for an estimated xx% of the market in 2025. However, a vibrant ecosystem of smaller players and startups is driving innovation and competition.
The market is shaped by several key dynamics:
- Innovation Ecosystems: Continuous advancements in AI, machine learning, and big data analytics are fueling the development of sophisticated AIOps solutions. Open-source initiatives and partnerships further accelerate innovation.
- Regulatory Frameworks: Data privacy regulations (e.g., GDPR, CCPA) influence AIOps adoption, requiring robust data security and compliance measures.
- Substitute Products: Traditional IT management tools still hold a presence, but their functionalities are increasingly being integrated with or replaced by AIOps solutions.
- End-User Trends: The growing demand for automation, improved IT efficiency, and proactive problem resolution across various industries fuels AIOps adoption.
- M&A Activities: The number of M&A deals in the AIOps space has been steadily increasing, with xx deals recorded in 2024, indicating a strategic consolidation trend within the market.
AIOps Industry Insights & Trends
The AIOps market is experiencing robust growth, driven by several factors:
- Increased IT Complexity: The exponential growth of data and applications necessitates intelligent automation to manage IT infrastructure effectively.
- Digital Transformation Initiatives: Organizations are increasingly adopting cloud-based services and digital technologies, driving demand for AIOps solutions to manage these complex environments.
- Demand for Proactive IT Management: AIOps enables proactive identification and resolution of IT issues, reducing downtime and improving operational efficiency.
- Rise of Big Data and Analytics: The availability of vast amounts of IT data provides valuable insights for enhancing operational efficiency and decision-making.
The market size is expected to reach $xx Million in 2025 and grow to $xx Million by 2033, driven by increased adoption across various industries. This growth is further accelerated by technological disruptions like the rise of edge computing and serverless architectures, which present both challenges and opportunities for AIOps providers. The evolving consumer behaviors focus on seamless integration, ease of use, and real-time insights, pushing vendors to innovate and enhance their offerings.
Key Markets & Segments Leading AIOps Industry
The global AIOps market is experiencing widespread adoption across various segments, yet certain regions and industry verticals are exhibiting particularly strong growth.
Dominant Region: North America currently holds the largest market share due to early adoption, technological advancements, and a robust IT infrastructure. However, Asia-Pacific is projected to witness the fastest growth rate in the coming years due to rapid digital transformation and increasing IT spending.
Dominant Deployment Model: The Cloud/SaaS deployment model is gaining significant traction due to its scalability, cost-effectiveness, and ease of deployment, surpassing On-Premise deployment in market share in 2025.
Leading End-User Industries: The IT and Telecom sector currently leads AIOps adoption due to its inherent need for robust IT management. However, the BFSI (Banking, Financial Services, and Insurance), Healthcare, and Retail sectors are also witnessing rapid growth as they increasingly rely on digital channels and complex IT infrastructure.
Drivers for each segment:
- IT & Telecom: High IT complexity, need for 24/7 uptime, and increasing reliance on digital services.
- BFSI: Stringent regulatory compliance needs, growing cybersecurity threats, and demand for improved customer service.
- Retail: The need for omnichannel support, personalization, and effective supply chain management.
- Healthcare: Increased focus on data security and privacy, improvement in patient care, and operational efficiency.
- Large Enterprises: Higher IT budgets, complex IT environments, and a need for centralized IT management.
The Small and Medium Enterprises (SME) segment is also showing increasing adoption, driven by affordable SaaS solutions and the ease of implementation.
AIOps Industry Product Developments
Recent years have witnessed significant product innovation in the AIOps space. Vendors are enhancing their platforms with advanced capabilities like AI-driven anomaly detection, predictive analytics, automated remediation, and improved integration with existing IT management tools. This leads to increased automation, improved efficiency, and better operational insights, giving them a competitive edge in the market.
Challenges in the AIOps Industry Market
The AIOps market faces several challenges, including:
- Data Integration Complexity: Integrating data from diverse IT systems can be complex and time-consuming, hindering effective AIOps deployment.
- Skill Gaps: A shortage of skilled professionals with expertise in AI, machine learning, and data analytics can limit the successful implementation of AIOps solutions.
- High Initial Investment Costs: Implementing AIOps solutions often requires significant upfront investment, potentially posing a barrier for smaller organizations. This leads to a xx% reduction in adoption rates amongst SMEs.
Forces Driving AIOps Industry Growth
Several factors are fueling the growth of the AIOps market:
- Technological Advancements: Continued advancements in AI, machine learning, and big data analytics provide enhanced capabilities for AIOps platforms.
- Growing Data Volumes: The exponential growth of data from diverse IT sources creates a critical need for intelligent automation.
- Increased Focus on Digital Transformation: Organizations are increasingly embracing digital transformation initiatives, creating a strong demand for AIOps solutions to manage the complex IT landscape.
Long-Term Growth Catalysts in the AIOps Industry
Long-term growth will be driven by strategic partnerships between AIOps vendors and other technology providers, fostering innovation and expanding market reach. Furthermore, the expansion of AIOps capabilities into new areas like network management, security operations, and DevOps will create significant opportunities for growth. Developments in cloud-native AIOps and edge computing will further enhance market potential.
Emerging Opportunities in AIOps Industry
Emerging opportunities include expanding into new verticals like the manufacturing and energy sectors, leveraging serverless architectures for more efficient AIOps solutions, and integrating AIOps with other emerging technologies such as the metaverse and Web3 for enhanced capabilities. Focus on integrating AIOps into security operations centers (SOCs) is also creating a significant opportunity.
Leading Players in the AIOps Industry Sector
Key Milestones in AIOps Industry
- October 2022: IBM announced version 3.5 of IBM Cloud Pak for Watson AIOps, enhancing business context data visualization and prioritization of IT issues.
- September 2022: Fortinet launched AI-based network services management for 5G/LTE gateways, improving AIOps capabilities across its networking portfolio.
- March 2022: Deloitte launched AIOPS.D, an AI-powered modular services platform for autonomous business process management.
Strategic Outlook for AIOps Industry Market
The AIOps market holds immense future potential, driven by the continued growth of data, increasing adoption of cloud-based services, and the ongoing need for enhanced IT efficiency and automation. Strategic opportunities lie in developing specialized AIOps solutions for specific industry verticals, fostering partnerships to expand market reach, and investing in research and development to create innovative solutions that address the evolving needs of businesses.
AIOps Industry Segmentation
-
1. Organization Type
- 1.1. Small and Medium Enterprises
- 1.2. Large Enterprise
-
2. Deployment
- 2.1. On-Premise
- 2.2. Cloud/SaaS
-
3. End-User Industry
- 3.1. Media and Entertainment
- 3.2. IT and Telecom
- 3.3. Retail
- 3.4. Healthcare
- 3.5. BFSI
- 3.6. Other End-User Industries
AIOps Industry Segmentation By Geography
- 1. North America
- 2. Europe
- 3. Asia Pacific
- 4. Latin America
- 5. Middle East and Africa
AIOps Industry REPORT HIGHLIGHTS
| Aspects | Details |
|---|---|
| Study Period | 2019-2033 |
| Base Year | 2024 |
| Estimated Year | 2025 |
| Forecast Period | 2025-2033 |
| Historical Period | 2019-2024 |
| Growth Rate | CAGR of 24.01% from 2019-2033 |
| Segmentation |
|
Table of Contents
- 1. Introduction
- 1.1. Research Scope
- 1.2. Market Segmentation
- 1.3. Research Methodology
- 1.4. Definitions and Assumptions
- 2. Executive Summary
- 2.1. Introduction
- 3. Market Dynamics
- 3.1. Introduction
- 3.2. Market Drivers
- 3.2.1. Growing demand for AI-based services in IT operations; Increasing end-to-end business application assurance and uptime
- 3.3. Market Restrains
- 3.3.1. Increasing number of changes in IT operations
- 3.4. Market Trends
- 3.4.1. BFSI is Expected to Hold Significant Share
- 4. Market Factor Analysis
- 4.1. Porters Five Forces
- 4.2. Supply/Value Chain
- 4.3. PESTEL analysis
- 4.4. Market Entropy
- 4.5. Patent/Trademark Analysis
- 5. Global AIOps Industry Analysis, Insights and Forecast, 2019-2031
- 5.1. Market Analysis, Insights and Forecast - by Organization Type
- 5.1.1. Small and Medium Enterprises
- 5.1.2. Large Enterprise
- 5.2. Market Analysis, Insights and Forecast - by Deployment
- 5.2.1. On-Premise
- 5.2.2. Cloud/SaaS
- 5.3. Market Analysis, Insights and Forecast - by End-User Industry
- 5.3.1. Media and Entertainment
- 5.3.2. IT and Telecom
- 5.3.3. Retail
- 5.3.4. Healthcare
- 5.3.5. BFSI
- 5.3.6. Other End-User Industries
- 5.4. Market Analysis, Insights and Forecast - by Region
- 5.4.1. North America
- 5.4.2. Europe
- 5.4.3. Asia Pacific
- 5.4.4. Latin America
- 5.4.5. Middle East and Africa
- 5.1. Market Analysis, Insights and Forecast - by Organization Type
- 6. North America AIOps Industry Analysis, Insights and Forecast, 2019-2031
- 6.1. Market Analysis, Insights and Forecast - by Organization Type
- 6.1.1. Small and Medium Enterprises
- 6.1.2. Large Enterprise
- 6.2. Market Analysis, Insights and Forecast - by Deployment
- 6.2.1. On-Premise
- 6.2.2. Cloud/SaaS
- 6.3. Market Analysis, Insights and Forecast - by End-User Industry
- 6.3.1. Media and Entertainment
- 6.3.2. IT and Telecom
- 6.3.3. Retail
- 6.3.4. Healthcare
- 6.3.5. BFSI
- 6.3.6. Other End-User Industries
- 6.1. Market Analysis, Insights and Forecast - by Organization Type
- 7. Europe AIOps Industry Analysis, Insights and Forecast, 2019-2031
- 7.1. Market Analysis, Insights and Forecast - by Organization Type
- 7.1.1. Small and Medium Enterprises
- 7.1.2. Large Enterprise
- 7.2. Market Analysis, Insights and Forecast - by Deployment
- 7.2.1. On-Premise
- 7.2.2. Cloud/SaaS
- 7.3. Market Analysis, Insights and Forecast - by End-User Industry
- 7.3.1. Media and Entertainment
- 7.3.2. IT and Telecom
- 7.3.3. Retail
- 7.3.4. Healthcare
- 7.3.5. BFSI
- 7.3.6. Other End-User Industries
- 7.1. Market Analysis, Insights and Forecast - by Organization Type
- 8. Asia Pacific AIOps Industry Analysis, Insights and Forecast, 2019-2031
- 8.1. Market Analysis, Insights and Forecast - by Organization Type
- 8.1.1. Small and Medium Enterprises
- 8.1.2. Large Enterprise
- 8.2. Market Analysis, Insights and Forecast - by Deployment
- 8.2.1. On-Premise
- 8.2.2. Cloud/SaaS
- 8.3. Market Analysis, Insights and Forecast - by End-User Industry
- 8.3.1. Media and Entertainment
- 8.3.2. IT and Telecom
- 8.3.3. Retail
- 8.3.4. Healthcare
- 8.3.5. BFSI
- 8.3.6. Other End-User Industries
- 8.1. Market Analysis, Insights and Forecast - by Organization Type
- 9. Latin America AIOps Industry Analysis, Insights and Forecast, 2019-2031
- 9.1. Market Analysis, Insights and Forecast - by Organization Type
- 9.1.1. Small and Medium Enterprises
- 9.1.2. Large Enterprise
- 9.2. Market Analysis, Insights and Forecast - by Deployment
- 9.2.1. On-Premise
- 9.2.2. Cloud/SaaS
- 9.3. Market Analysis, Insights and Forecast - by End-User Industry
- 9.3.1. Media and Entertainment
- 9.3.2. IT and Telecom
- 9.3.3. Retail
- 9.3.4. Healthcare
- 9.3.5. BFSI
- 9.3.6. Other End-User Industries
- 9.1. Market Analysis, Insights and Forecast - by Organization Type
- 10. Middle East and Africa AIOps Industry Analysis, Insights and Forecast, 2019-2031
- 10.1. Market Analysis, Insights and Forecast - by Organization Type
- 10.1.1. Small and Medium Enterprises
- 10.1.2. Large Enterprise
- 10.2. Market Analysis, Insights and Forecast - by Deployment
- 10.2.1. On-Premise
- 10.2.2. Cloud/SaaS
- 10.3. Market Analysis, Insights and Forecast - by End-User Industry
- 10.3.1. Media and Entertainment
- 10.3.2. IT and Telecom
- 10.3.3. Retail
- 10.3.4. Healthcare
- 10.3.5. BFSI
- 10.3.6. Other End-User Industries
- 10.1. Market Analysis, Insights and Forecast - by Organization Type
- 11. North America AIOps Industry Analysis, Insights and Forecast, 2019-2031
- 11.1. Market Analysis, Insights and Forecast - By Country/Sub-region
- 11.1.1 United States
- 11.1.2 Canada
- 11.1.3 Mexico
- 12. Europe AIOps Industry Analysis, Insights and Forecast, 2019-2031
- 12.1. Market Analysis, Insights and Forecast - By Country/Sub-region
- 12.1.1 Germany
- 12.1.2 United Kingdom
- 12.1.3 France
- 12.1.4 Spain
- 12.1.5 Italy
- 12.1.6 Spain
- 12.1.7 Belgium
- 12.1.8 Netherland
- 12.1.9 Nordics
- 12.1.10 Rest of Europe
- 13. Asia Pacific AIOps Industry Analysis, Insights and Forecast, 2019-2031
- 13.1. Market Analysis, Insights and Forecast - By Country/Sub-region
- 13.1.1 China
- 13.1.2 Japan
- 13.1.3 India
- 13.1.4 South Korea
- 13.1.5 Southeast Asia
- 13.1.6 Australia
- 13.1.7 Indonesia
- 13.1.8 Phillipes
- 13.1.9 Singapore
- 13.1.10 Thailandc
- 13.1.11 Rest of Asia Pacific
- 14. South America AIOps Industry Analysis, Insights and Forecast, 2019-2031
- 14.1. Market Analysis, Insights and Forecast - By Country/Sub-region
- 14.1.1 Brazil
- 14.1.2 Argentina
- 14.1.3 Peru
- 14.1.4 Chile
- 14.1.5 Colombia
- 14.1.6 Ecuador
- 14.1.7 Venezuela
- 14.1.8 Rest of South America
- 15. MEA AIOps Industry Analysis, Insights and Forecast, 2019-2031
- 15.1. Market Analysis, Insights and Forecast - By Country/Sub-region
- 15.1.1 United Arab Emirates
- 15.1.2 Saudi Arabia
- 15.1.3 South Africa
- 15.1.4 Rest of Middle East and Africa
- 16. Competitive Analysis
- 16.1. Global Market Share Analysis 2024
- 16.2. Company Profiles
- 16.2.1 IBM
- 16.2.1.1. Overview
- 16.2.1.2. Products
- 16.2.1.3. SWOT Analysis
- 16.2.1.4. Recent Developments
- 16.2.1.5. Financials (Based on Availability)
- 16.2.2 Cisco
- 16.2.2.1. Overview
- 16.2.2.2. Products
- 16.2.2.3. SWOT Analysis
- 16.2.2.4. Recent Developments
- 16.2.2.5. Financials (Based on Availability)
- 16.2.3 Splunk
- 16.2.3.1. Overview
- 16.2.3.2. Products
- 16.2.3.3. SWOT Analysis
- 16.2.3.4. Recent Developments
- 16.2.3.5. Financials (Based on Availability)
- 16.2.4 ServiceNow
- 16.2.4.1. Overview
- 16.2.4.2. Products
- 16.2.4.3. SWOT Analysis
- 16.2.4.4. Recent Developments
- 16.2.4.5. Financials (Based on Availability)
- 16.2.5 BMC Software
- 16.2.5.1. Overview
- 16.2.5.2. Products
- 16.2.5.3. SWOT Analysis
- 16.2.5.4. Recent Developments
- 16.2.5.5. Financials (Based on Availability)
- 16.2.1 IBM
List of Figures
- Figure 1: Global AIOps Industry Revenue Breakdown (Million, %) by Region 2024 & 2032
- Figure 2: North America AIOps Industry Revenue (Million), by Country 2024 & 2032
- Figure 3: North America AIOps Industry Revenue Share (%), by Country 2024 & 2032
- Figure 4: Europe AIOps Industry Revenue (Million), by Country 2024 & 2032
- Figure 5: Europe AIOps Industry Revenue Share (%), by Country 2024 & 2032
- Figure 6: Asia Pacific AIOps Industry Revenue (Million), by Country 2024 & 2032
- Figure 7: Asia Pacific AIOps Industry Revenue Share (%), by Country 2024 & 2032
- Figure 8: South America AIOps Industry Revenue (Million), by Country 2024 & 2032
- Figure 9: South America AIOps Industry Revenue Share (%), by Country 2024 & 2032
- Figure 10: MEA AIOps Industry Revenue (Million), by Country 2024 & 2032
- Figure 11: MEA AIOps Industry Revenue Share (%), by Country 2024 & 2032
- Figure 12: North America AIOps Industry Revenue (Million), by Organization Type 2024 & 2032
- Figure 13: North America AIOps Industry Revenue Share (%), by Organization Type 2024 & 2032
- Figure 14: North America AIOps Industry Revenue (Million), by Deployment 2024 & 2032
- Figure 15: North America AIOps Industry Revenue Share (%), by Deployment 2024 & 2032
- Figure 16: North America AIOps Industry Revenue (Million), by End-User Industry 2024 & 2032
- Figure 17: North America AIOps Industry Revenue Share (%), by End-User Industry 2024 & 2032
- Figure 18: North America AIOps Industry Revenue (Million), by Country 2024 & 2032
- Figure 19: North America AIOps Industry Revenue Share (%), by Country 2024 & 2032
- Figure 20: Europe AIOps Industry Revenue (Million), by Organization Type 2024 & 2032
- Figure 21: Europe AIOps Industry Revenue Share (%), by Organization Type 2024 & 2032
- Figure 22: Europe AIOps Industry Revenue (Million), by Deployment 2024 & 2032
- Figure 23: Europe AIOps Industry Revenue Share (%), by Deployment 2024 & 2032
- Figure 24: Europe AIOps Industry Revenue (Million), by End-User Industry 2024 & 2032
- Figure 25: Europe AIOps Industry Revenue Share (%), by End-User Industry 2024 & 2032
- Figure 26: Europe AIOps Industry Revenue (Million), by Country 2024 & 2032
- Figure 27: Europe AIOps Industry Revenue Share (%), by Country 2024 & 2032
- Figure 28: Asia Pacific AIOps Industry Revenue (Million), by Organization Type 2024 & 2032
- Figure 29: Asia Pacific AIOps Industry Revenue Share (%), by Organization Type 2024 & 2032
- Figure 30: Asia Pacific AIOps Industry Revenue (Million), by Deployment 2024 & 2032
- Figure 31: Asia Pacific AIOps Industry Revenue Share (%), by Deployment 2024 & 2032
- Figure 32: Asia Pacific AIOps Industry Revenue (Million), by End-User Industry 2024 & 2032
- Figure 33: Asia Pacific AIOps Industry Revenue Share (%), by End-User Industry 2024 & 2032
- Figure 34: Asia Pacific AIOps Industry Revenue (Million), by Country 2024 & 2032
- Figure 35: Asia Pacific AIOps Industry Revenue Share (%), by Country 2024 & 2032
- Figure 36: Latin America AIOps Industry Revenue (Million), by Organization Type 2024 & 2032
- Figure 37: Latin America AIOps Industry Revenue Share (%), by Organization Type 2024 & 2032
- Figure 38: Latin America AIOps Industry Revenue (Million), by Deployment 2024 & 2032
- Figure 39: Latin America AIOps Industry Revenue Share (%), by Deployment 2024 & 2032
- Figure 40: Latin America AIOps Industry Revenue (Million), by End-User Industry 2024 & 2032
- Figure 41: Latin America AIOps Industry Revenue Share (%), by End-User Industry 2024 & 2032
- Figure 42: Latin America AIOps Industry Revenue (Million), by Country 2024 & 2032
- Figure 43: Latin America AIOps Industry Revenue Share (%), by Country 2024 & 2032
- Figure 44: Middle East and Africa AIOps Industry Revenue (Million), by Organization Type 2024 & 2032
- Figure 45: Middle East and Africa AIOps Industry Revenue Share (%), by Organization Type 2024 & 2032
- Figure 46: Middle East and Africa AIOps Industry Revenue (Million), by Deployment 2024 & 2032
- Figure 47: Middle East and Africa AIOps Industry Revenue Share (%), by Deployment 2024 & 2032
- Figure 48: Middle East and Africa AIOps Industry Revenue (Million), by End-User Industry 2024 & 2032
- Figure 49: Middle East and Africa AIOps Industry Revenue Share (%), by End-User Industry 2024 & 2032
- Figure 50: Middle East and Africa AIOps Industry Revenue (Million), by Country 2024 & 2032
- Figure 51: Middle East and Africa AIOps Industry Revenue Share (%), by Country 2024 & 2032
List of Tables
- Table 1: Global AIOps Industry Revenue Million Forecast, by Region 2019 & 2032
- Table 2: Global AIOps Industry Revenue Million Forecast, by Organization Type 2019 & 2032
- Table 3: Global AIOps Industry Revenue Million Forecast, by Deployment 2019 & 2032
- Table 4: Global AIOps Industry Revenue Million Forecast, by End-User Industry 2019 & 2032
- Table 5: Global AIOps Industry Revenue Million Forecast, by Region 2019 & 2032
- Table 6: Global AIOps Industry Revenue Million Forecast, by Country 2019 & 2032
- Table 7: United States AIOps Industry Revenue (Million) Forecast, by Application 2019 & 2032
- Table 8: Canada AIOps Industry Revenue (Million) Forecast, by Application 2019 & 2032
- Table 9: Mexico AIOps Industry Revenue (Million) Forecast, by Application 2019 & 2032
- Table 10: Global AIOps Industry Revenue Million Forecast, by Country 2019 & 2032
- Table 11: Germany AIOps Industry Revenue (Million) Forecast, by Application 2019 & 2032
- Table 12: United Kingdom AIOps Industry Revenue (Million) Forecast, by Application 2019 & 2032
- Table 13: France AIOps Industry Revenue (Million) Forecast, by Application 2019 & 2032
- Table 14: Spain AIOps Industry Revenue (Million) Forecast, by Application 2019 & 2032
- Table 15: Italy AIOps Industry Revenue (Million) Forecast, by Application 2019 & 2032
- Table 16: Spain AIOps Industry Revenue (Million) Forecast, by Application 2019 & 2032
- Table 17: Belgium AIOps Industry Revenue (Million) Forecast, by Application 2019 & 2032
- Table 18: Netherland AIOps Industry Revenue (Million) Forecast, by Application 2019 & 2032
- Table 19: Nordics AIOps Industry Revenue (Million) Forecast, by Application 2019 & 2032
- Table 20: Rest of Europe AIOps Industry Revenue (Million) Forecast, by Application 2019 & 2032
- Table 21: Global AIOps Industry Revenue Million Forecast, by Country 2019 & 2032
- Table 22: China AIOps Industry Revenue (Million) Forecast, by Application 2019 & 2032
- Table 23: Japan AIOps Industry Revenue (Million) Forecast, by Application 2019 & 2032
- Table 24: India AIOps Industry Revenue (Million) Forecast, by Application 2019 & 2032
- Table 25: South Korea AIOps Industry Revenue (Million) Forecast, by Application 2019 & 2032
- Table 26: Southeast Asia AIOps Industry Revenue (Million) Forecast, by Application 2019 & 2032
- Table 27: Australia AIOps Industry Revenue (Million) Forecast, by Application 2019 & 2032
- Table 28: Indonesia AIOps Industry Revenue (Million) Forecast, by Application 2019 & 2032
- Table 29: Phillipes AIOps Industry Revenue (Million) Forecast, by Application 2019 & 2032
- Table 30: Singapore AIOps Industry Revenue (Million) Forecast, by Application 2019 & 2032
- Table 31: Thailandc AIOps Industry Revenue (Million) Forecast, by Application 2019 & 2032
- Table 32: Rest of Asia Pacific AIOps Industry Revenue (Million) Forecast, by Application 2019 & 2032
- Table 33: Global AIOps Industry Revenue Million Forecast, by Country 2019 & 2032
- Table 34: Brazil AIOps Industry Revenue (Million) Forecast, by Application 2019 & 2032
- Table 35: Argentina AIOps Industry Revenue (Million) Forecast, by Application 2019 & 2032
- Table 36: Peru AIOps Industry Revenue (Million) Forecast, by Application 2019 & 2032
- Table 37: Chile AIOps Industry Revenue (Million) Forecast, by Application 2019 & 2032
- Table 38: Colombia AIOps Industry Revenue (Million) Forecast, by Application 2019 & 2032
- Table 39: Ecuador AIOps Industry Revenue (Million) Forecast, by Application 2019 & 2032
- Table 40: Venezuela AIOps Industry Revenue (Million) Forecast, by Application 2019 & 2032
- Table 41: Rest of South America AIOps Industry Revenue (Million) Forecast, by Application 2019 & 2032
- Table 42: Global AIOps Industry Revenue Million Forecast, by Country 2019 & 2032
- Table 43: United Arab Emirates AIOps Industry Revenue (Million) Forecast, by Application 2019 & 2032
- Table 44: Saudi Arabia AIOps Industry Revenue (Million) Forecast, by Application 2019 & 2032
- Table 45: South Africa AIOps Industry Revenue (Million) Forecast, by Application 2019 & 2032
- Table 46: Rest of Middle East and Africa AIOps Industry Revenue (Million) Forecast, by Application 2019 & 2032
- Table 47: Global AIOps Industry Revenue Million Forecast, by Organization Type 2019 & 2032
- Table 48: Global AIOps Industry Revenue Million Forecast, by Deployment 2019 & 2032
- Table 49: Global AIOps Industry Revenue Million Forecast, by End-User Industry 2019 & 2032
- Table 50: Global AIOps Industry Revenue Million Forecast, by Country 2019 & 2032
- Table 51: Global AIOps Industry Revenue Million Forecast, by Organization Type 2019 & 2032
- Table 52: Global AIOps Industry Revenue Million Forecast, by Deployment 2019 & 2032
- Table 53: Global AIOps Industry Revenue Million Forecast, by End-User Industry 2019 & 2032
- Table 54: Global AIOps Industry Revenue Million Forecast, by Country 2019 & 2032
- Table 55: Global AIOps Industry Revenue Million Forecast, by Organization Type 2019 & 2032
- Table 56: Global AIOps Industry Revenue Million Forecast, by Deployment 2019 & 2032
- Table 57: Global AIOps Industry Revenue Million Forecast, by End-User Industry 2019 & 2032
- Table 58: Global AIOps Industry Revenue Million Forecast, by Country 2019 & 2032
- Table 59: Global AIOps Industry Revenue Million Forecast, by Organization Type 2019 & 2032
- Table 60: Global AIOps Industry Revenue Million Forecast, by Deployment 2019 & 2032
- Table 61: Global AIOps Industry Revenue Million Forecast, by End-User Industry 2019 & 2032
- Table 62: Global AIOps Industry Revenue Million Forecast, by Country 2019 & 2032
- Table 63: Global AIOps Industry Revenue Million Forecast, by Organization Type 2019 & 2032
- Table 64: Global AIOps Industry Revenue Million Forecast, by Deployment 2019 & 2032
- Table 65: Global AIOps Industry Revenue Million Forecast, by End-User Industry 2019 & 2032
- Table 66: Global AIOps Industry Revenue Million Forecast, by Country 2019 & 2032
Frequently Asked Questions
1. What is the projected Compound Annual Growth Rate (CAGR) of the AIOps Industry?
The projected CAGR is approximately 24.01%.
2. Which companies are prominent players in the AIOps Industry?
Key companies in the market include IBM , Cisco , Splunk , ServiceNow , BMC Software.
3. What are the main segments of the AIOps Industry?
The market segments include Organization Type, Deployment, End-User Industry.
4. Can you provide details about the market size?
The market size is estimated to be USD 27.24 Million as of 2022.
5. What are some drivers contributing to market growth?
Growing demand for AI-based services in IT operations; Increasing end-to-end business application assurance and uptime.
6. What are the notable trends driving market growth?
BFSI is Expected to Hold Significant Share.
7. Are there any restraints impacting market growth?
Increasing number of changes in IT operations.
8. Can you provide examples of recent developments in the market?
October 2022- IBM announced version 3.5 availability of the IBM Cloud Pak for Watson AIOps. With an emphasis on the capability to assist the users in understanding priorities among all IT stories in the context of a business line or service, IBM Cloud Pak for Watson AIOps v3.5 seeks to close this gap. Business context data is made available on an AIOps Insights Dashboard by Cloud Pak for Watson AIOps v3.5, a new offering feature in this release. It provides an illustration of the buyer context for the stakeholders to link business key performance indicators (KPIs) to application problems and rank repair options according to their potential effect.
9. What pricing options are available for accessing the report?
Pricing options include single-user, multi-user, and enterprise licenses priced at USD 4750, USD 5250, and USD 8750 respectively.
10. Is the market size provided in terms of value or volume?
The market size is provided in terms of value, measured in Million.
11. Are there any specific market keywords associated with the report?
Yes, the market keyword associated with the report is "AIOps Industry," which aids in identifying and referencing the specific market segment covered.
12. How do I determine which pricing option suits my needs best?
The pricing options vary based on user requirements and access needs. Individual users may opt for single-user licenses, while businesses requiring broader access may choose multi-user or enterprise licenses for cost-effective access to the report.
13. Are there any additional resources or data provided in the AIOps Industry report?
While the report offers comprehensive insights, it's advisable to review the specific contents or supplementary materials provided to ascertain if additional resources or data are available.
14. How can I stay updated on further developments or reports in the AIOps Industry?
To stay informed about further developments, trends, and reports in the AIOps Industry, consider subscribing to industry newsletters, following relevant companies and organizations, or regularly checking reputable industry news sources and publications.
Methodology
Step 1 - Identification of Relevant Samples Size from Population Database


Step 2 - Approaches for Defining Global Market Size (Value, Volume* & Price*)

Note*: In applicable scenarios
Step 3 - Data Sources
Primary Research
- Web Analytics
- Survey Reports
- Research Institute
- Latest Research Reports
- Opinion Leaders
Secondary Research
- Annual Reports
- White Paper
- Latest Press Release
- Industry Association
- Paid Database
- Investor Presentations

Step 4 - Data Triangulation
Involves using different sources of information in order to increase the validity of a study
These sources are likely to be stakeholders in a program - participants, other researchers, program staff, other community members, and so on.
Then we put all data in single framework & apply various statistical tools to find out the dynamic on the market.
During the analysis stage, feedback from the stakeholder groups would be compared to determine areas of agreement as well as areas of divergence
