

Key Insights
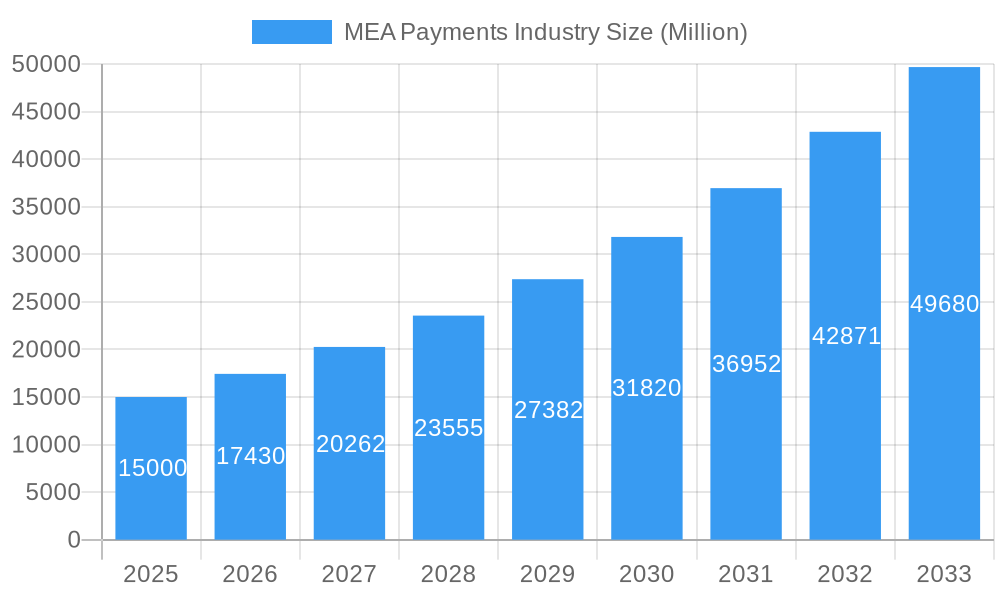
The Middle East and Africa (MEA) payments industry is demonstrating substantial growth, propelled by increasing smartphone adoption, expanding internet connectivity, and a thriving e-commerce landscape. With a projected Compound Annual Growth Rate (CAGR) of 7.1%, the market is anticipated to reach a significant valuation of $20672.1 million by 2024. Key growth drivers include the rapid expansion of online sales across diverse sectors such as retail, entertainment, healthcare, and hospitality. The proliferation of mobile money platforms, particularly in sub-Saharan Africa, is a major contributor to this expansion. Diversified payment methods, including Point-of-Sale (POS) systems and online payment gateways, are enhancing consumer and business convenience. While infrastructure challenges and financial inclusion concerns exist, the overall growth outlook remains positive. Leading players like Safaricom, Opay, Visa, and Jumia, alongside emerging fintech innovators, are shaping this dynamic market. Notable geographical hubs for growth include South Africa, the United Arab Emirates, and Saudi Arabia, supported by favorable regulatory environments and high digital payment adoption rates.
MEA Payments Industry Market Size (In Billion)
The future trajectory of the MEA payments industry is characterized by several key trends. The increasing adoption of contactless payments and mobile wallets signifies a move towards cashless transactions. The expansion of open banking initiatives will foster greater integration and interoperability among financial institutions, driving competition and innovation. Enhanced cybersecurity and data privacy measures are crucial in addressing the evolving risks of digital transactions. Regulatory frameworks promoting financial inclusion and a competitive market will be instrumental in shaping the industry. The sustained growth of e-commerce, coupled with increasing digital literacy, will continue to fuel market expansion. As the MEA region progresses through its digital transformation, the payments industry will remain a vital catalyst for economic development and financial inclusion.
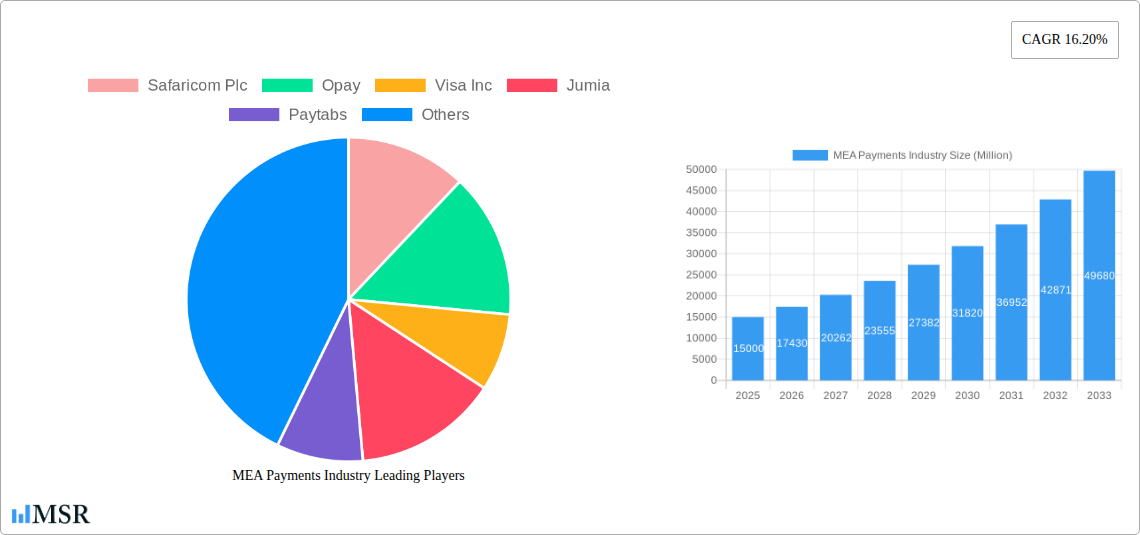
MEA Payments Industry Company Market Share
MEA Payments Industry Report: 2019-2033 Forecast
This comprehensive report provides an in-depth analysis of the Middle East and Africa (MEA) payments industry, offering invaluable insights for stakeholders seeking to navigate this rapidly evolving market. With a study period spanning 2019-2033, a base year of 2025, and a forecast period of 2025-2033, this report delivers actionable intelligence on market size, growth drivers, competitive dynamics, and emerging opportunities. The report covers key players including Safaricom Plc, Opay, Visa Inc, Jumia, Paytabs, PalmPay Technology Co Ltd, Interswitch Ltd, Amazon.com Inc, Apple Inc, and Network International Holdings Plc, among others.
MEA Payments Industry Market Concentration & Dynamics
The MEA payments landscape is characterized by a dynamic interplay of established players and emerging fintechs. Market concentration is moderate, with a few dominant players holding significant shares, while numerous smaller companies compete in niche segments. The market share of the top 5 players in 2024 is estimated at xx%. Innovation is a key driver, with companies investing heavily in mobile money, digital wallets, and other technologies. Regulatory frameworks vary across countries, impacting market access and operations. Substitute products, such as cash and traditional banking services, still hold significant relevance, particularly in less developed regions. End-user trends show a clear preference for digital payment methods, driven by increasing smartphone penetration and internet access. M&A activity is robust, with xx deals recorded between 2019 and 2024, indicating consolidation and expansion strategies within the industry.
- Market Share: Top 5 players: xx% in 2024 (estimated)
- M&A Activity: xx deals (2019-2024)
- Key Trends: Growing adoption of mobile money, increasing regulatory scrutiny, strategic partnerships between traditional financial institutions and fintechs.
MEA Payments Industry Industry Insights & Trends
The MEA payments industry is experiencing remarkable growth, driven by factors such as increasing smartphone penetration, rising internet usage, and expanding e-commerce adoption. The market size is projected to reach $xx Million by 2025, expanding at a Compound Annual Growth Rate (CAGR) of xx% during the forecast period (2025-2033). This growth is fueled by several key factors: the rapid expansion of mobile money services across several countries, the increasing popularity of online shopping, and supportive government policies that promote digital financial inclusion. However, challenges remain, including infrastructure limitations in certain regions, cybersecurity concerns, and the need for improved financial literacy among consumers. The industry is also witnessing a technological disruption driven by advancements in artificial intelligence, blockchain technology, and the emergence of innovative payment solutions.
Key Markets & Segments Leading MEA Payments Industry
The MEA payments market presents diverse growth opportunities across various segments and geographies. While the overall market shows robust growth, specific segments and countries exhibit even more significant expansion.
By Country: The United Arab Emirates and South Africa lead in terms of market size and adoption of digital payments, benefiting from established financial infrastructures and relatively higher per capita incomes. Saudi Arabia shows strong growth potential due to its large population and ongoing economic diversification. The "Rest of MEA" segment demonstrates considerable variation in maturity levels, with some countries displaying rapid growth while others remain primarily cash-based.
By End-user Industry: Retail, followed by entertainment and hospitality, demonstrates the highest transaction volumes and growth potential. Growth drivers for these segments include the expansion of e-commerce platforms, the proliferation of online travel agencies, and a growing preference for cashless transactions in entertainment venues. Healthcare and other end-user industries are witnessing gradual but steady adoption of digital payments.
By Mode of Payment: Point-of-Sale (POS) systems are experiencing significant expansion, driven by the increasing adoption of mobile POS solutions and the growing number of merchants accepting digital payments. Online sales are another major segment, fueled by the rapid growth of e-commerce across the region.
Drivers: Strong economic growth in certain countries, improving telecommunications infrastructure, government initiatives promoting financial inclusion, and a growing preference among consumers for digital payment solutions.
MEA Payments Industry Product Developments
The MEA payments landscape is witnessing significant innovation in payment solutions. New products leverage technologies like biometric authentication, blockchain for enhanced security, and AI-powered fraud detection systems. Mobile money platforms continue to evolve, integrating features such as merchant payments, peer-to-peer transfers, and bill payments. These advancements enhance convenience, security, and efficiency, giving businesses a competitive edge in attracting and retaining customers.
Challenges in the MEA Payments Industry Market
The MEA payments market faces several challenges, including: regulatory hurdles varying across countries, impacting market access and operational costs; supply chain disruptions affecting the availability of POS terminals and other payment infrastructure; and fierce competition amongst established players and innovative fintech startups, leading to price wars and a need for constant innovation to maintain market share. These factors can collectively impact overall market growth by an estimated xx% annually.
Forces Driving MEA Payments Industry Growth
Several factors are propelling the growth of the MEA payments industry. Technological advancements, including the increasing adoption of mobile money and digital wallets, are driving efficiency and accessibility. Economic growth in several MEA countries is fueling consumer spending and increasing demand for convenient payment solutions. Supportive government policies and regulatory frameworks promoting financial inclusion and digital transformation are also fostering industry expansion. For example, the recent partnership between LINX and IXAfrica significantly improves internet infrastructure, supporting the growth of online transactions.
Long-Term Growth Catalysts in the MEA Payments Industry
Long-term growth in the MEA payments industry will be fueled by continuous innovation in payment technologies, strategic partnerships between traditional financial institutions and fintech companies, and market expansion into underserved areas. The focus on financial inclusion and government support for digital payment adoption will further accelerate this growth. Moreover, the expanding usage of mobile payment apps and the integration of payment services with other platforms like e-commerce will contribute significantly to the market's sustained growth.
Emerging Opportunities in MEA Payments Industry
Emerging opportunities lie in untapped markets within the MEA region, particularly in less-developed countries with growing mobile penetration. The adoption of innovative technologies, such as blockchain and AI, presents significant opportunities for enhanced security and personalized payment solutions. The increasing demand for seamless cross-border payments presents another major growth area. Finally, catering to the evolving consumer preferences for personalized and convenient payment experiences will be crucial for success.
Leading Players in the MEA Payments Industry Sector
- Safaricom Plc
- Opay
- Visa Inc
- Jumia
- Paytabs
- PalmPay Technology Co Ltd
- Interswitch Ltd
- Amazon.com Inc
- Apple Inc
- Network International Holdings Plc
Key Milestones in MEA Payments Industry Industry
- August 2021: Visa introduces digital payments in Sudan, collaborating with eight partners to expand access.
- June 2022: LINX establishes a new interconnection facility in Nairobi, Kenya, enhancing internet infrastructure for digital payments.
Strategic Outlook for MEA Payments Industry Market
The MEA payments industry possesses significant growth potential over the next decade. Continued technological innovation, strategic collaborations, and expanding financial inclusion will drive market expansion. Companies that adapt to evolving consumer preferences, strengthen cybersecurity measures, and navigate the regulatory landscape effectively will be best positioned to capitalize on the vast opportunities within this dynamic market. The focus on expanding digital financial services to underserved populations presents a particularly significant opportunity for long-term growth and social impact.
MEA Payments Industry Segmentation
-
1. Mode of Payment
-
1.1. Point of Sale
- 1.1.1. Card Pay
- 1.1.2. Digital Wallet (Includes Mobile Wallets)
- 1.1.3. Cash
- 1.1.4. Others
-
1.2. Online Sale
- 1.2.1. Others (
-
1.1. Point of Sale
-
2. End-user Industry
- 2.1. Retail
- 2.2. Entertainment
- 2.3. Healthcare
- 2.4. Hospitality
- 2.5. Other End-user Industries
MEA Payments Industry Segmentation By Geography
-
1. North America
- 1.1. United States
- 1.2. Canada
- 1.3. Mexico
-
2. South America
- 2.1. Brazil
- 2.2. Argentina
- 2.3. Rest of South America
-
3. Europe
- 3.1. United Kingdom
- 3.2. Germany
- 3.3. France
- 3.4. Italy
- 3.5. Spain
- 3.6. Russia
- 3.7. Benelux
- 3.8. Nordics
- 3.9. Rest of Europe
-
4. Middle East & Africa
- 4.1. Turkey
- 4.2. Israel
- 4.3. GCC
- 4.4. North Africa
- 4.5. South Africa
- 4.6. Rest of Middle East & Africa
-
5. Asia Pacific
- 5.1. China
- 5.2. India
- 5.3. Japan
- 5.4. South Korea
- 5.5. ASEAN
- 5.6. Oceania
- 5.7. Rest of Asia Pacific
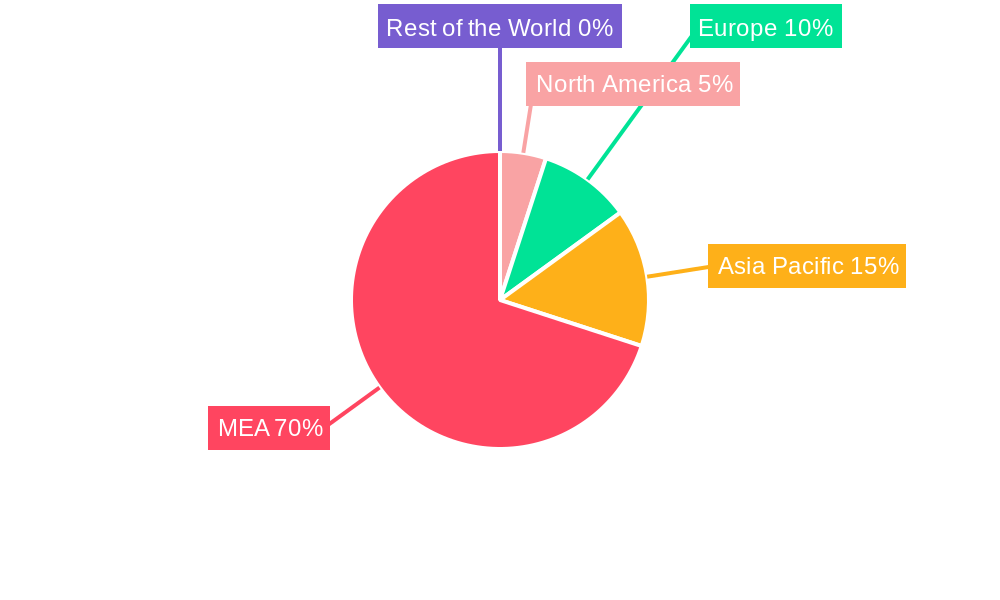
MEA Payments Industry Regional Market Share
Geographic Coverage of MEA Payments Industry
MEA Payments Industry REPORT HIGHLIGHTS
| Aspects | Details |
|---|---|
| Study Period | 2020-2034 |
| Base Year | 2025 |
| Estimated Year | 2026 |
| Forecast Period | 2026-2034 |
| Historical Period | 2020-2025 |
| Growth Rate | CAGR of 7.1% from 2020-2034 |
| Segmentation |
|
Table of Contents
- 1. Introduction
- 1.1. Research Scope
- 1.2. Market Segmentation
- 1.3. Research Objective
- 1.4. Definitions and Assumptions
- 2. Executive Summary
- 2.1. Market Snapshot
- 3. Market Dynamics
- 3.1. Market Drivers
- 3.2. Market Restrains
- 3.3. Market Trends
- 3.4. Market Opportunities
- 4. Market Factor Analysis
- 4.1. Porters Five Forces
- 4.1.1. Bargaining Power of Suppliers
- 4.1.2. Bargaining Power of Buyers
- 4.1.3. Threat of New Entrants
- 4.1.4. Threat of Substitutes
- 4.1.5. Competitive Rivalry
- 4.2. PESTEL analysis
- 4.3. BCG Analysis
- 4.3.1. Stars (High Growth, High Market Share)
- 4.3.2. Cash Cows (Low Growth, High Market Share)
- 4.3.3. Question Mark (High Growth, Low Market Share)
- 4.3.4. Dogs (Low Growth, Low Market Share)
- 4.4. Ansoff Matrix Analysis
- 4.5. Supply Chain Analysis
- 4.6. Regulatory Landscape
- 4.7. Current Market Potential and Opportunity Assessment (TAM–SAM–SOM Framework)
- 4.8. MSR Analyst Note
- 4.1. Porters Five Forces
- 5. Market Analysis, Insights and Forecast 2021-2033
- 5.1. Market Analysis, Insights and Forecast - by Mode of Payment
- 5.1.1. Point of Sale
- 5.1.1.1. Card Pay
- 5.1.1.2. Digital Wallet (Includes Mobile Wallets)
- 5.1.1.3. Cash
- 5.1.1.4. Others
- 5.1.2. Online Sale
- 5.1.2.1. Others (
- 5.1.1. Point of Sale
- 5.2. Market Analysis, Insights and Forecast - by End-user Industry
- 5.2.1. Retail
- 5.2.2. Entertainment
- 5.2.3. Healthcare
- 5.2.4. Hospitality
- 5.2.5. Other End-user Industries
- 5.3. Market Analysis, Insights and Forecast - by Region
- 5.3.1. North America
- 5.3.2. South America
- 5.3.3. Europe
- 5.3.4. Middle East & Africa
- 5.3.5. Asia Pacific
- 5.1. Market Analysis, Insights and Forecast - by Mode of Payment
- 6. Global MEA Payments Industry Analysis, Insights and Forecast, 2021-2033
- 6.1. Market Analysis, Insights and Forecast - by Mode of Payment
- 6.1.1. Point of Sale
- 6.1.1.1. Card Pay
- 6.1.1.2. Digital Wallet (Includes Mobile Wallets)
- 6.1.1.3. Cash
- 6.1.1.4. Others
- 6.1.2. Online Sale
- 6.1.2.1. Others (
- 6.1.1. Point of Sale
- 6.2. Market Analysis, Insights and Forecast - by End-user Industry
- 6.2.1. Retail
- 6.2.2. Entertainment
- 6.2.3. Healthcare
- 6.2.4. Hospitality
- 6.2.5. Other End-user Industries
- 6.1. Market Analysis, Insights and Forecast - by Mode of Payment
- 7. North America MEA Payments Industry Analysis, Insights and Forecast, 2020-2032
- 7.1. Market Analysis, Insights and Forecast - by Mode of Payment
- 7.1.1. Point of Sale
- 7.1.1.1. Card Pay
- 7.1.1.2. Digital Wallet (Includes Mobile Wallets)
- 7.1.1.3. Cash
- 7.1.1.4. Others
- 7.1.2. Online Sale
- 7.1.2.1. Others (
- 7.1.1. Point of Sale
- 7.2. Market Analysis, Insights and Forecast - by End-user Industry
- 7.2.1. Retail
- 7.2.2. Entertainment
- 7.2.3. Healthcare
- 7.2.4. Hospitality
- 7.2.5. Other End-user Industries
- 7.1. Market Analysis, Insights and Forecast - by Mode of Payment
- 8. South America MEA Payments Industry Analysis, Insights and Forecast, 2020-2032
- 8.1. Market Analysis, Insights and Forecast - by Mode of Payment
- 8.1.1. Point of Sale
- 8.1.1.1. Card Pay
- 8.1.1.2. Digital Wallet (Includes Mobile Wallets)
- 8.1.1.3. Cash
- 8.1.1.4. Others
- 8.1.2. Online Sale
- 8.1.2.1. Others (
- 8.1.1. Point of Sale
- 8.2. Market Analysis, Insights and Forecast - by End-user Industry
- 8.2.1. Retail
- 8.2.2. Entertainment
- 8.2.3. Healthcare
- 8.2.4. Hospitality
- 8.2.5. Other End-user Industries
- 8.1. Market Analysis, Insights and Forecast - by Mode of Payment
- 9. Europe MEA Payments Industry Analysis, Insights and Forecast, 2020-2032
- 9.1. Market Analysis, Insights and Forecast - by Mode of Payment
- 9.1.1. Point of Sale
- 9.1.1.1. Card Pay
- 9.1.1.2. Digital Wallet (Includes Mobile Wallets)
- 9.1.1.3. Cash
- 9.1.1.4. Others
- 9.1.2. Online Sale
- 9.1.2.1. Others (
- 9.1.1. Point of Sale
- 9.2. Market Analysis, Insights and Forecast - by End-user Industry
- 9.2.1. Retail
- 9.2.2. Entertainment
- 9.2.3. Healthcare
- 9.2.4. Hospitality
- 9.2.5. Other End-user Industries
- 9.1. Market Analysis, Insights and Forecast - by Mode of Payment
- 10. Middle East & Africa MEA Payments Industry Analysis, Insights and Forecast, 2020-2032
- 10.1. Market Analysis, Insights and Forecast - by Mode of Payment
- 10.1.1. Point of Sale
- 10.1.1.1. Card Pay
- 10.1.1.2. Digital Wallet (Includes Mobile Wallets)
- 10.1.1.3. Cash
- 10.1.1.4. Others
- 10.1.2. Online Sale
- 10.1.2.1. Others (
- 10.1.1. Point of Sale
- 10.2. Market Analysis, Insights and Forecast - by End-user Industry
- 10.2.1. Retail
- 10.2.2. Entertainment
- 10.2.3. Healthcare
- 10.2.4. Hospitality
- 10.2.5. Other End-user Industries
- 10.1. Market Analysis, Insights and Forecast - by Mode of Payment
- 11. Asia Pacific MEA Payments Industry Analysis, Insights and Forecast, 2020-2032
- 11.1. Market Analysis, Insights and Forecast - by Mode of Payment
- 11.1.1. Point of Sale
- 11.1.1.1. Card Pay
- 11.1.1.2. Digital Wallet (Includes Mobile Wallets)
- 11.1.1.3. Cash
- 11.1.1.4. Others
- 11.1.2. Online Sale
- 11.1.2.1. Others (
- 11.1.1. Point of Sale
- 11.2. Market Analysis, Insights and Forecast - by End-user Industry
- 11.2.1. Retail
- 11.2.2. Entertainment
- 11.2.3. Healthcare
- 11.2.4. Hospitality
- 11.2.5. Other End-user Industries
- 11.1. Market Analysis, Insights and Forecast - by Mode of Payment
- 12. Competitive Analysis
- 12.1. Company Profiles
- 12.1.1 Safaricom Plc
- 12.1.1.1. Company Overview
- 12.1.1.2. Products
- 12.1.1.3. Company Financials
- 12.1.1.4. SWOT Analysis
- 12.1.2 Opay
- 12.1.2.1. Company Overview
- 12.1.2.2. Products
- 12.1.2.3. Company Financials
- 12.1.2.4. SWOT Analysis
- 12.1.3 Visa Inc
- 12.1.3.1. Company Overview
- 12.1.3.2. Products
- 12.1.3.3. Company Financials
- 12.1.3.4. SWOT Analysis
- 12.1.4 Jumia
- 12.1.4.1. Company Overview
- 12.1.4.2. Products
- 12.1.4.3. Company Financials
- 12.1.4.4. SWOT Analysis
- 12.1.5 Paytabs
- 12.1.5.1. Company Overview
- 12.1.5.2. Products
- 12.1.5.3. Company Financials
- 12.1.5.4. SWOT Analysis
- 12.1.6 PalmPay Technology Co Ltd
- 12.1.6.1. Company Overview
- 12.1.6.2. Products
- 12.1.6.3. Company Financials
- 12.1.6.4. SWOT Analysis
- 12.1.7 Interswitch Ltd
- 12.1.7.1. Company Overview
- 12.1.7.2. Products
- 12.1.7.3. Company Financials
- 12.1.7.4. SWOT Analysis
- 12.1.8 Amazon com Inc *List Not Exhaustive
- 12.1.8.1. Company Overview
- 12.1.8.2. Products
- 12.1.8.3. Company Financials
- 12.1.8.4. SWOT Analysis
- 12.1.9 Apple Inc
- 12.1.9.1. Company Overview
- 12.1.9.2. Products
- 12.1.9.3. Company Financials
- 12.1.9.4. SWOT Analysis
- 12.1.10 Network International Holdings Plc
- 12.1.10.1. Company Overview
- 12.1.10.2. Products
- 12.1.10.3. Company Financials
- 12.1.10.4. SWOT Analysis
- 12.1.1 Safaricom Plc
- 12.2. Market Entropy
- 12.2.1 Company's Key Areas Served
- 12.2.2 Recent Developments
- 12.3. Company Market Share Analysis 2025
- 12.3.1 Top 5 Companies Market Share Analysis
- 12.3.2 Top 3 Companies Market Share Analysis
- 12.4. List of Potential Customers
- 13. Research Methodology
List of Figures
- Figure 1: Global MEA Payments Industry Revenue Breakdown (million, %) by Region 2025 & 2033
- Figure 2: North America MEA Payments Industry Revenue (million), by Mode of Payment 2025 & 2033
- Figure 3: North America MEA Payments Industry Revenue Share (%), by Mode of Payment 2025 & 2033
- Figure 4: North America MEA Payments Industry Revenue (million), by End-user Industry 2025 & 2033
- Figure 5: North America MEA Payments Industry Revenue Share (%), by End-user Industry 2025 & 2033
- Figure 6: North America MEA Payments Industry Revenue (million), by Country 2025 & 2033
- Figure 7: North America MEA Payments Industry Revenue Share (%), by Country 2025 & 2033
- Figure 8: South America MEA Payments Industry Revenue (million), by Mode of Payment 2025 & 2033
- Figure 9: South America MEA Payments Industry Revenue Share (%), by Mode of Payment 2025 & 2033
- Figure 10: South America MEA Payments Industry Revenue (million), by End-user Industry 2025 & 2033
- Figure 11: South America MEA Payments Industry Revenue Share (%), by End-user Industry 2025 & 2033
- Figure 12: South America MEA Payments Industry Revenue (million), by Country 2025 & 2033
- Figure 13: South America MEA Payments Industry Revenue Share (%), by Country 2025 & 2033
- Figure 14: Europe MEA Payments Industry Revenue (million), by Mode of Payment 2025 & 2033
- Figure 15: Europe MEA Payments Industry Revenue Share (%), by Mode of Payment 2025 & 2033
- Figure 16: Europe MEA Payments Industry Revenue (million), by End-user Industry 2025 & 2033
- Figure 17: Europe MEA Payments Industry Revenue Share (%), by End-user Industry 2025 & 2033
- Figure 18: Europe MEA Payments Industry Revenue (million), by Country 2025 & 2033
- Figure 19: Europe MEA Payments Industry Revenue Share (%), by Country 2025 & 2033
- Figure 20: Middle East & Africa MEA Payments Industry Revenue (million), by Mode of Payment 2025 & 2033
- Figure 21: Middle East & Africa MEA Payments Industry Revenue Share (%), by Mode of Payment 2025 & 2033
- Figure 22: Middle East & Africa MEA Payments Industry Revenue (million), by End-user Industry 2025 & 2033
- Figure 23: Middle East & Africa MEA Payments Industry Revenue Share (%), by End-user Industry 2025 & 2033
- Figure 24: Middle East & Africa MEA Payments Industry Revenue (million), by Country 2025 & 2033
- Figure 25: Middle East & Africa MEA Payments Industry Revenue Share (%), by Country 2025 & 2033
- Figure 26: Asia Pacific MEA Payments Industry Revenue (million), by Mode of Payment 2025 & 2033
- Figure 27: Asia Pacific MEA Payments Industry Revenue Share (%), by Mode of Payment 2025 & 2033
- Figure 28: Asia Pacific MEA Payments Industry Revenue (million), by End-user Industry 2025 & 2033
- Figure 29: Asia Pacific MEA Payments Industry Revenue Share (%), by End-user Industry 2025 & 2033
- Figure 30: Asia Pacific MEA Payments Industry Revenue (million), by Country 2025 & 2033
- Figure 31: Asia Pacific MEA Payments Industry Revenue Share (%), by Country 2025 & 2033
List of Tables
- Table 1: Global MEA Payments Industry Revenue million Forecast, by Mode of Payment 2020 & 2033
- Table 2: Global MEA Payments Industry Revenue million Forecast, by End-user Industry 2020 & 2033
- Table 3: Global MEA Payments Industry Revenue million Forecast, by Region 2020 & 2033
- Table 4: Global MEA Payments Industry Revenue million Forecast, by Mode of Payment 2020 & 2033
- Table 5: Global MEA Payments Industry Revenue million Forecast, by End-user Industry 2020 & 2033
- Table 6: Global MEA Payments Industry Revenue million Forecast, by Country 2020 & 2033
- Table 7: United States MEA Payments Industry Revenue (million) Forecast, by Application 2020 & 2033
- Table 8: Canada MEA Payments Industry Revenue (million) Forecast, by Application 2020 & 2033
- Table 9: Mexico MEA Payments Industry Revenue (million) Forecast, by Application 2020 & 2033
- Table 10: Global MEA Payments Industry Revenue million Forecast, by Mode of Payment 2020 & 2033
- Table 11: Global MEA Payments Industry Revenue million Forecast, by End-user Industry 2020 & 2033
- Table 12: Global MEA Payments Industry Revenue million Forecast, by Country 2020 & 2033
- Table 13: Brazil MEA Payments Industry Revenue (million) Forecast, by Application 2020 & 2033
- Table 14: Argentina MEA Payments Industry Revenue (million) Forecast, by Application 2020 & 2033
- Table 15: Rest of South America MEA Payments Industry Revenue (million) Forecast, by Application 2020 & 2033
- Table 16: Global MEA Payments Industry Revenue million Forecast, by Mode of Payment 2020 & 2033
- Table 17: Global MEA Payments Industry Revenue million Forecast, by End-user Industry 2020 & 2033
- Table 18: Global MEA Payments Industry Revenue million Forecast, by Country 2020 & 2033
- Table 19: United Kingdom MEA Payments Industry Revenue (million) Forecast, by Application 2020 & 2033
- Table 20: Germany MEA Payments Industry Revenue (million) Forecast, by Application 2020 & 2033
- Table 21: France MEA Payments Industry Revenue (million) Forecast, by Application 2020 & 2033
- Table 22: Italy MEA Payments Industry Revenue (million) Forecast, by Application 2020 & 2033
- Table 23: Spain MEA Payments Industry Revenue (million) Forecast, by Application 2020 & 2033
- Table 24: Russia MEA Payments Industry Revenue (million) Forecast, by Application 2020 & 2033
- Table 25: Benelux MEA Payments Industry Revenue (million) Forecast, by Application 2020 & 2033
- Table 26: Nordics MEA Payments Industry Revenue (million) Forecast, by Application 2020 & 2033
- Table 27: Rest of Europe MEA Payments Industry Revenue (million) Forecast, by Application 2020 & 2033
- Table 28: Global MEA Payments Industry Revenue million Forecast, by Mode of Payment 2020 & 2033
- Table 29: Global MEA Payments Industry Revenue million Forecast, by End-user Industry 2020 & 2033
- Table 30: Global MEA Payments Industry Revenue million Forecast, by Country 2020 & 2033
- Table 31: Turkey MEA Payments Industry Revenue (million) Forecast, by Application 2020 & 2033
- Table 32: Israel MEA Payments Industry Revenue (million) Forecast, by Application 2020 & 2033
- Table 33: GCC MEA Payments Industry Revenue (million) Forecast, by Application 2020 & 2033
- Table 34: North Africa MEA Payments Industry Revenue (million) Forecast, by Application 2020 & 2033
- Table 35: South Africa MEA Payments Industry Revenue (million) Forecast, by Application 2020 & 2033
- Table 36: Rest of Middle East & Africa MEA Payments Industry Revenue (million) Forecast, by Application 2020 & 2033
- Table 37: Global MEA Payments Industry Revenue million Forecast, by Mode of Payment 2020 & 2033
- Table 38: Global MEA Payments Industry Revenue million Forecast, by End-user Industry 2020 & 2033
- Table 39: Global MEA Payments Industry Revenue million Forecast, by Country 2020 & 2033
- Table 40: China MEA Payments Industry Revenue (million) Forecast, by Application 2020 & 2033
- Table 41: India MEA Payments Industry Revenue (million) Forecast, by Application 2020 & 2033
- Table 42: Japan MEA Payments Industry Revenue (million) Forecast, by Application 2020 & 2033
- Table 43: South Korea MEA Payments Industry Revenue (million) Forecast, by Application 2020 & 2033
- Table 44: ASEAN MEA Payments Industry Revenue (million) Forecast, by Application 2020 & 2033
- Table 45: Oceania MEA Payments Industry Revenue (million) Forecast, by Application 2020 & 2033
- Table 46: Rest of Asia Pacific MEA Payments Industry Revenue (million) Forecast, by Application 2020 & 2033
Frequently Asked Questions
1. What is the projected Compound Annual Growth Rate (CAGR) of the MEA Payments Industry?
The projected CAGR is approximately 7.1%.
2. Which companies are prominent players in the MEA Payments Industry?
Key companies in the market include Safaricom Plc, Opay, Visa Inc, Jumia, Paytabs, PalmPay Technology Co Ltd, Interswitch Ltd, Amazon com Inc *List Not Exhaustive, Apple Inc, Network International Holdings Plc.
3. What are the main segments of the MEA Payments Industry?
The market segments include Mode of Payment, End-user Industry.
4. Can you provide details about the market size?
The market size is estimated to be USD 20672.1 million as of 2022.
5. What are some drivers contributing to market growth?
Digital adoption is Accelerating the Payments Market in Middle East and Africa; Key Retailers and the Government are Promoting Market Digitization Through Activation Programs; Increase in Real-Time Payments. Particularly Buy Now Pay Later.
6. What are the notable trends driving market growth?
Digital adoption is Accelerating the Payments Market in Middle East and Africa.
7. Are there any restraints impacting market growth?
Lack of Standards in Applications and Initial Costs.
8. Can you provide examples of recent developments in the market?
June 2022 - The London Internet Exchange (LINX), one of the world's largest internet exchange points (IXPs), has announced a strategic partnership with IXAfrica, a Nairobi-based hyperscale data center provider. As part of the agreement, LINX will open a new interconnection facility in Nairobi, marking the company's first physical presence on the African continent.
9. What pricing options are available for accessing the report?
Pricing options include single-user, multi-user, and enterprise licenses priced at USD 4750, USD 4950, and USD 6800 respectively.
10. Is the market size provided in terms of value or volume?
The market size is provided in terms of value, measured in million.
11. Are there any specific market keywords associated with the report?
Yes, the market keyword associated with the report is "MEA Payments Industry," which aids in identifying and referencing the specific market segment covered.
12. How do I determine which pricing option suits my needs best?
The pricing options vary based on user requirements and access needs. Individual users may opt for single-user licenses, while businesses requiring broader access may choose multi-user or enterprise licenses for cost-effective access to the report.
13. Are there any additional resources or data provided in the MEA Payments Industry report?
While the report offers comprehensive insights, it's advisable to review the specific contents or supplementary materials provided to ascertain if additional resources or data are available.
14. How can I stay updated on further developments or reports in the MEA Payments Industry?
To stay informed about further developments, trends, and reports in the MEA Payments Industry, consider subscribing to industry newsletters, following relevant companies and organizations, or regularly checking reputable industry news sources and publications.
Methodology
Step 1 - Identification of Relevant Samples Size from Population Database


Step 2 - Approaches for Defining Global Market Size (Value, Volume* & Price*)

Note*: In applicable scenarios
Step 3 - Data Sources
Primary Research
- Web Analytics
- Survey Reports
- Research Institute
- Latest Research Reports
- Opinion Leaders
Secondary Research
- Annual Reports
- White Paper
- Latest Press Release
- Industry Association
- Paid Database
- Investor Presentations

Step 4 - Data Triangulation
Involves using different sources of information in order to increase the validity of a study
These sources are likely to be stakeholders in a program - participants, other researchers, program staff, other community members, and so on.
Then we put all data in single framework & apply various statistical tools to find out the dynamic on the market.
During the analysis stage, feedback from the stakeholder groups would be compared to determine areas of agreement as well as areas of divergence