

Key Insights
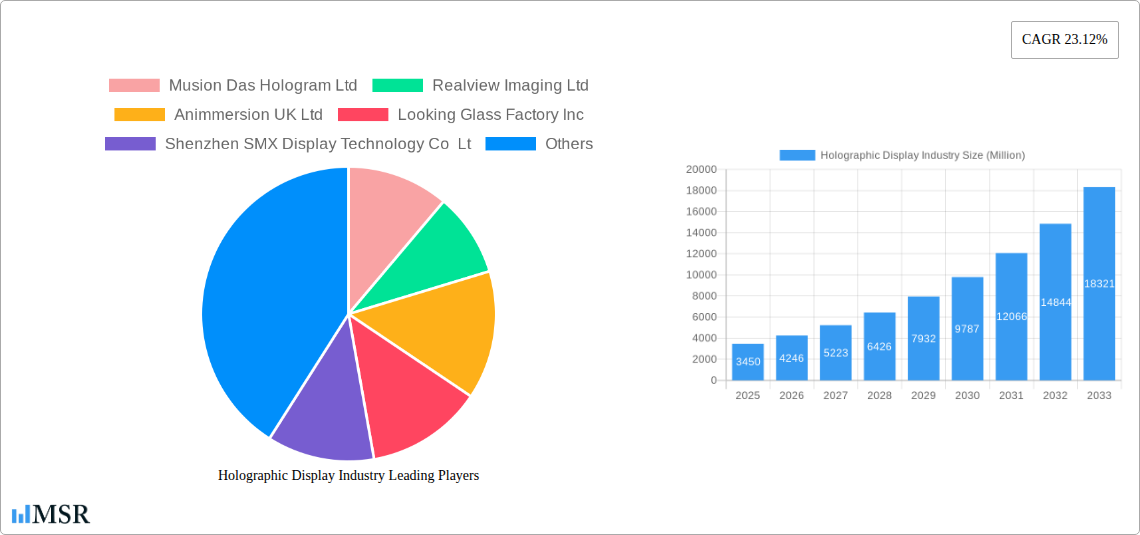
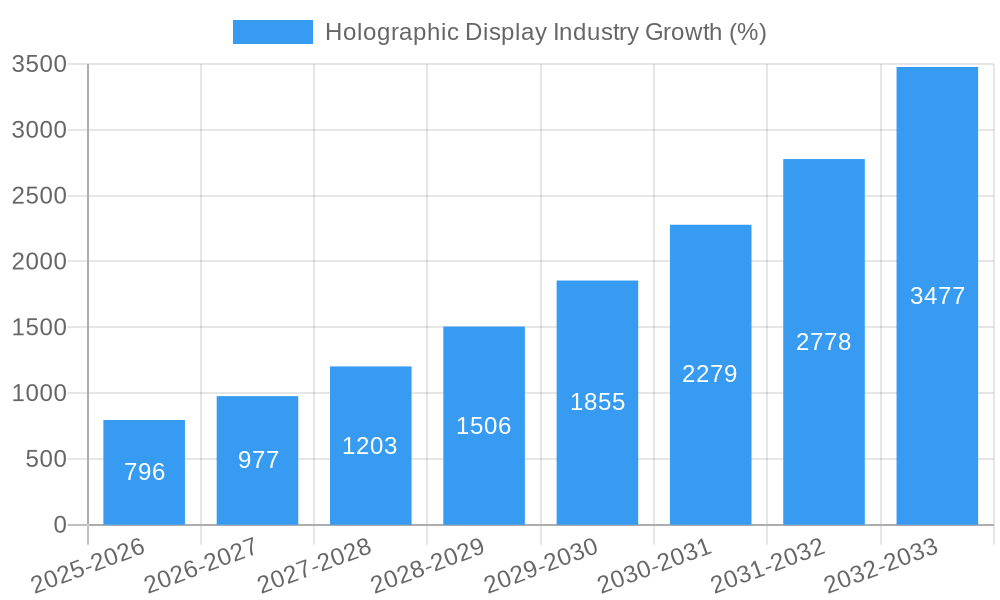
The holographic display market is experiencing explosive growth, projected to reach $3.45 billion in 2025 and exhibiting a remarkable Compound Annual Growth Rate (CAGR) of 23.12% from 2025 to 2033. This expansion is driven by several key factors. The increasing adoption of holographic displays across diverse end-user verticals, including consumer electronics (for immersive gaming and entertainment), retail (for interactive product displays), media and entertainment (for captivating live events and virtual concerts), and healthcare (for advanced medical imaging and training), is a significant catalyst. Furthermore, technological advancements leading to improved image quality, reduced costs, and increased portability are fueling market penetration. The integration of augmented reality (AR) and virtual reality (VR) technologies with holographic displays is creating new opportunities, particularly in the immersive entertainment and gaming sectors. Companies like Musion Das Hologram Ltd and Looking Glass Factory Inc are at the forefront of innovation, driving market competition and pushing the boundaries of holographic technology. This growth, however, may face challenges, such as the relatively high cost of production and technological limitations in achieving fully realistic, three-dimensional images.
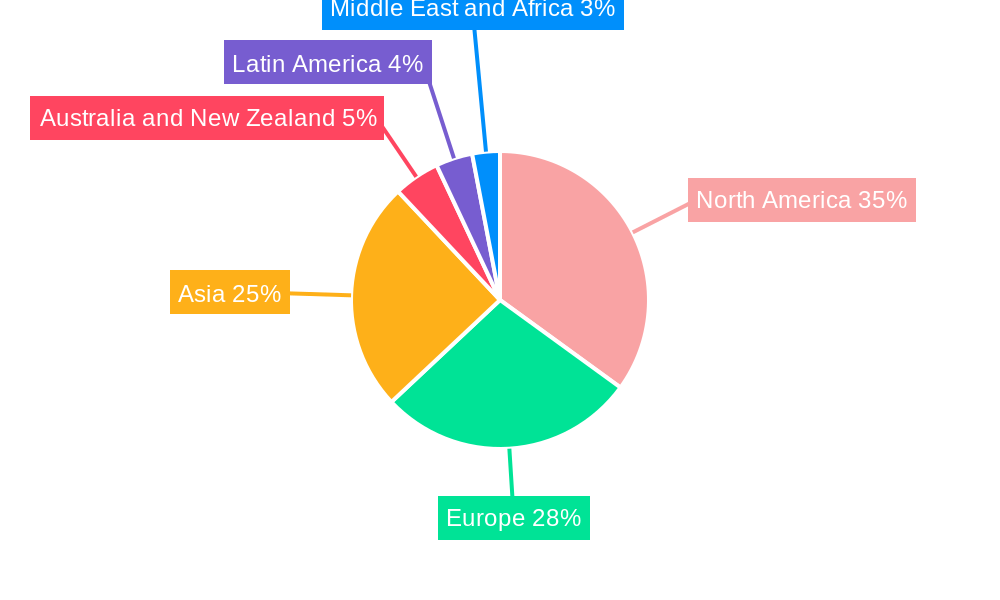
Despite these potential restraints, the long-term outlook for the holographic display market remains exceptionally positive. Continued research and development in areas such as improved light-field generation, higher resolution displays, and more efficient projection systems will overcome current technological hurdles. The increasing demand for innovative and engaging visual experiences across various industries ensures sustained market momentum. The geographical distribution of the market is likely to see significant growth in Asia, driven by the rapid expansion of technologically advanced economies and increasing consumer spending. While North America and Europe will continue to hold substantial market share, the Asia-Pacific region is poised to become a major contributor to overall market expansion in the coming years. This dynamic market presents substantial opportunities for both established players and emerging companies.
Holographic Display Market Report: 2019-2033
This comprehensive report provides an in-depth analysis of the holographic display market, offering valuable insights for industry stakeholders, investors, and businesses seeking to capitalize on this rapidly evolving technology. With a study period spanning 2019-2033, a base year of 2025, and a forecast period of 2025-2033, this report delivers a clear picture of the market's trajectory, encompassing historical data (2019-2024) and future projections. The global market is estimated to reach xx Million by 2025, demonstrating substantial growth potential. This report explores market dynamics, key players, technological advancements, and emerging trends, providing actionable insights to navigate the complexities of this exciting sector.
Holographic Display Industry Market Concentration & Dynamics
The holographic display market is characterized by a moderately concentrated landscape, with several key players vying for market share. While a few established companies hold significant positions, a number of smaller, innovative firms are actively contributing to technological advancements. Market share data from 2024 suggests that the top 5 players account for approximately 60% of the market, indicating room for both consolidation and the emergence of new contenders. The industry is witnessing increased M&A activity, with xx deals recorded in 2023, primarily driven by the need to expand product portfolios and access new technologies.
Innovation ecosystems play a crucial role, with collaborations between research institutions, startups, and established companies fostering technological breakthroughs. Regulatory frameworks are evolving to accommodate the unique aspects of holographic displays, focusing on safety, standardization, and intellectual property protection. Substitute products, such as advanced projection systems and augmented reality technologies, represent competitive pressures. However, the unique capabilities of holographic displays, particularly in terms of realism and three-dimensional imagery, position them for continued growth. End-user trends indicate increasing demand across various sectors, driving the development of specialized solutions for diverse applications.
Holographic Display Industry Industry Insights & Trends
The holographic display market is experiencing rapid expansion, propelled by several key factors. Technological advancements, such as improved resolution, brightness, and affordability, are driving wider adoption across various applications. The market size, estimated at xx Million in 2024, is projected to reach xx Million by 2033, exhibiting a compound annual growth rate (CAGR) of xx%. This robust growth is fuelled by increasing consumer demand for immersive experiences, the integration of holographic displays into consumer electronics, and the growing adoption of holographic technology in diverse sectors such as retail, entertainment, and healthcare. Evolving consumer behaviors, emphasizing personalized and interactive experiences, are creating new avenues for holographic display integration. Technological disruptions, such as advancements in laser technology and improved display materials, further contribute to market expansion. The growing use of artificial intelligence (AI) and machine learning (ML) for content creation and display optimization is poised to significantly reshape the industry landscape.
Key Markets & Segments Leading Holographic Display Industry
The Asia Pacific region currently dominates the holographic display market, driven by strong economic growth, substantial investments in technological infrastructure, and a large consumer base. North America and Europe also represent significant markets, with established technology sectors and high adoption rates in specific applications.
- By End-user Verticals:
- Consumer Electronics: The high demand for immersive gaming experiences and interactive entertainment fuels growth in this segment.
- Retail: Holographic displays are increasingly used for product demonstrations, virtual try-ons, and engaging marketing campaigns.
- Media and Entertainment: The integration of holographic displays in live performances, concerts, and movies provides immersive entertainment experiences.
- Military and Defense: High-resolution holographic displays and advanced training systems drive growth in this specialized area.
- Healthcare: Holographic displays are used for medical imaging, surgical simulations, and patient education.
- Automotive: Recent innovations such as Hyundai Mobis' transparent holographic display for vehicles represent an important developing application.
The automotive segment demonstrates particularly strong growth potential owing to the rising demand for advanced driver-assistance systems and in-car entertainment features.
Holographic Display Industry Product Developments
Recent product innovations center around improved resolution, increased brightness, and reduced costs. The development of transparent holographic displays, as exemplified by Hyundai Mobis' advancements, opens new possibilities for applications such as augmented reality overlays and heads-up displays. These advancements are enhancing the market appeal of holographic displays, providing competitive advantages to companies that successfully leverage these technologies. The increasing availability of affordable and efficient display solutions is further broadening market access.
Challenges in the Holographic Display Industry Market
The holographic display market faces challenges including high manufacturing costs, limited content availability, and regulatory hurdles related to safety standards and intellectual property. Supply chain constraints, particularly for specialized components, can also disrupt production and impact market growth. Furthermore, competition from existing display technologies, such as LCD and OLED, presents ongoing competitive pressures. These factors collectively impact the widespread adoption of holographic display technology, influencing the market's overall growth trajectory.
Forces Driving Holographic Display Industry Growth
Technological advancements such as improved resolution, brighter displays, and decreased production costs are major growth drivers. The increasing demand for immersive experiences in entertainment, retail, and other industries is fueling market expansion. Furthermore, government initiatives and investments in research and development are supporting the development and deployment of holographic technologies. These factors collectively create a strong impetus for the continued growth of the holographic display industry.
Long-Term Growth Catalysts in the Holographic Display Industry
Long-term growth in the holographic display industry will be driven by continued technological innovations resulting in smaller, more efficient, and cost-effective displays. Strategic partnerships between technology companies and content creators will ensure the creation and distribution of high-quality holographic experiences. Expansions into new markets, such as education and healthcare, will diversify application and broaden market reach.
Emerging Opportunities in Holographic Display Industry
Emerging trends suggest opportunities in new applications such as interactive advertising, personalized education, and advanced medical imaging. The development of compact and portable holographic displays will expand their usability across various sectors. Furthermore, increasing consumer demand for immersive experiences suggests strong potential for market growth across existing and new applications.
Leading Players in the Holographic Display Industry Sector
- Musiion Das Hologram Ltd
- Realview Imaging Ltd
- Animmersion UK Ltd
- Looking Glass Factory Inc
- Shenzhen SMX Display Technology Co Lt
- Kino-mo Limited (HYPERVSN)
- RealFiction Holding AB
- Provision Holding Inc
Key Milestones in Holographic Display Industry Industry
- January 2024: Hyundai Mobis unveiled its transparent holographic display for next-generation vehicles, showcasing advancements in automotive display technology and highlighting the potential of holographic displays in the automotive sector.
- January 2024: ARHT Media Inc. partnered with a global luxury retail brand to install ARHT Capsule hologram displays, demonstrating the growing adoption of holographic technology in the retail sector for marketing, training, and sales purposes.
Strategic Outlook for Holographic Display Industry Market
The future of the holographic display market is exceptionally promising. Continued technological advancements, coupled with the increasing demand for immersive experiences, point towards a significant expansion in market size and diverse applications. Strategic partnerships and investments in research and development will be crucial for companies to maintain a competitive edge and capitalize on the growing market potential. The industry is poised for robust growth and presents numerous lucrative opportunities for businesses to leverage cutting-edge holographic display technology.
Holographic Display Industry Segmentation
-
1. End-user Verticals
- 1.1. Consumer Electronics
- 1.2. Retail
- 1.3. Media and Entertainment
- 1.4. Military and Defense
- 1.5. Healthcare
- 1.6. Automotive
- 1.7. Other End-user Verticals
Holographic Display Industry Segmentation By Geography
- 1. North America
- 2. Europe
- 3. Asia
- 4. Australia and New Zealand
- 5. Latin America
- 6. Middle East and Africa
Holographic Display Industry REPORT HIGHLIGHTS
| Aspects | Details |
|---|---|
| Study Period | 2019-2033 |
| Base Year | 2024 |
| Estimated Year | 2025 |
| Forecast Period | 2025-2033 |
| Historical Period | 2019-2024 |
| Growth Rate | CAGR of 23.12% from 2019-2033 |
| Segmentation |
|
Table of Contents
- 1. Introduction
- 1.1. Research Scope
- 1.2. Market Segmentation
- 1.3. Research Methodology
- 1.4. Definitions and Assumptions
- 2. Executive Summary
- 2.1. Introduction
- 3. Market Dynamics
- 3.1. Introduction
- 3.2. Market Drivers
- 3.2.1. Increasing Investments in 3D Technology; Advancements in Screenless Displays
- 3.3. Market Restrains
- 3.3.1. High Cost of Assembling Holographic Display Devices; Presence of Substitute Display Products
- 3.4. Market Trends
- 3.4.1. Automotive Segment is Expected to Witness Significant Growth
- 4. Market Factor Analysis
- 4.1. Porters Five Forces
- 4.2. Supply/Value Chain
- 4.3. PESTEL analysis
- 4.4. Market Entropy
- 4.5. Patent/Trademark Analysis
- 5. Global Holographic Display Industry Analysis, Insights and Forecast, 2019-2031
- 5.1. Market Analysis, Insights and Forecast - by End-user Verticals
- 5.1.1. Consumer Electronics
- 5.1.2. Retail
- 5.1.3. Media and Entertainment
- 5.1.4. Military and Defense
- 5.1.5. Healthcare
- 5.1.6. Automotive
- 5.1.7. Other End-user Verticals
- 5.2. Market Analysis, Insights and Forecast - by Region
- 5.2.1. North America
- 5.2.2. Europe
- 5.2.3. Asia
- 5.2.4. Australia and New Zealand
- 5.2.5. Latin America
- 5.2.6. Middle East and Africa
- 5.1. Market Analysis, Insights and Forecast - by End-user Verticals
- 6. North America Holographic Display Industry Analysis, Insights and Forecast, 2019-2031
- 6.1. Market Analysis, Insights and Forecast - by End-user Verticals
- 6.1.1. Consumer Electronics
- 6.1.2. Retail
- 6.1.3. Media and Entertainment
- 6.1.4. Military and Defense
- 6.1.5. Healthcare
- 6.1.6. Automotive
- 6.1.7. Other End-user Verticals
- 6.1. Market Analysis, Insights and Forecast - by End-user Verticals
- 7. Europe Holographic Display Industry Analysis, Insights and Forecast, 2019-2031
- 7.1. Market Analysis, Insights and Forecast - by End-user Verticals
- 7.1.1. Consumer Electronics
- 7.1.2. Retail
- 7.1.3. Media and Entertainment
- 7.1.4. Military and Defense
- 7.1.5. Healthcare
- 7.1.6. Automotive
- 7.1.7. Other End-user Verticals
- 7.1. Market Analysis, Insights and Forecast - by End-user Verticals
- 8. Asia Holographic Display Industry Analysis, Insights and Forecast, 2019-2031
- 8.1. Market Analysis, Insights and Forecast - by End-user Verticals
- 8.1.1. Consumer Electronics
- 8.1.2. Retail
- 8.1.3. Media and Entertainment
- 8.1.4. Military and Defense
- 8.1.5. Healthcare
- 8.1.6. Automotive
- 8.1.7. Other End-user Verticals
- 8.1. Market Analysis, Insights and Forecast - by End-user Verticals
- 9. Australia and New Zealand Holographic Display Industry Analysis, Insights and Forecast, 2019-2031
- 9.1. Market Analysis, Insights and Forecast - by End-user Verticals
- 9.1.1. Consumer Electronics
- 9.1.2. Retail
- 9.1.3. Media and Entertainment
- 9.1.4. Military and Defense
- 9.1.5. Healthcare
- 9.1.6. Automotive
- 9.1.7. Other End-user Verticals
- 9.1. Market Analysis, Insights and Forecast - by End-user Verticals
- 10. Latin America Holographic Display Industry Analysis, Insights and Forecast, 2019-2031
- 10.1. Market Analysis, Insights and Forecast - by End-user Verticals
- 10.1.1. Consumer Electronics
- 10.1.2. Retail
- 10.1.3. Media and Entertainment
- 10.1.4. Military and Defense
- 10.1.5. Healthcare
- 10.1.6. Automotive
- 10.1.7. Other End-user Verticals
- 10.1. Market Analysis, Insights and Forecast - by End-user Verticals
- 11. Middle East and Africa Holographic Display Industry Analysis, Insights and Forecast, 2019-2031
- 11.1. Market Analysis, Insights and Forecast - by End-user Verticals
- 11.1.1. Consumer Electronics
- 11.1.2. Retail
- 11.1.3. Media and Entertainment
- 11.1.4. Military and Defense
- 11.1.5. Healthcare
- 11.1.6. Automotive
- 11.1.7. Other End-user Verticals
- 11.1. Market Analysis, Insights and Forecast - by End-user Verticals
- 12. North America Holographic Display Industry Analysis, Insights and Forecast, 2019-2031
- 12.1. Market Analysis, Insights and Forecast - By Country/Sub-region
- 12.1.1.
- 13. Europe Holographic Display Industry Analysis, Insights and Forecast, 2019-2031
- 13.1. Market Analysis, Insights and Forecast - By Country/Sub-region
- 13.1.1.
- 14. Asia Holographic Display Industry Analysis, Insights and Forecast, 2019-2031
- 14.1. Market Analysis, Insights and Forecast - By Country/Sub-region
- 14.1.1.
- 15. Australia and New Zealand Holographic Display Industry Analysis, Insights and Forecast, 2019-2031
- 15.1. Market Analysis, Insights and Forecast - By Country/Sub-region
- 15.1.1.
- 16. Latin America Holographic Display Industry Analysis, Insights and Forecast, 2019-2031
- 16.1. Market Analysis, Insights and Forecast - By Country/Sub-region
- 16.1.1.
- 17. Middle East and Africa Holographic Display Industry Analysis, Insights and Forecast, 2019-2031
- 17.1. Market Analysis, Insights and Forecast - By Country/Sub-region
- 17.1.1.
- 18. Competitive Analysis
- 18.1. Global Market Share Analysis 2024
- 18.2. Company Profiles
- 18.2.1 Musion Das Hologram Ltd
- 18.2.1.1. Overview
- 18.2.1.2. Products
- 18.2.1.3. SWOT Analysis
- 18.2.1.4. Recent Developments
- 18.2.1.5. Financials (Based on Availability)
- 18.2.2 Realview Imaging Ltd
- 18.2.2.1. Overview
- 18.2.2.2. Products
- 18.2.2.3. SWOT Analysis
- 18.2.2.4. Recent Developments
- 18.2.2.5. Financials (Based on Availability)
- 18.2.3 Animmersion UK Ltd
- 18.2.3.1. Overview
- 18.2.3.2. Products
- 18.2.3.3. SWOT Analysis
- 18.2.3.4. Recent Developments
- 18.2.3.5. Financials (Based on Availability)
- 18.2.4 Looking Glass Factory Inc
- 18.2.4.1. Overview
- 18.2.4.2. Products
- 18.2.4.3. SWOT Analysis
- 18.2.4.4. Recent Developments
- 18.2.4.5. Financials (Based on Availability)
- 18.2.5 Shenzhen SMX Display Technology Co Lt
- 18.2.5.1. Overview
- 18.2.5.2. Products
- 18.2.5.3. SWOT Analysis
- 18.2.5.4. Recent Developments
- 18.2.5.5. Financials (Based on Availability)
- 18.2.6 Kino-mo Limited (HYPERVSN)
- 18.2.6.1. Overview
- 18.2.6.2. Products
- 18.2.6.3. SWOT Analysis
- 18.2.6.4. Recent Developments
- 18.2.6.5. Financials (Based on Availability)
- 18.2.7 RealFiction Holding AB
- 18.2.7.1. Overview
- 18.2.7.2. Products
- 18.2.7.3. SWOT Analysis
- 18.2.7.4. Recent Developments
- 18.2.7.5. Financials (Based on Availability)
- 18.2.8 Provision Holding Inc
- 18.2.8.1. Overview
- 18.2.8.2. Products
- 18.2.8.3. SWOT Analysis
- 18.2.8.4. Recent Developments
- 18.2.8.5. Financials (Based on Availability)
- 18.2.1 Musion Das Hologram Ltd
List of Figures
- Figure 1: Global Holographic Display Industry Revenue Breakdown (Million, %) by Region 2024 & 2032
- Figure 2: North America Holographic Display Industry Revenue (Million), by Country 2024 & 2032
- Figure 3: North America Holographic Display Industry Revenue Share (%), by Country 2024 & 2032
- Figure 4: Europe Holographic Display Industry Revenue (Million), by Country 2024 & 2032
- Figure 5: Europe Holographic Display Industry Revenue Share (%), by Country 2024 & 2032
- Figure 6: Asia Holographic Display Industry Revenue (Million), by Country 2024 & 2032
- Figure 7: Asia Holographic Display Industry Revenue Share (%), by Country 2024 & 2032
- Figure 8: Australia and New Zealand Holographic Display Industry Revenue (Million), by Country 2024 & 2032
- Figure 9: Australia and New Zealand Holographic Display Industry Revenue Share (%), by Country 2024 & 2032
- Figure 10: Latin America Holographic Display Industry Revenue (Million), by Country 2024 & 2032
- Figure 11: Latin America Holographic Display Industry Revenue Share (%), by Country 2024 & 2032
- Figure 12: Middle East and Africa Holographic Display Industry Revenue (Million), by Country 2024 & 2032
- Figure 13: Middle East and Africa Holographic Display Industry Revenue Share (%), by Country 2024 & 2032
- Figure 14: North America Holographic Display Industry Revenue (Million), by End-user Verticals 2024 & 2032
- Figure 15: North America Holographic Display Industry Revenue Share (%), by End-user Verticals 2024 & 2032
- Figure 16: North America Holographic Display Industry Revenue (Million), by Country 2024 & 2032
- Figure 17: North America Holographic Display Industry Revenue Share (%), by Country 2024 & 2032
- Figure 18: Europe Holographic Display Industry Revenue (Million), by End-user Verticals 2024 & 2032
- Figure 19: Europe Holographic Display Industry Revenue Share (%), by End-user Verticals 2024 & 2032
- Figure 20: Europe Holographic Display Industry Revenue (Million), by Country 2024 & 2032
- Figure 21: Europe Holographic Display Industry Revenue Share (%), by Country 2024 & 2032
- Figure 22: Asia Holographic Display Industry Revenue (Million), by End-user Verticals 2024 & 2032
- Figure 23: Asia Holographic Display Industry Revenue Share (%), by End-user Verticals 2024 & 2032
- Figure 24: Asia Holographic Display Industry Revenue (Million), by Country 2024 & 2032
- Figure 25: Asia Holographic Display Industry Revenue Share (%), by Country 2024 & 2032
- Figure 26: Australia and New Zealand Holographic Display Industry Revenue (Million), by End-user Verticals 2024 & 2032
- Figure 27: Australia and New Zealand Holographic Display Industry Revenue Share (%), by End-user Verticals 2024 & 2032
- Figure 28: Australia and New Zealand Holographic Display Industry Revenue (Million), by Country 2024 & 2032
- Figure 29: Australia and New Zealand Holographic Display Industry Revenue Share (%), by Country 2024 & 2032
- Figure 30: Latin America Holographic Display Industry Revenue (Million), by End-user Verticals 2024 & 2032
- Figure 31: Latin America Holographic Display Industry Revenue Share (%), by End-user Verticals 2024 & 2032
- Figure 32: Latin America Holographic Display Industry Revenue (Million), by Country 2024 & 2032
- Figure 33: Latin America Holographic Display Industry Revenue Share (%), by Country 2024 & 2032
- Figure 34: Middle East and Africa Holographic Display Industry Revenue (Million), by End-user Verticals 2024 & 2032
- Figure 35: Middle East and Africa Holographic Display Industry Revenue Share (%), by End-user Verticals 2024 & 2032
- Figure 36: Middle East and Africa Holographic Display Industry Revenue (Million), by Country 2024 & 2032
- Figure 37: Middle East and Africa Holographic Display Industry Revenue Share (%), by Country 2024 & 2032
List of Tables
- Table 1: Global Holographic Display Industry Revenue Million Forecast, by Region 2019 & 2032
- Table 2: Global Holographic Display Industry Revenue Million Forecast, by End-user Verticals 2019 & 2032
- Table 3: Global Holographic Display Industry Revenue Million Forecast, by Region 2019 & 2032
- Table 4: Global Holographic Display Industry Revenue Million Forecast, by Country 2019 & 2032
- Table 5: Holographic Display Industry Revenue (Million) Forecast, by Application 2019 & 2032
- Table 6: Global Holographic Display Industry Revenue Million Forecast, by Country 2019 & 2032
- Table 7: Holographic Display Industry Revenue (Million) Forecast, by Application 2019 & 2032
- Table 8: Global Holographic Display Industry Revenue Million Forecast, by Country 2019 & 2032
- Table 9: Holographic Display Industry Revenue (Million) Forecast, by Application 2019 & 2032
- Table 10: Global Holographic Display Industry Revenue Million Forecast, by Country 2019 & 2032
- Table 11: Holographic Display Industry Revenue (Million) Forecast, by Application 2019 & 2032
- Table 12: Global Holographic Display Industry Revenue Million Forecast, by Country 2019 & 2032
- Table 13: Holographic Display Industry Revenue (Million) Forecast, by Application 2019 & 2032
- Table 14: Global Holographic Display Industry Revenue Million Forecast, by Country 2019 & 2032
- Table 15: Holographic Display Industry Revenue (Million) Forecast, by Application 2019 & 2032
- Table 16: Global Holographic Display Industry Revenue Million Forecast, by End-user Verticals 2019 & 2032
- Table 17: Global Holographic Display Industry Revenue Million Forecast, by Country 2019 & 2032
- Table 18: Global Holographic Display Industry Revenue Million Forecast, by End-user Verticals 2019 & 2032
- Table 19: Global Holographic Display Industry Revenue Million Forecast, by Country 2019 & 2032
- Table 20: Global Holographic Display Industry Revenue Million Forecast, by End-user Verticals 2019 & 2032
- Table 21: Global Holographic Display Industry Revenue Million Forecast, by Country 2019 & 2032
- Table 22: Global Holographic Display Industry Revenue Million Forecast, by End-user Verticals 2019 & 2032
- Table 23: Global Holographic Display Industry Revenue Million Forecast, by Country 2019 & 2032
- Table 24: Global Holographic Display Industry Revenue Million Forecast, by End-user Verticals 2019 & 2032
- Table 25: Global Holographic Display Industry Revenue Million Forecast, by Country 2019 & 2032
- Table 26: Global Holographic Display Industry Revenue Million Forecast, by End-user Verticals 2019 & 2032
- Table 27: Global Holographic Display Industry Revenue Million Forecast, by Country 2019 & 2032
Frequently Asked Questions
1. What is the projected Compound Annual Growth Rate (CAGR) of the Holographic Display Industry?
The projected CAGR is approximately 23.12%.
2. Which companies are prominent players in the Holographic Display Industry?
Key companies in the market include Musion Das Hologram Ltd, Realview Imaging Ltd, Animmersion UK Ltd, Looking Glass Factory Inc, Shenzhen SMX Display Technology Co Lt, Kino-mo Limited (HYPERVSN), RealFiction Holding AB, Provision Holding Inc.
3. What are the main segments of the Holographic Display Industry?
The market segments include End-user Verticals.
4. Can you provide details about the market size?
The market size is estimated to be USD 3.45 Million as of 2022.
5. What are some drivers contributing to market growth?
Increasing Investments in 3D Technology; Advancements in Screenless Displays.
6. What are the notable trends driving market growth?
Automotive Segment is Expected to Witness Significant Growth.
7. Are there any restraints impacting market growth?
High Cost of Assembling Holographic Display Devices; Presence of Substitute Display Products.
8. Can you provide examples of recent developments in the market?
Jan 2024: Hyundai Mobis, Hyundai’s largest supplier, unveiled its latest EV tech. It uses the first transparent display screen using holographic tech. The company revealed its “innovative display series” for next-gen vehicles, which included the “world’s first rollable display and swivel display.” Hyundai Mobis presented a transparent display that uses holographic elements. The display appears on a transparent panel, making it easier for drivers to keep their eyes on the road.
9. What pricing options are available for accessing the report?
Pricing options include single-user, multi-user, and enterprise licenses priced at USD 4750, USD 5250, and USD 8750 respectively.
10. Is the market size provided in terms of value or volume?
The market size is provided in terms of value, measured in Million.
11. Are there any specific market keywords associated with the report?
Yes, the market keyword associated with the report is "Holographic Display Industry," which aids in identifying and referencing the specific market segment covered.
12. How do I determine which pricing option suits my needs best?
The pricing options vary based on user requirements and access needs. Individual users may opt for single-user licenses, while businesses requiring broader access may choose multi-user or enterprise licenses for cost-effective access to the report.
13. Are there any additional resources or data provided in the Holographic Display Industry report?
While the report offers comprehensive insights, it's advisable to review the specific contents or supplementary materials provided to ascertain if additional resources or data are available.
14. How can I stay updated on further developments or reports in the Holographic Display Industry?
To stay informed about further developments, trends, and reports in the Holographic Display Industry, consider subscribing to industry newsletters, following relevant companies and organizations, or regularly checking reputable industry news sources and publications.
Methodology
Step 1 - Identification of Relevant Samples Size from Population Database


Step 2 - Approaches for Defining Global Market Size (Value, Volume* & Price*)

Note*: In applicable scenarios
Step 3 - Data Sources
Primary Research
- Web Analytics
- Survey Reports
- Research Institute
- Latest Research Reports
- Opinion Leaders
Secondary Research
- Annual Reports
- White Paper
- Latest Press Release
- Industry Association
- Paid Database
- Investor Presentations

Step 4 - Data Triangulation
Involves using different sources of information in order to increase the validity of a study
These sources are likely to be stakeholders in a program - participants, other researchers, program staff, other community members, and so on.
Then we put all data in single framework & apply various statistical tools to find out the dynamic on the market.
During the analysis stage, feedback from the stakeholder groups would be compared to determine areas of agreement as well as areas of divergence
