

Key Insights
The global 5G connected device market is projected for significant expansion, driven by widespread 5G infrastructure adoption. This growth unlocks enhanced mobile broadband, facilitates a surge in Internet of Things (IoT) devices, and supports critical applications across manufacturing, healthcare, and transportation. Innovations in smartphones, laptops, hotspots, and specialized Industrial Grade CPE/Router/Gateway devices, alongside advancements in Sub-6 GHz and mmWave spectrum technologies, are fueling this dynamic industry. Key players like Samsung, Xiaomi, BBK Electronics, and Huawei are investing heavily in research and development.
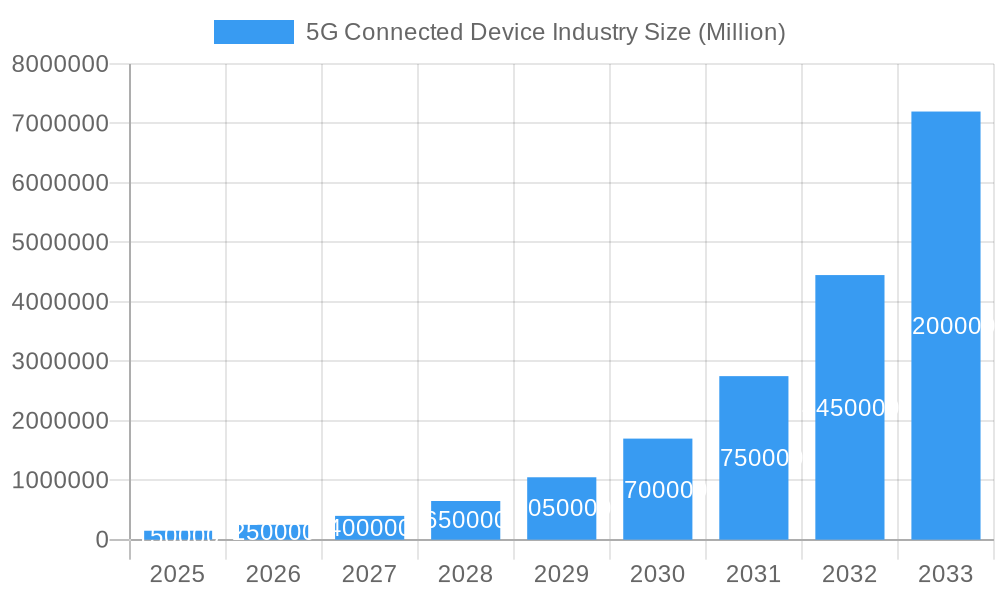
5G Connected Device Industry Market Size (In Billion)
The forecast period from 2025 to 2033 marks a transformative era for 5G connected devices. While consumer devices will initially lead growth, industrial and enterprise segments will drive long-term expansion, particularly in smart cities, autonomous vehicles, and advanced manufacturing. Challenges include high infrastructure costs, security concerns, and standardization needs. The Asia Pacific region, led by China, is expected to dominate, with North America and Europe also being critical markets.
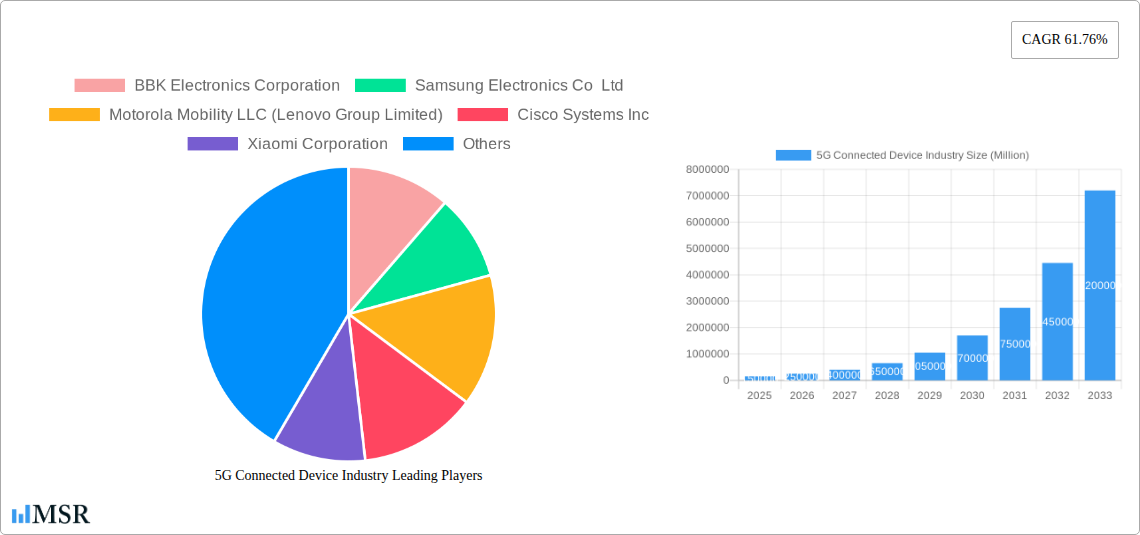
5G Connected Device Industry Company Market Share
5G Connected Device Market Analysis: Growth & Forecast (2025-2033)
This comprehensive market analysis forecasts the global 5G connected device market to reach $21.1 billion by 2025, with a projected Compound Annual Growth Rate (CAGR) of 13.2% through 2033. This report is essential for stakeholders in the 5G market, including device manufacturers, telecom operators, IoT solution providers, and technology investors. Explore key segments such as 5G smartphones, 5G CPE, 5G modules, and industrial 5G devices, across Sub-6 GHz and mmWave spectrums. Understand innovations in 5G network slicing, 5G SA deployment, and 5G Fixed Wireless Access (FWA). This report analyzes industry leaders including Samsung Electronics, Xiaomi, BBK Electronics, Motorola Mobility, Huawei Technologies, Nokia, ZTE, and Cisco Systems, and the role of Keysight Technologies in testing and validation.
5G Connected Device Industry Market Concentration & Dynamics
The 5G connected device industry exhibits a dynamic and evolving market concentration. While early stages saw dominance by established mobile device manufacturers, the landscape is rapidly diversifying with specialized players and emerging innovators. The innovation ecosystem is vibrant, fueled by intense R&D in areas like 5G chipsets, advanced antenna technologies, and integrated IoT solutions. Regulatory frameworks, particularly spectrum allocation and standardization efforts, play a pivotal role in shaping market access and deployment timelines. Substitute products, primarily advanced 4G devices, are gradually being displaced as 5G network coverage expands and the value proposition of higher speeds and lower latency becomes more apparent. End-user trends are shifting towards seamless connectivity for a broader range of applications, from enhanced mobile broadband to mission-critical industrial use cases. Mergers and acquisition (M&A) activities are on the rise as companies seek to consolidate market share, acquire critical technologies, and expand their product portfolios. The number of M&A deals has seen a significant uptick, indicating a consolidation phase. Key market share shifts are expected as new form factors gain traction.
- Market Concentration: Moderately fragmented with strong presence of key global players.
- Innovation Ecosystem: Thriving, with significant investment in R&D for 5G hardware and software.
- Regulatory Frameworks: Crucial for spectrum availability and deployment speed, impacting market entry.
- Substitute Products: Gradual displacement by 5G devices, particularly in high-performance segments.
- End-User Trends: Growing demand for enhanced mobile broadband, IoT applications, and industrial automation.
- M&A Activities: Increasing, signaling strategic consolidation and technology acquisition.
- M&A Deal Count: Estimated at over 50 major deals between 2020-2024.
5G Connected Device Industry Industry Insights & Trends
The 5G connected device industry is poised for explosive growth, driven by a confluence of technological advancements, expanding network infrastructure, and evolving consumer and enterprise demands. The projected global market size of over $500 Billion by 2033 underscores the transformative impact of 5G technology. From a base year of 2025, the market is anticipated to witness a robust CAGR of xx% throughout the forecast period (2025-2033). This surge is primarily fueled by the widespread deployment of 5G networks globally, enabling significantly higher data speeds, lower latency, and increased capacity. 5G Fixed Wireless Access (FWA) services are emerging as a compelling alternative to traditional broadband, especially in underserved areas, with companies like Nokia and Telia Finland pioneering commercial 5G SA networks with advanced network slicing capabilities. The proliferation of IoT devices, from smart homes to industrial automation and connected vehicles, is a major growth driver, creating a substantial demand for diverse 5G-enabled hardware. Smartphones continue to be a dominant segment, with manufacturers like Samsung launching affordable yet feature-rich 5G smartphones catering to emerging markets. The industrial sector is rapidly embracing 5G for digital transformation, with solutions like ZTE Corporation's industrial emulator and analyzer paving the way for enhanced operational efficiency and new service models. The expansion of mmWave spectrum alongside Sub-6 GHz bands will unlock ultra-high bandwidth applications. The historical period (2019-2024) has laid the foundation, characterized by initial deployments and technology maturation, paving the way for the accelerated growth anticipated in the coming years.
Key Markets & Segments Leading 5G Connected Device Industry
The 5G connected device industry's dominance is currently characterized by a strong presence in high-income regions with well-established 5G network infrastructure. North America and Asia-Pacific are at the forefront, driven by aggressive network rollouts and high consumer adoption rates. China, in particular, is a significant market due to its early adoption of 5G and a vast domestic manufacturing base for 5G devices.
Form Factor Dominance:
- Smartphones: Remain the largest segment by volume, driven by consumer upgrades and the growing availability of affordable models like Samsung's Galaxy M13 5G. The integration of multiple 5G bands is a key competitive factor.
- CPE (Indoor/Outdoor) & Industrial Grade CPE/Router/Gateway: This segment is experiencing rapid growth, particularly with the expansion of 5G Fixed Wireless Access (FWA). Nokia and Telia Finland's launch of 5G SA networks with network slicing for FWA highlights the growing importance of these devices for home and business connectivity. Industrial applications demanding robust and reliable connectivity are also boosting the adoption of industrial-grade CPE.
- Modules: Essential for embedding 5G connectivity into a wide array of devices, from wearables to industrial sensors, these are critical for the broader IoT ecosystem.
- Hotspots & Laptops: While smaller segments, they cater to specific use cases requiring portable and high-speed internet access.
Spectrum Support:
- Sub-6 GHz: Currently the dominant spectrum band due to its wider coverage and penetration capabilities, enabling widespread 5G network deployment.
- Both Spectrum Bands (Sub-6 GHz and mmWave): This combination offers the best of both worlds, with Sub-6 GHz for broad coverage and mmWave for ultra-high speeds in dense urban areas and specific enterprise applications. The adoption of devices supporting both bands is crucial for maximizing 5G's potential.
Drivers for this dominance include:
- Economic Growth: Strong economies foster greater consumer and enterprise spending on advanced technology.
- Infrastructure Development: Aggressive 5G network build-outs by leading telecom operators create the demand for connected devices.
- Government Initiatives: Supportive policies and spectrum auctions accelerate 5G adoption.
- Technological Advancements: Continuous innovation in chipsets, antennas, and device design.
5G Connected Device Industry Product Developments
Product innovation in the 5G connected device industry is accelerating, focusing on enhancing performance, expanding use cases, and improving affordability. Companies are rapidly developing 5G-enabled smartphones, CPEs, modules, and industrial-grade gateways that leverage the full potential of 5G SA and network slicing. Key advancements include improved power efficiency, enhanced antenna designs for better signal reception across various spectrum bands (Sub-6 GHz and mmWave), and integration of AI for optimized connectivity. The development of cost-effective solutions, such as Samsung's budget-friendly 5G smartphones, is crucial for broader market penetration. Furthermore, the focus on industrial applications is driving the development of ruggedized and specialized 5G devices for sectors like manufacturing, logistics, and healthcare.
Challenges in the 5G Connected Device Industry Market
Despite the immense potential, the 5G connected device industry faces several significant challenges that could impede its growth trajectory. The high cost of 5G network deployment, particularly the rollout of mmWave infrastructure, remains a substantial barrier. Supply chain disruptions, exacerbated by global events, continue to affect the availability and cost of critical components, impacting manufacturing timelines for 5G devices. Regulatory hurdles and spectrum allocation complexities in certain regions can slow down market expansion. Furthermore, the need for greater consumer awareness and education regarding the benefits and use cases of 5G technology is crucial for driving adoption. Security concerns associated with the vast number of connected devices also require continuous attention and robust solutions.
- Infrastructure Costs: Significant investment required for widespread 5G network deployment.
- Supply Chain Volatility: Potential for component shortages and price fluctuations.
- Spectrum Allocation: Delays or complexities in securing necessary spectrum licenses.
- Consumer Awareness: Need for education on 5G benefits and applications.
- Security Vulnerabilities: Addressing evolving cybersecurity threats in a hyper-connected environment.
Forces Driving 5G Connected Device Industry Growth
The 5G connected device industry is propelled by a potent combination of technological, economic, and regulatory forces. The inherent capabilities of 5G – ultra-high speeds, ultra-low latency, and massive device connectivity – are fundamental drivers. The rapid global expansion of 5G networks, including the commercialization of 5G SA with network slicing, is creating a fertile ground for device adoption. Economic factors, such as increasing disposable incomes and the growing demand for enhanced digital experiences, further fuel consumer spending on 5G smartphones and related devices. Government initiatives and supportive policies aimed at accelerating digital transformation and fostering innovation play a crucial role. The burgeoning Internet of Things (IoT) ecosystem, encompassing smart homes, industrial automation, and connected vehicles, is a significant catalyst, demanding robust and ubiquitous 5G connectivity.
Challenges in the 5G Connected Device Industry Market
Long-term growth in the 5G connected device industry will be significantly influenced by overcoming persistent challenges and fostering continuous innovation. The ongoing need for network densification, particularly for mmWave deployment in urban areas, requires substantial and sustained investment. Ensuring the security and privacy of the ever-increasing volume of connected devices remains a paramount concern, necessitating advanced cybersecurity solutions and standardization. The development of compelling 5G use cases beyond enhanced mobile broadband, especially in enterprise and industrial sectors, will be critical for unlocking the full market potential. Furthermore, addressing the digital divide and ensuring equitable access to 5G services across diverse geographic and socio-economic landscapes is essential for sustainable and inclusive growth.
Emerging Opportunities in 5G Connected Device Industry
The 5G connected device industry is ripe with emerging opportunities driven by technological evolution and shifting market demands. The expansion of 5G Fixed Wireless Access (FWA) presents a significant opportunity to bridge the digital divide and offer high-speed broadband to underserved areas, creating a vast market for 5G CPE and routers. The rapid growth of the Industrial IoT (IIoT), powered by 5G's low latency and reliability, opens avenues for specialized industrial-grade 5G devices, sensors, and gateways for automation, predictive maintenance, and smart manufacturing. The integration of AI and edge computing with 5G connectivity unlocks new possibilities for real-time data processing and intelligent applications. The development of immersive experiences like AR/VR and the metaverse will rely heavily on the bandwidth and low latency offered by 5G devices. Furthermore, the increasing demand for connected health and smart city solutions presents substantial growth potential for a diverse range of 5G-enabled devices.
Leading Players in the 5G Connected Device Industry Sector
- BBK Electronics Corporation
- Samsung Electronics Co Ltd
- Motorola Mobility LLC (Lenovo Group Limited)
- Cisco Systems Inc
- Xiaomi Corporation
- Keysight Technologies Inc
- Huawei Technologies Co Ltd
- ZTE Corporation
- Nokia Corporation
Key Milestones in 5G Connected Device Industry Industry
- September 2022: Nokia and Telia Finland launched one of the first commercial 5G standalone (SA) networks with network slicing for Fixed Wireless Access (FWA) services. This marked a significant step in delivering guaranteed service levels for home broadband.
- September 2022: ZTE Corporation and the Fujian Branch of China Mobile jointly launched the first trial of the 5G industrial comprehensive emulator and analyzer product. This initiative aims to accelerate the digital transformation of industry verticals through advanced 5G testing.
- July 2022: Samsung launched the Galaxy M13 5G in India, one of the most affordable 5G smartphones. Supporting 11 5G bands in India, this launch significantly expanded access to 5G technology for a broader consumer base.
Strategic Outlook for 5G Connected Device Industry Market
The strategic outlook for the 5G connected device industry is exceptionally promising, driven by the accelerating global adoption of 5G technology and the continuous innovation in device capabilities. Future growth will be fueled by the expansion of 5G SA networks, enabling advanced services like network slicing and ultra-reliable low-latency communication (URLLC) for critical applications. The sustained demand for high-performance 5G smartphones, coupled with the burgeoning market for 5G CPE and industrial-grade devices, will continue to drive revenue growth. Strategic opportunities lie in the development of specialized 5G modules for the expanding IoT ecosystem, the integration of AI and edge computing for smarter device functionalities, and the exploration of new markets unlocked by immersive technologies like AR/VR. Partnerships between device manufacturers, network operators, and software providers will be crucial for creating comprehensive 5G solutions and accelerating market penetration. The focus on affordability and accessibility will be key to unlocking the full potential of the global 5G market.
5G Connected Device Industry Segmentation
-
1. Form Factor
- 1.1. Modules
- 1.2. CPE (Indoor/Outdoor)
- 1.3. Smartphone
- 1.4. Hotspots
- 1.5. Laptops
- 1.6. Industrial Grade CPE/Router/Gateway
- 1.7. Other Form Factors
-
2. Spectrum Support
- 2.1. Sub-6 GHz
- 2.2. mmWave
- 2.3. Both Spectrum Bands
5G Connected Device Industry Segmentation By Geography
-
1. North America
- 1.1. United States
- 1.2. Canada
-
2. Europe
- 2.1. Germany
- 2.2. UK
- 2.3. France
- 2.4. Spain
- 2.5. Rest of Europe
-
3. Asia Pacific
- 3.1. China
- 3.2. Japan
- 3.3. India
- 3.4. Australia
- 3.5. Rest of Asia Pacific
-
4. Latin America
- 4.1. Brazil
- 4.2. Mexico
- 4.3. Argentina
- 4.4. Rest of Latin America
-
5. Middle East and Africa
- 5.1. UAE
- 5.2. Saudi Arabia
- 5.3. South Africa
- 5.4. Rest of Middle East and Africa
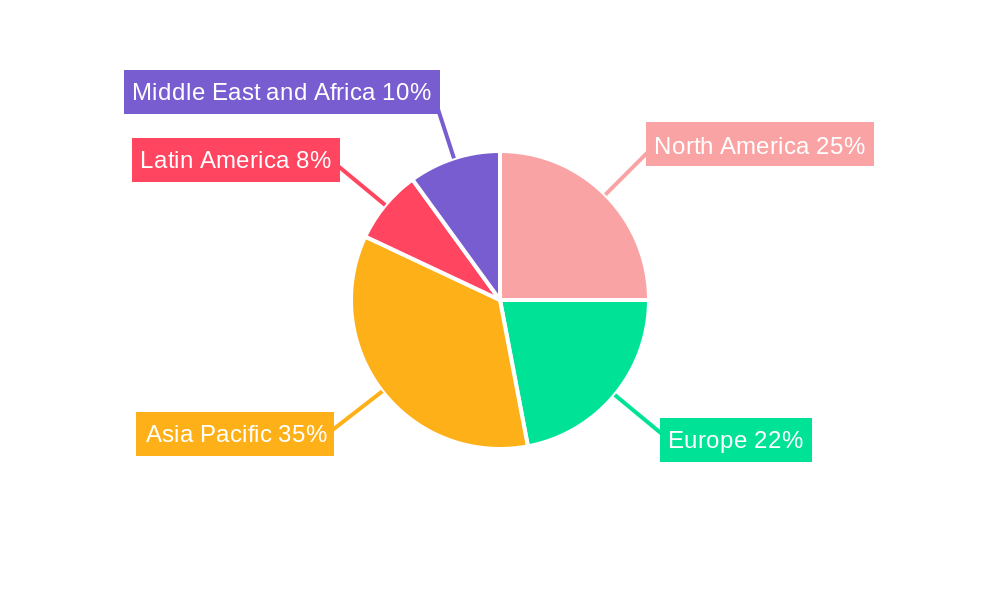
5G Connected Device Industry Regional Market Share
Geographic Coverage of 5G Connected Device Industry
5G Connected Device Industry REPORT HIGHLIGHTS
| Aspects | Details |
|---|---|
| Study Period | 2020-2034 |
| Base Year | 2025 |
| Estimated Year | 2026 |
| Forecast Period | 2026-2034 |
| Historical Period | 2020-2025 |
| Growth Rate | CAGR of 13.2% from 2020-2034 |
| Segmentation |
|
Table of Contents
- 1. Introduction
- 1.1. Research Scope
- 1.2. Market Segmentation
- 1.3. Research Objective
- 1.4. Definitions and Assumptions
- 2. Executive Summary
- 2.1. Market Snapshot
- 3. Market Dynamics
- 3.1. Market Drivers
- 3.2. Market Restrains
- 3.3. Market Trends
- 3.4. Market Opportunities
- 4. Market Factor Analysis
- 4.1. Porters Five Forces
- 4.1.1. Bargaining Power of Suppliers
- 4.1.2. Bargaining Power of Buyers
- 4.1.3. Threat of New Entrants
- 4.1.4. Threat of Substitutes
- 4.1.5. Competitive Rivalry
- 4.2. PESTEL analysis
- 4.3. BCG Analysis
- 4.3.1. Stars (High Growth, High Market Share)
- 4.3.2. Cash Cows (Low Growth, High Market Share)
- 4.3.3. Question Mark (High Growth, Low Market Share)
- 4.3.4. Dogs (Low Growth, Low Market Share)
- 4.4. Ansoff Matrix Analysis
- 4.5. Supply Chain Analysis
- 4.6. Regulatory Landscape
- 4.7. Current Market Potential and Opportunity Assessment (TAM–SAM–SOM Framework)
- 4.8. MSR Analyst Note
- 4.1. Porters Five Forces
- 5. Market Analysis, Insights and Forecast 2021-2033
- 5.1. Market Analysis, Insights and Forecast - by Form Factor
- 5.1.1. Modules
- 5.1.2. CPE (Indoor/Outdoor)
- 5.1.3. Smartphone
- 5.1.4. Hotspots
- 5.1.5. Laptops
- 5.1.6. Industrial Grade CPE/Router/Gateway
- 5.1.7. Other Form Factors
- 5.2. Market Analysis, Insights and Forecast - by Spectrum Support
- 5.2.1. Sub-6 GHz
- 5.2.2. mmWave
- 5.2.3. Both Spectrum Bands
- 5.3. Market Analysis, Insights and Forecast - by Region
- 5.3.1. North America
- 5.3.2. Europe
- 5.3.3. Asia Pacific
- 5.3.4. Latin America
- 5.3.5. Middle East and Africa
- 5.1. Market Analysis, Insights and Forecast - by Form Factor
- 6. Global 5G Connected Device Industry Analysis, Insights and Forecast, 2021-2033
- 6.1. Market Analysis, Insights and Forecast - by Form Factor
- 6.1.1. Modules
- 6.1.2. CPE (Indoor/Outdoor)
- 6.1.3. Smartphone
- 6.1.4. Hotspots
- 6.1.5. Laptops
- 6.1.6. Industrial Grade CPE/Router/Gateway
- 6.1.7. Other Form Factors
- 6.2. Market Analysis, Insights and Forecast - by Spectrum Support
- 6.2.1. Sub-6 GHz
- 6.2.2. mmWave
- 6.2.3. Both Spectrum Bands
- 6.1. Market Analysis, Insights and Forecast - by Form Factor
- 7. North America 5G Connected Device Industry Analysis, Insights and Forecast, 2020-2032
- 7.1. Market Analysis, Insights and Forecast - by Form Factor
- 7.1.1. Modules
- 7.1.2. CPE (Indoor/Outdoor)
- 7.1.3. Smartphone
- 7.1.4. Hotspots
- 7.1.5. Laptops
- 7.1.6. Industrial Grade CPE/Router/Gateway
- 7.1.7. Other Form Factors
- 7.2. Market Analysis, Insights and Forecast - by Spectrum Support
- 7.2.1. Sub-6 GHz
- 7.2.2. mmWave
- 7.2.3. Both Spectrum Bands
- 7.1. Market Analysis, Insights and Forecast - by Form Factor
- 8. Europe 5G Connected Device Industry Analysis, Insights and Forecast, 2020-2032
- 8.1. Market Analysis, Insights and Forecast - by Form Factor
- 8.1.1. Modules
- 8.1.2. CPE (Indoor/Outdoor)
- 8.1.3. Smartphone
- 8.1.4. Hotspots
- 8.1.5. Laptops
- 8.1.6. Industrial Grade CPE/Router/Gateway
- 8.1.7. Other Form Factors
- 8.2. Market Analysis, Insights and Forecast - by Spectrum Support
- 8.2.1. Sub-6 GHz
- 8.2.2. mmWave
- 8.2.3. Both Spectrum Bands
- 8.1. Market Analysis, Insights and Forecast - by Form Factor
- 9. Asia Pacific 5G Connected Device Industry Analysis, Insights and Forecast, 2020-2032
- 9.1. Market Analysis, Insights and Forecast - by Form Factor
- 9.1.1. Modules
- 9.1.2. CPE (Indoor/Outdoor)
- 9.1.3. Smartphone
- 9.1.4. Hotspots
- 9.1.5. Laptops
- 9.1.6. Industrial Grade CPE/Router/Gateway
- 9.1.7. Other Form Factors
- 9.2. Market Analysis, Insights and Forecast - by Spectrum Support
- 9.2.1. Sub-6 GHz
- 9.2.2. mmWave
- 9.2.3. Both Spectrum Bands
- 9.1. Market Analysis, Insights and Forecast - by Form Factor
- 10. Latin America 5G Connected Device Industry Analysis, Insights and Forecast, 2020-2032
- 10.1. Market Analysis, Insights and Forecast - by Form Factor
- 10.1.1. Modules
- 10.1.2. CPE (Indoor/Outdoor)
- 10.1.3. Smartphone
- 10.1.4. Hotspots
- 10.1.5. Laptops
- 10.1.6. Industrial Grade CPE/Router/Gateway
- 10.1.7. Other Form Factors
- 10.2. Market Analysis, Insights and Forecast - by Spectrum Support
- 10.2.1. Sub-6 GHz
- 10.2.2. mmWave
- 10.2.3. Both Spectrum Bands
- 10.1. Market Analysis, Insights and Forecast - by Form Factor
- 11. Middle East and Africa 5G Connected Device Industry Analysis, Insights and Forecast, 2020-2032
- 11.1. Market Analysis, Insights and Forecast - by Form Factor
- 11.1.1. Modules
- 11.1.2. CPE (Indoor/Outdoor)
- 11.1.3. Smartphone
- 11.1.4. Hotspots
- 11.1.5. Laptops
- 11.1.6. Industrial Grade CPE/Router/Gateway
- 11.1.7. Other Form Factors
- 11.2. Market Analysis, Insights and Forecast - by Spectrum Support
- 11.2.1. Sub-6 GHz
- 11.2.2. mmWave
- 11.2.3. Both Spectrum Bands
- 11.1. Market Analysis, Insights and Forecast - by Form Factor
- 12. Competitive Analysis
- 12.1. Company Profiles
- 12.1.1 BBK Electronics Corporation
- 12.1.1.1. Company Overview
- 12.1.1.2. Products
- 12.1.1.3. Company Financials
- 12.1.1.4. SWOT Analysis
- 12.1.2 Samsung Electronics Co Ltd
- 12.1.2.1. Company Overview
- 12.1.2.2. Products
- 12.1.2.3. Company Financials
- 12.1.2.4. SWOT Analysis
- 12.1.3 Motorola Mobility LLC (Lenovo Group Limited)
- 12.1.3.1. Company Overview
- 12.1.3.2. Products
- 12.1.3.3. Company Financials
- 12.1.3.4. SWOT Analysis
- 12.1.4 Cisco Systems Inc
- 12.1.4.1. Company Overview
- 12.1.4.2. Products
- 12.1.4.3. Company Financials
- 12.1.4.4. SWOT Analysis
- 12.1.5 Xiaomi Corporation
- 12.1.5.1. Company Overview
- 12.1.5.2. Products
- 12.1.5.3. Company Financials
- 12.1.5.4. SWOT Analysis
- 12.1.6 Keysight Technologies Inc *List Not Exhaustive
- 12.1.6.1. Company Overview
- 12.1.6.2. Products
- 12.1.6.3. Company Financials
- 12.1.6.4. SWOT Analysis
- 12.1.7 Huawei Technologies Co Ltd
- 12.1.7.1. Company Overview
- 12.1.7.2. Products
- 12.1.7.3. Company Financials
- 12.1.7.4. SWOT Analysis
- 12.1.8 ZTE Corporation
- 12.1.8.1. Company Overview
- 12.1.8.2. Products
- 12.1.8.3. Company Financials
- 12.1.8.4. SWOT Analysis
- 12.1.9 Nokia Corporation
- 12.1.9.1. Company Overview
- 12.1.9.2. Products
- 12.1.9.3. Company Financials
- 12.1.9.4. SWOT Analysis
- 12.1.1 BBK Electronics Corporation
- 12.2. Market Entropy
- 12.2.1 Company's Key Areas Served
- 12.2.2 Recent Developments
- 12.3. Company Market Share Analysis 2025
- 12.3.1 Top 5 Companies Market Share Analysis
- 12.3.2 Top 3 Companies Market Share Analysis
- 12.4. List of Potential Customers
- 13. Research Methodology
List of Figures
- Figure 1: Global 5G Connected Device Industry Revenue Breakdown (billion, %) by Region 2025 & 2033
- Figure 2: Global 5G Connected Device Industry Volume Breakdown (Billion, %) by Region 2025 & 2033
- Figure 3: North America 5G Connected Device Industry Revenue (billion), by Form Factor 2025 & 2033
- Figure 4: North America 5G Connected Device Industry Volume (Billion), by Form Factor 2025 & 2033
- Figure 5: North America 5G Connected Device Industry Revenue Share (%), by Form Factor 2025 & 2033
- Figure 6: North America 5G Connected Device Industry Volume Share (%), by Form Factor 2025 & 2033
- Figure 7: North America 5G Connected Device Industry Revenue (billion), by Spectrum Support 2025 & 2033
- Figure 8: North America 5G Connected Device Industry Volume (Billion), by Spectrum Support 2025 & 2033
- Figure 9: North America 5G Connected Device Industry Revenue Share (%), by Spectrum Support 2025 & 2033
- Figure 10: North America 5G Connected Device Industry Volume Share (%), by Spectrum Support 2025 & 2033
- Figure 11: North America 5G Connected Device Industry Revenue (billion), by Country 2025 & 2033
- Figure 12: North America 5G Connected Device Industry Volume (Billion), by Country 2025 & 2033
- Figure 13: North America 5G Connected Device Industry Revenue Share (%), by Country 2025 & 2033
- Figure 14: North America 5G Connected Device Industry Volume Share (%), by Country 2025 & 2033
- Figure 15: Europe 5G Connected Device Industry Revenue (billion), by Form Factor 2025 & 2033
- Figure 16: Europe 5G Connected Device Industry Volume (Billion), by Form Factor 2025 & 2033
- Figure 17: Europe 5G Connected Device Industry Revenue Share (%), by Form Factor 2025 & 2033
- Figure 18: Europe 5G Connected Device Industry Volume Share (%), by Form Factor 2025 & 2033
- Figure 19: Europe 5G Connected Device Industry Revenue (billion), by Spectrum Support 2025 & 2033
- Figure 20: Europe 5G Connected Device Industry Volume (Billion), by Spectrum Support 2025 & 2033
- Figure 21: Europe 5G Connected Device Industry Revenue Share (%), by Spectrum Support 2025 & 2033
- Figure 22: Europe 5G Connected Device Industry Volume Share (%), by Spectrum Support 2025 & 2033
- Figure 23: Europe 5G Connected Device Industry Revenue (billion), by Country 2025 & 2033
- Figure 24: Europe 5G Connected Device Industry Volume (Billion), by Country 2025 & 2033
- Figure 25: Europe 5G Connected Device Industry Revenue Share (%), by Country 2025 & 2033
- Figure 26: Europe 5G Connected Device Industry Volume Share (%), by Country 2025 & 2033
- Figure 27: Asia Pacific 5G Connected Device Industry Revenue (billion), by Form Factor 2025 & 2033
- Figure 28: Asia Pacific 5G Connected Device Industry Volume (Billion), by Form Factor 2025 & 2033
- Figure 29: Asia Pacific 5G Connected Device Industry Revenue Share (%), by Form Factor 2025 & 2033
- Figure 30: Asia Pacific 5G Connected Device Industry Volume Share (%), by Form Factor 2025 & 2033
- Figure 31: Asia Pacific 5G Connected Device Industry Revenue (billion), by Spectrum Support 2025 & 2033
- Figure 32: Asia Pacific 5G Connected Device Industry Volume (Billion), by Spectrum Support 2025 & 2033
- Figure 33: Asia Pacific 5G Connected Device Industry Revenue Share (%), by Spectrum Support 2025 & 2033
- Figure 34: Asia Pacific 5G Connected Device Industry Volume Share (%), by Spectrum Support 2025 & 2033
- Figure 35: Asia Pacific 5G Connected Device Industry Revenue (billion), by Country 2025 & 2033
- Figure 36: Asia Pacific 5G Connected Device Industry Volume (Billion), by Country 2025 & 2033
- Figure 37: Asia Pacific 5G Connected Device Industry Revenue Share (%), by Country 2025 & 2033
- Figure 38: Asia Pacific 5G Connected Device Industry Volume Share (%), by Country 2025 & 2033
- Figure 39: Latin America 5G Connected Device Industry Revenue (billion), by Form Factor 2025 & 2033
- Figure 40: Latin America 5G Connected Device Industry Volume (Billion), by Form Factor 2025 & 2033
- Figure 41: Latin America 5G Connected Device Industry Revenue Share (%), by Form Factor 2025 & 2033
- Figure 42: Latin America 5G Connected Device Industry Volume Share (%), by Form Factor 2025 & 2033
- Figure 43: Latin America 5G Connected Device Industry Revenue (billion), by Spectrum Support 2025 & 2033
- Figure 44: Latin America 5G Connected Device Industry Volume (Billion), by Spectrum Support 2025 & 2033
- Figure 45: Latin America 5G Connected Device Industry Revenue Share (%), by Spectrum Support 2025 & 2033
- Figure 46: Latin America 5G Connected Device Industry Volume Share (%), by Spectrum Support 2025 & 2033
- Figure 47: Latin America 5G Connected Device Industry Revenue (billion), by Country 2025 & 2033
- Figure 48: Latin America 5G Connected Device Industry Volume (Billion), by Country 2025 & 2033
- Figure 49: Latin America 5G Connected Device Industry Revenue Share (%), by Country 2025 & 2033
- Figure 50: Latin America 5G Connected Device Industry Volume Share (%), by Country 2025 & 2033
- Figure 51: Middle East and Africa 5G Connected Device Industry Revenue (billion), by Form Factor 2025 & 2033
- Figure 52: Middle East and Africa 5G Connected Device Industry Volume (Billion), by Form Factor 2025 & 2033
- Figure 53: Middle East and Africa 5G Connected Device Industry Revenue Share (%), by Form Factor 2025 & 2033
- Figure 54: Middle East and Africa 5G Connected Device Industry Volume Share (%), by Form Factor 2025 & 2033
- Figure 55: Middle East and Africa 5G Connected Device Industry Revenue (billion), by Spectrum Support 2025 & 2033
- Figure 56: Middle East and Africa 5G Connected Device Industry Volume (Billion), by Spectrum Support 2025 & 2033
- Figure 57: Middle East and Africa 5G Connected Device Industry Revenue Share (%), by Spectrum Support 2025 & 2033
- Figure 58: Middle East and Africa 5G Connected Device Industry Volume Share (%), by Spectrum Support 2025 & 2033
- Figure 59: Middle East and Africa 5G Connected Device Industry Revenue (billion), by Country 2025 & 2033
- Figure 60: Middle East and Africa 5G Connected Device Industry Volume (Billion), by Country 2025 & 2033
- Figure 61: Middle East and Africa 5G Connected Device Industry Revenue Share (%), by Country 2025 & 2033
- Figure 62: Middle East and Africa 5G Connected Device Industry Volume Share (%), by Country 2025 & 2033
List of Tables
- Table 1: Global 5G Connected Device Industry Revenue billion Forecast, by Form Factor 2020 & 2033
- Table 2: Global 5G Connected Device Industry Volume Billion Forecast, by Form Factor 2020 & 2033
- Table 3: Global 5G Connected Device Industry Revenue billion Forecast, by Spectrum Support 2020 & 2033
- Table 4: Global 5G Connected Device Industry Volume Billion Forecast, by Spectrum Support 2020 & 2033
- Table 5: Global 5G Connected Device Industry Revenue billion Forecast, by Region 2020 & 2033
- Table 6: Global 5G Connected Device Industry Volume Billion Forecast, by Region 2020 & 2033
- Table 7: Global 5G Connected Device Industry Revenue billion Forecast, by Form Factor 2020 & 2033
- Table 8: Global 5G Connected Device Industry Volume Billion Forecast, by Form Factor 2020 & 2033
- Table 9: Global 5G Connected Device Industry Revenue billion Forecast, by Spectrum Support 2020 & 2033
- Table 10: Global 5G Connected Device Industry Volume Billion Forecast, by Spectrum Support 2020 & 2033
- Table 11: Global 5G Connected Device Industry Revenue billion Forecast, by Country 2020 & 2033
- Table 12: Global 5G Connected Device Industry Volume Billion Forecast, by Country 2020 & 2033
- Table 13: United States 5G Connected Device Industry Revenue (billion) Forecast, by Application 2020 & 2033
- Table 14: United States 5G Connected Device Industry Volume (Billion) Forecast, by Application 2020 & 2033
- Table 15: Canada 5G Connected Device Industry Revenue (billion) Forecast, by Application 2020 & 2033
- Table 16: Canada 5G Connected Device Industry Volume (Billion) Forecast, by Application 2020 & 2033
- Table 17: Global 5G Connected Device Industry Revenue billion Forecast, by Form Factor 2020 & 2033
- Table 18: Global 5G Connected Device Industry Volume Billion Forecast, by Form Factor 2020 & 2033
- Table 19: Global 5G Connected Device Industry Revenue billion Forecast, by Spectrum Support 2020 & 2033
- Table 20: Global 5G Connected Device Industry Volume Billion Forecast, by Spectrum Support 2020 & 2033
- Table 21: Global 5G Connected Device Industry Revenue billion Forecast, by Country 2020 & 2033
- Table 22: Global 5G Connected Device Industry Volume Billion Forecast, by Country 2020 & 2033
- Table 23: Germany 5G Connected Device Industry Revenue (billion) Forecast, by Application 2020 & 2033
- Table 24: Germany 5G Connected Device Industry Volume (Billion) Forecast, by Application 2020 & 2033
- Table 25: UK 5G Connected Device Industry Revenue (billion) Forecast, by Application 2020 & 2033
- Table 26: UK 5G Connected Device Industry Volume (Billion) Forecast, by Application 2020 & 2033
- Table 27: France 5G Connected Device Industry Revenue (billion) Forecast, by Application 2020 & 2033
- Table 28: France 5G Connected Device Industry Volume (Billion) Forecast, by Application 2020 & 2033
- Table 29: Spain 5G Connected Device Industry Revenue (billion) Forecast, by Application 2020 & 2033
- Table 30: Spain 5G Connected Device Industry Volume (Billion) Forecast, by Application 2020 & 2033
- Table 31: Rest of Europe 5G Connected Device Industry Revenue (billion) Forecast, by Application 2020 & 2033
- Table 32: Rest of Europe 5G Connected Device Industry Volume (Billion) Forecast, by Application 2020 & 2033
- Table 33: Global 5G Connected Device Industry Revenue billion Forecast, by Form Factor 2020 & 2033
- Table 34: Global 5G Connected Device Industry Volume Billion Forecast, by Form Factor 2020 & 2033
- Table 35: Global 5G Connected Device Industry Revenue billion Forecast, by Spectrum Support 2020 & 2033
- Table 36: Global 5G Connected Device Industry Volume Billion Forecast, by Spectrum Support 2020 & 2033
- Table 37: Global 5G Connected Device Industry Revenue billion Forecast, by Country 2020 & 2033
- Table 38: Global 5G Connected Device Industry Volume Billion Forecast, by Country 2020 & 2033
- Table 39: China 5G Connected Device Industry Revenue (billion) Forecast, by Application 2020 & 2033
- Table 40: China 5G Connected Device Industry Volume (Billion) Forecast, by Application 2020 & 2033
- Table 41: Japan 5G Connected Device Industry Revenue (billion) Forecast, by Application 2020 & 2033
- Table 42: Japan 5G Connected Device Industry Volume (Billion) Forecast, by Application 2020 & 2033
- Table 43: India 5G Connected Device Industry Revenue (billion) Forecast, by Application 2020 & 2033
- Table 44: India 5G Connected Device Industry Volume (Billion) Forecast, by Application 2020 & 2033
- Table 45: Australia 5G Connected Device Industry Revenue (billion) Forecast, by Application 2020 & 2033
- Table 46: Australia 5G Connected Device Industry Volume (Billion) Forecast, by Application 2020 & 2033
- Table 47: Rest of Asia Pacific 5G Connected Device Industry Revenue (billion) Forecast, by Application 2020 & 2033
- Table 48: Rest of Asia Pacific 5G Connected Device Industry Volume (Billion) Forecast, by Application 2020 & 2033
- Table 49: Global 5G Connected Device Industry Revenue billion Forecast, by Form Factor 2020 & 2033
- Table 50: Global 5G Connected Device Industry Volume Billion Forecast, by Form Factor 2020 & 2033
- Table 51: Global 5G Connected Device Industry Revenue billion Forecast, by Spectrum Support 2020 & 2033
- Table 52: Global 5G Connected Device Industry Volume Billion Forecast, by Spectrum Support 2020 & 2033
- Table 53: Global 5G Connected Device Industry Revenue billion Forecast, by Country 2020 & 2033
- Table 54: Global 5G Connected Device Industry Volume Billion Forecast, by Country 2020 & 2033
- Table 55: Brazil 5G Connected Device Industry Revenue (billion) Forecast, by Application 2020 & 2033
- Table 56: Brazil 5G Connected Device Industry Volume (Billion) Forecast, by Application 2020 & 2033
- Table 57: Mexico 5G Connected Device Industry Revenue (billion) Forecast, by Application 2020 & 2033
- Table 58: Mexico 5G Connected Device Industry Volume (Billion) Forecast, by Application 2020 & 2033
- Table 59: Argentina 5G Connected Device Industry Revenue (billion) Forecast, by Application 2020 & 2033
- Table 60: Argentina 5G Connected Device Industry Volume (Billion) Forecast, by Application 2020 & 2033
- Table 61: Rest of Latin America 5G Connected Device Industry Revenue (billion) Forecast, by Application 2020 & 2033
- Table 62: Rest of Latin America 5G Connected Device Industry Volume (Billion) Forecast, by Application 2020 & 2033
- Table 63: Global 5G Connected Device Industry Revenue billion Forecast, by Form Factor 2020 & 2033
- Table 64: Global 5G Connected Device Industry Volume Billion Forecast, by Form Factor 2020 & 2033
- Table 65: Global 5G Connected Device Industry Revenue billion Forecast, by Spectrum Support 2020 & 2033
- Table 66: Global 5G Connected Device Industry Volume Billion Forecast, by Spectrum Support 2020 & 2033
- Table 67: Global 5G Connected Device Industry Revenue billion Forecast, by Country 2020 & 2033
- Table 68: Global 5G Connected Device Industry Volume Billion Forecast, by Country 2020 & 2033
- Table 69: UAE 5G Connected Device Industry Revenue (billion) Forecast, by Application 2020 & 2033
- Table 70: UAE 5G Connected Device Industry Volume (Billion) Forecast, by Application 2020 & 2033
- Table 71: Saudi Arabia 5G Connected Device Industry Revenue (billion) Forecast, by Application 2020 & 2033
- Table 72: Saudi Arabia 5G Connected Device Industry Volume (Billion) Forecast, by Application 2020 & 2033
- Table 73: South Africa 5G Connected Device Industry Revenue (billion) Forecast, by Application 2020 & 2033
- Table 74: South Africa 5G Connected Device Industry Volume (Billion) Forecast, by Application 2020 & 2033
- Table 75: Rest of Middle East and Africa 5G Connected Device Industry Revenue (billion) Forecast, by Application 2020 & 2033
- Table 76: Rest of Middle East and Africa 5G Connected Device Industry Volume (Billion) Forecast, by Application 2020 & 2033
Frequently Asked Questions
1. What is the projected Compound Annual Growth Rate (CAGR) of the 5G Connected Device Industry?
The projected CAGR is approximately 13.2%.
2. Which companies are prominent players in the 5G Connected Device Industry?
Key companies in the market include BBK Electronics Corporation, Samsung Electronics Co Ltd, Motorola Mobility LLC (Lenovo Group Limited), Cisco Systems Inc, Xiaomi Corporation, Keysight Technologies Inc *List Not Exhaustive, Huawei Technologies Co Ltd, ZTE Corporation, Nokia Corporation.
3. What are the main segments of the 5G Connected Device Industry?
The market segments include Form Factor, Spectrum Support.
4. Can you provide details about the market size?
The market size is estimated to be USD 21.1 billion as of 2022.
5. What are some drivers contributing to market growth?
Sustained Increase in Number of Devices and Endpoints Worldwide; Technological Innovations at a Component and Device Level to Aid Adoption; Increasing use of Smart Phones and rising Technological advancement in the smart phones is expected to drive market..
6. What are the notable trends driving market growth?
Smartphone Segment is Expected to Witness the Highest Growth.
7. Are there any restraints impacting market growth?
Regulatory and Standardization Delays; Design and Operational Challenges.
8. Can you provide examples of recent developments in the market?
September 2022 - Nokia and Telia Finland launched one of the first commercial 5G standalone (SA) networks with network slicing for Fixed Wireless Access (FWA) services. Telia would introduce 5G SA to its 5G Fixed Wireless Access (FWA) home broadband services and be able to start offering a range of broadband deals with guaranteed service levels to its customers in Finland. The solutions would enable Telia to build on its existing position, delivering enhanced connectivity and capacity benefits to its customers through ongoing deployment.
9. What pricing options are available for accessing the report?
Pricing options include single-user, multi-user, and enterprise licenses priced at USD 4750, USD 5250, and USD 8750 respectively.
10. Is the market size provided in terms of value or volume?
The market size is provided in terms of value, measured in billion and volume, measured in Billion.
11. Are there any specific market keywords associated with the report?
Yes, the market keyword associated with the report is "5G Connected Device Industry," which aids in identifying and referencing the specific market segment covered.
12. How do I determine which pricing option suits my needs best?
The pricing options vary based on user requirements and access needs. Individual users may opt for single-user licenses, while businesses requiring broader access may choose multi-user or enterprise licenses for cost-effective access to the report.
13. Are there any additional resources or data provided in the 5G Connected Device Industry report?
While the report offers comprehensive insights, it's advisable to review the specific contents or supplementary materials provided to ascertain if additional resources or data are available.
14. How can I stay updated on further developments or reports in the 5G Connected Device Industry?
To stay informed about further developments, trends, and reports in the 5G Connected Device Industry, consider subscribing to industry newsletters, following relevant companies and organizations, or regularly checking reputable industry news sources and publications.
Methodology
Step 1 - Identification of Relevant Samples Size from Population Database


Step 2 - Approaches for Defining Global Market Size (Value, Volume* & Price*)

Note*: In applicable scenarios
Step 3 - Data Sources
Primary Research
- Web Analytics
- Survey Reports
- Research Institute
- Latest Research Reports
- Opinion Leaders
Secondary Research
- Annual Reports
- White Paper
- Latest Press Release
- Industry Association
- Paid Database
- Investor Presentations

Step 4 - Data Triangulation
Involves using different sources of information in order to increase the validity of a study
These sources are likely to be stakeholders in a program - participants, other researchers, program staff, other community members, and so on.
Then we put all data in single framework & apply various statistical tools to find out the dynamic on the market.
During the analysis stage, feedback from the stakeholder groups would be compared to determine areas of agreement as well as areas of divergence