
Key Insights
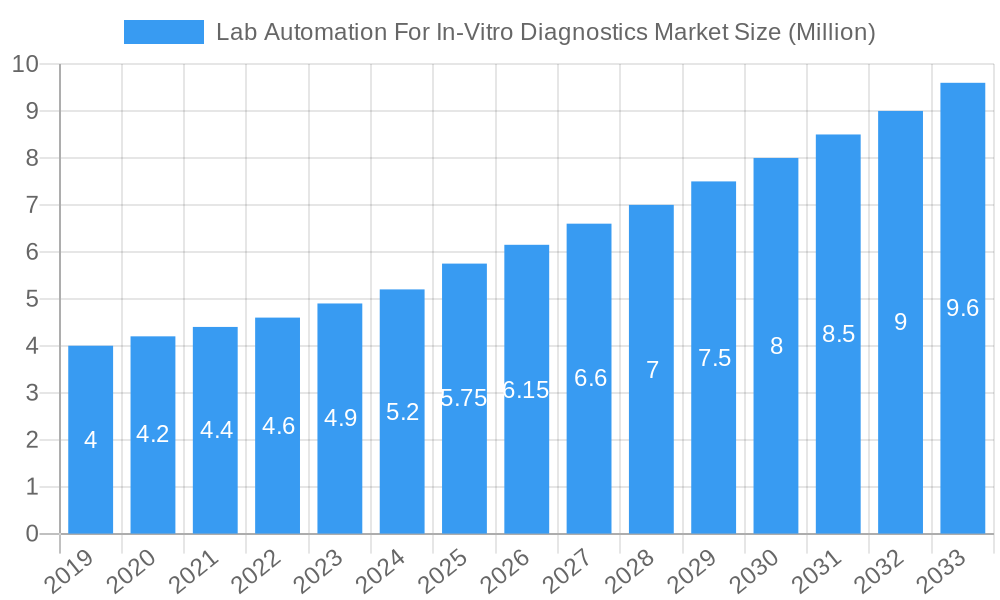
The global market for Lab Automation for In-Vitro Diagnostics is poised for significant expansion, projected to reach a substantial valuation of USD 5.75 billion by 2025. This growth is underpinned by a robust Compound Annual Growth Rate (CAGR) of 6.30%, indicating a dynamic and expanding industry. The increasing demand for precision, efficiency, and throughput in diagnostic processes is a primary catalyst. Advancements in robotics, artificial intelligence, and machine learning are transforming laboratory workflows, enabling faster and more accurate disease detection and patient monitoring. Key drivers include the escalating prevalence of chronic diseases, the growing need for personalized medicine, and the continuous development of novel diagnostic assays. Furthermore, the pressure to reduce laboratory operational costs and minimize human error is propelling the adoption of automated solutions. The market's trajectory is also influenced by significant investments in research and development by leading companies and the increasing regulatory emphasis on quality control and standardization in diagnostics.
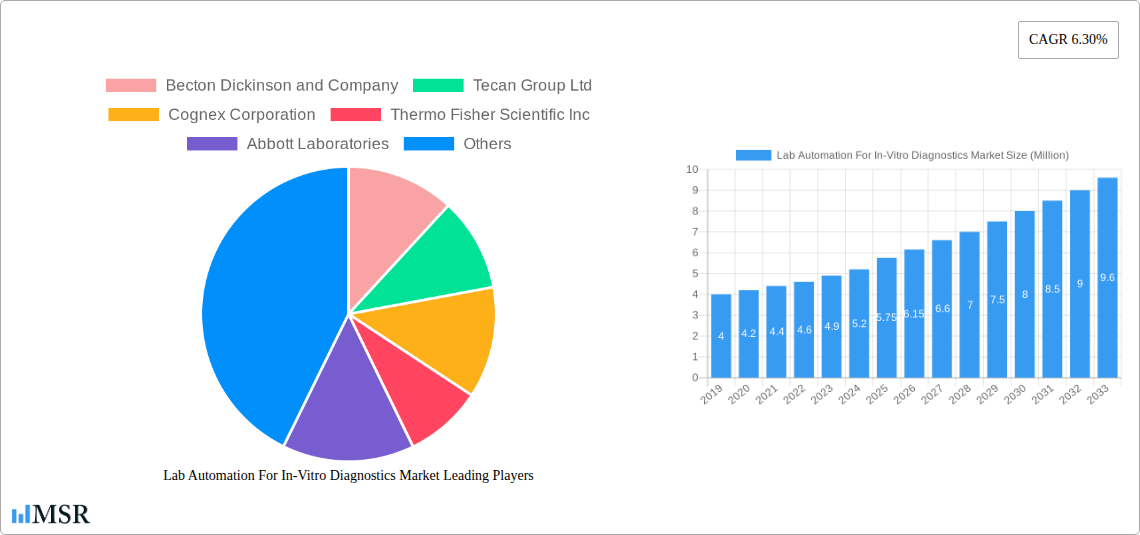
Lab Automation For In-Vitro Diagnostics Market Market Size (In Million)
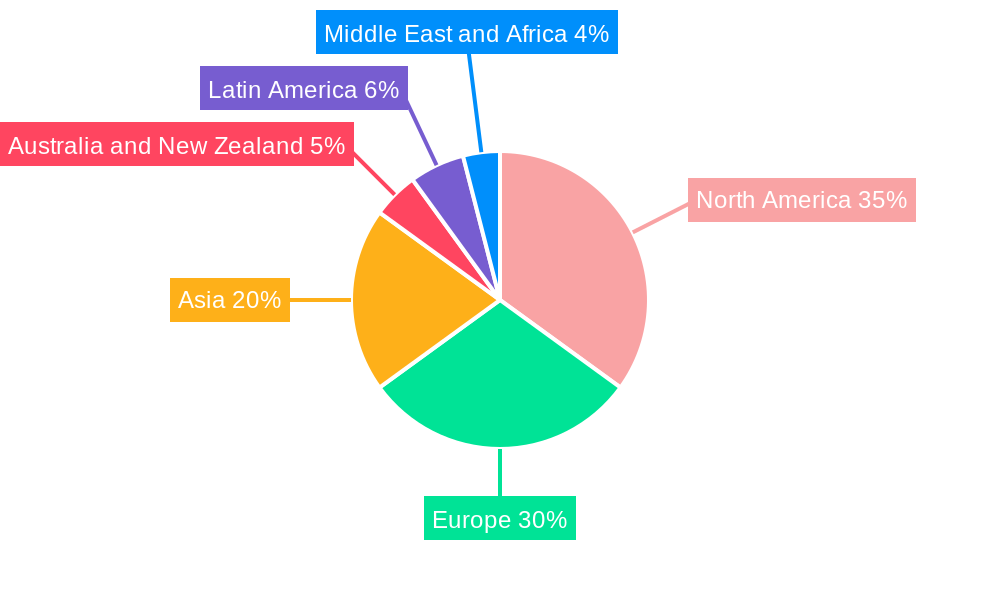
The market is segmented into various crucial components, including Automated Plate Handlers, Automated Liquid Handlers, Robotic Arms, Automated Storage and Retrieval Systems, and Analyzers, catering to diverse end-user needs in Academic institutions, Laboratories, and other specialized sectors. These segments collectively contribute to the comprehensive automation of in-vitro diagnostic processes. Geographically, while North America and Europe are expected to remain dominant regions due to advanced healthcare infrastructure and high R&D spending, the Asia-Pacific region is anticipated to witness the fastest growth, driven by increasing healthcare expenditure, a rising patient population, and a growing adoption of advanced technologies. Restraints such as the high initial investment cost for sophisticated automation systems and the need for skilled personnel to operate and maintain them are present, but are increasingly being offset by the long-term benefits of improved efficiency and reduced operational expenses. The competitive landscape is characterized by the presence of established global players, suggesting a mature yet innovative market environment.
Lab Automation For In-Vitro Diagnostics Market Company Market Share
Unlock critical insights into the rapidly expanding lab automation for in-vitro diagnostics (IVD) market. This definitive report, covering the study period 2019–2033 with a base year of 2025, provides an in-depth analysis of market dynamics, emerging trends, and strategic opportunities. Dive deep into the global IVD automation market size, CAGR, and key drivers shaping the future of laboratory automation solutions, diagnostic workflow optimization, and high-throughput screening in clinical settings. Essential for IVD manufacturers, diagnostic laboratories, academic institutions, and investment firms seeking to capitalize on this high-growth sector.
Lab Automation For In-Vitro Diagnostics Market Market Concentration & Dynamics
The lab automation for in-vitro diagnostics market exhibits a moderate to high concentration, with key players like Thermo Fisher Scientific Inc, Roche Holding AG, Abbott Laboratories, and Siemens Healthineers AG dominating a significant portion of the market share. This concentration is driven by substantial R&D investments, extensive product portfolios, and established distribution networks. Innovation ecosystems are robust, fueled by ongoing advancements in robotics, AI, and data analytics to enhance diagnostic accuracy and efficiency. Regulatory frameworks, while ensuring quality and safety, also present a barrier to entry for new players. Substitute products, such as manual testing methods, are gradually being phased out due to the overwhelming benefits of automation. End-user trends indicate a growing demand for integrated solutions that streamline entire laboratory workflows, from sample accessioning to result reporting. Mergers and acquisitions (M&A) activities are prevalent as larger companies seek to expand their technological capabilities and market reach. For instance, the market has witnessed several strategic acquisitions aimed at consolidating market share and acquiring innovative technologies, with an estimated M&A deal count of XX during the historical period.
Lab Automation For In-Vitro Diagnostics Market Industry Insights & Trends
The lab automation for in-vitro diagnostics market is experiencing robust growth, propelled by an increasing demand for faster, more accurate, and cost-effective diagnostic testing. The global IVD automation market size is projected to reach USD XX Billion by 2025 and is anticipated to grow at a significant CAGR of XX% from 2025 to 2033. Key growth drivers include the rising prevalence of chronic diseases, the aging global population, and the continuous need for early disease detection. Technological disruptions, such as the integration of Artificial Intelligence (AI) and Machine Learning (ML) in diagnostic platforms, are revolutionizing analytical capabilities, enabling predictive diagnostics and personalized medicine. Evolving consumer behaviors, characterized by a growing preference for convenient and accessible healthcare, are also pushing laboratories towards automation to handle increased testing volumes and reduce turnaround times. The shift towards molecular diagnostics and liquid biopsy techniques further necessitates advanced automation solutions for sample preparation and analysis. Moreover, government initiatives promoting laboratory modernization and the adoption of advanced medical technologies are creating a favorable market landscape.
Key Markets & Segments Leading Lab Automation For In-Vitro Diagnostics Market
The North America region, particularly the United States, is a leading market for lab automation for in-vitro diagnostics, driven by substantial healthcare expenditure, advanced technological adoption, and a high prevalence of chronic diseases. Within the Equipment segment, Automated Liquid Handlers and Analyzers are experiencing the highest demand, owing to their critical role in high-throughput testing and sample processing for a wide range of diagnostic assays. The Laboratory end-user segment holds the largest market share, as clinical diagnostic laboratories are at the forefront of adopting automation to improve efficiency, reduce errors, and manage increasing test volumes.
Drivers for North American Dominance:
- High healthcare spending and reimbursement policies.
- Early adoption of advanced automation technologies.
- Presence of major IVD manufacturers and research institutions.
- Stringent regulatory requirements that promote automated quality control.
Dominance of Automated Liquid Handlers and Analyzers:
- These instruments are fundamental to most IVD workflows, enabling precise and rapid dispensing of reagents and analysis of samples across various disciplines like clinical chemistry, immunoassay, and molecular diagnostics.
- Innovations in microfluidics and sensor technology are continuously enhancing the capabilities of these devices, making them indispensable for modern laboratories.
Leading Role of Laboratories as End Users:
- Clinical diagnostic laboratories, including central labs and point-of-care facilities, are the primary adopters of lab automation to meet the demands of routine testing, specialized diagnostics, and emergency situations.
- The increasing complexity of diagnostic tests and the need for greater throughput are driving significant investment in automated solutions by these entities.
Lab Automation For In-Vitro Diagnostics Market Product Developments
Product developments in the lab automation for in-vitro diagnostics market are focused on enhancing modularity, intelligence, and integration. Innovations include sophisticated robotic arms with improved dexterity for complex sample handling, advanced automated storage and retrieval systems (ASRS) for efficient sample management, and integrated analyzers capable of performing multiple tests simultaneously. The launch of the cobas connection modules (CCM) Vertical by Roche exemplifies this trend, offering modularity to optimize laboratory space and productivity. These advancements are crucial for improving diagnostic turnaround times, reducing human error, and enabling laboratories to handle a greater volume and variety of tests with greater accuracy.
Challenges in the Lab Automation For In-Vitro Diagnostics Market Market
Despite its robust growth, the lab automation for in-vitro diagnostics market faces several challenges. The high initial investment cost for sophisticated automation systems can be a significant barrier, particularly for smaller laboratories and those in emerging economies. Stringent regulatory compliance and the need for validation of automated processes add to the complexity and cost of implementation. Furthermore, a shortage of skilled personnel to operate and maintain these advanced systems can hinder adoption. Supply chain disruptions and the need for consistent availability of reagents and consumables also pose a risk. The estimated impact of these challenges on market growth is approximately XX%.
Forces Driving Lab Automation For In-Vitro Diagnostics Market Growth
Several key forces are propelling the lab automation for in-vitro diagnostics market forward. The escalating global burden of infectious diseases and chronic conditions necessitates rapid and accurate diagnostic testing, which automation effectively addresses. Advancements in robotics, AI, and software integration are continuously improving the speed, precision, and capabilities of automation systems. The growing emphasis on personalized medicine and the demand for early disease detection further fuel the need for high-throughput, accurate diagnostic workflows. Government initiatives promoting healthcare infrastructure development and the increasing focus on improving laboratory efficiency and reducing healthcare costs are also significant growth accelerators.
Challenges in the Lab Automation For In-Vitro Diagnostics Market Market
Long-term growth catalysts for the lab automation for in-vitro diagnostics market are deeply rooted in continuous technological innovation and strategic market expansion. The development of more intelligent and adaptive automation systems, capable of real-time data analysis and self-correction, will be crucial. Partnerships between technology providers and diagnostic assay developers will foster greater integration and workflow optimization. Expanding into underserved geographical markets and tailoring solutions to meet the specific needs of diverse laboratory settings, from high-volume hospitals to decentralized point-of-care facilities, will unlock significant future growth potential. The integration of lab automation with broader healthcare IT ecosystems, such as Electronic Health Records (EHRs), will further enhance its value proposition.
Emerging Opportunities in Lab Automation For In-Vitro Diagnostics Market
Emerging opportunities in the lab automation for in-vitro diagnostics market lie in the burgeoning fields of artificial intelligence-driven diagnostics, personalized medicine, and decentralized testing. The development of AI-powered algorithms to interpret complex diagnostic data generated by automated systems presents a significant opportunity. The growing demand for companion diagnostics and advanced molecular testing for targeted therapies creates a need for highly specialized automation. Furthermore, the expansion of point-of-care testing (POCT) solutions, enabled by miniaturized and automated platforms, offers a vast untapped market. The increasing focus on population health management and the use of big data analytics in diagnostics also present new avenues for growth and innovation in lab automation.
Leading Players in the Lab Automation For In-Vitro Diagnostics Market Sector
- Becton Dickinson and Company
- Tecan Group Ltd
- Cognex Corporation
- Thermo Fisher Scientific Inc
- Abbott Laboratories
- Danaher Corporation
- Siemens Healthineers AG
- Agilent Technologies Inc
- PerkinElmer Inc
- Roche Holding AG
Key Milestones in Lab Automation For In-Vitro Diagnostics Market Industry
- October 2023 - Roche announced the U.S. launch of the cobas connection modules (CCM) Vertical, the elevator and overhead components of its fully automated and modular CCM system to assist low-, mid-, and high-volume laboratories in optimizing space, productivity, and patient care.
- February 2023 - Siemens Healthineers, a leading medical technology company, and Unilabs, a leading diagnostic services provider, have announced a multi-year agreement worth more than EUR 200 million (USD 216.58 million). Unilabs has invested in top-tier Siemens Healthineers technology and will acquire more than 400 laboratory analyzers to improve its laboratory infrastructure and provide unrivaled service to its customers.
Strategic Outlook for Lab Automation For In-Vitro Diagnostics Market Market
The strategic outlook for the lab automation for in-vitro diagnostics market is characterized by continued innovation, strategic partnerships, and market expansion. Growth accelerators will include the development of more intelligent, AI-integrated automation systems that offer predictive diagnostics and enhanced workflow efficiency. Strategic collaborations between IVD manufacturers, automation providers, and healthcare institutions will be crucial for developing comprehensive, end-to-end solutions. Expanding into emerging economies and offering scalable, cost-effective automation options will be key to capturing new market share. The increasing demand for personalized medicine and the integration of lab automation with digital health platforms will further drive market evolution and create significant future potential.
Lab Automation For In-Vitro Diagnostics Market Segmentation
-
1. Equipment
- 1.1. Automated Plate Handler
- 1.2. Automated Liquid Handler
- 1.3. Robotic Arm
- 1.4. Automated Storage and Retrieval System
- 1.5. Analyzer
-
2. End User
- 2.1. Academic
- 2.2. Laboratory
- 2.3. Other End Users
Lab Automation For In-Vitro Diagnostics Market Segmentation By Geography
- 1. North America
- 2. Europe
- 3. Asia
- 4. Australia and New Zealand
- 5. Latin America
- 6. Middle East and Africa
Lab Automation For In-Vitro Diagnostics Market Regional Market Share
Geographic Coverage of Lab Automation For In-Vitro Diagnostics Market
Lab Automation For In-Vitro Diagnostics Market REPORT HIGHLIGHTS
| Aspects | Details |
|---|---|
| Study Period | 2020-2034 |
| Base Year | 2025 |
| Estimated Year | 2026 |
| Forecast Period | 2026-2034 |
| Historical Period | 2020-2025 |
| Growth Rate | CAGR of 6.30% from 2020-2034 |
| Segmentation |
|
Table of Contents
- 1. Introduction
- 1.1. Research Scope
- 1.2. Market Segmentation
- 1.3. Research Methodology
- 1.4. Definitions and Assumptions
- 2. Executive Summary
- 2.1. Introduction
- 3. Market Dynamics
- 3.1. Introduction
- 3.2. Market Drivers
- 3.2.1. Flexibility and Adaptability of Lab Automation Systems; Digital Transformation for Laboratories with IoT
- 3.3. Market Restrains
- 3.3.1. Slow Adoption Rates by Small and Medium Laboratories; Lack of Skilled Laboratory Professionals
- 3.4. Market Trends
- 3.4.1. Adoption of Robotics Arms Aids the Market Growth
- 4. Market Factor Analysis
- 4.1. Porters Five Forces
- 4.2. Supply/Value Chain
- 4.3. PESTEL analysis
- 4.4. Market Entropy
- 4.5. Patent/Trademark Analysis
- 5. Global Lab Automation For In-Vitro Diagnostics Market Analysis, Insights and Forecast, 2020-2032
- 5.1. Market Analysis, Insights and Forecast - by Equipment
- 5.1.1. Automated Plate Handler
- 5.1.2. Automated Liquid Handler
- 5.1.3. Robotic Arm
- 5.1.4. Automated Storage and Retrieval System
- 5.1.5. Analyzer
- 5.2. Market Analysis, Insights and Forecast - by End User
- 5.2.1. Academic
- 5.2.2. Laboratory
- 5.2.3. Other End Users
- 5.3. Market Analysis, Insights and Forecast - by Region
- 5.3.1. North America
- 5.3.2. Europe
- 5.3.3. Asia
- 5.3.4. Australia and New Zealand
- 5.3.5. Latin America
- 5.3.6. Middle East and Africa
- 5.1. Market Analysis, Insights and Forecast - by Equipment
- 6. North America Lab Automation For In-Vitro Diagnostics Market Analysis, Insights and Forecast, 2020-2032
- 6.1. Market Analysis, Insights and Forecast - by Equipment
- 6.1.1. Automated Plate Handler
- 6.1.2. Automated Liquid Handler
- 6.1.3. Robotic Arm
- 6.1.4. Automated Storage and Retrieval System
- 6.1.5. Analyzer
- 6.2. Market Analysis, Insights and Forecast - by End User
- 6.2.1. Academic
- 6.2.2. Laboratory
- 6.2.3. Other End Users
- 6.1. Market Analysis, Insights and Forecast - by Equipment
- 7. Europe Lab Automation For In-Vitro Diagnostics Market Analysis, Insights and Forecast, 2020-2032
- 7.1. Market Analysis, Insights and Forecast - by Equipment
- 7.1.1. Automated Plate Handler
- 7.1.2. Automated Liquid Handler
- 7.1.3. Robotic Arm
- 7.1.4. Automated Storage and Retrieval System
- 7.1.5. Analyzer
- 7.2. Market Analysis, Insights and Forecast - by End User
- 7.2.1. Academic
- 7.2.2. Laboratory
- 7.2.3. Other End Users
- 7.1. Market Analysis, Insights and Forecast - by Equipment
- 8. Asia Lab Automation For In-Vitro Diagnostics Market Analysis, Insights and Forecast, 2020-2032
- 8.1. Market Analysis, Insights and Forecast - by Equipment
- 8.1.1. Automated Plate Handler
- 8.1.2. Automated Liquid Handler
- 8.1.3. Robotic Arm
- 8.1.4. Automated Storage and Retrieval System
- 8.1.5. Analyzer
- 8.2. Market Analysis, Insights and Forecast - by End User
- 8.2.1. Academic
- 8.2.2. Laboratory
- 8.2.3. Other End Users
- 8.1. Market Analysis, Insights and Forecast - by Equipment
- 9. Australia and New Zealand Lab Automation For In-Vitro Diagnostics Market Analysis, Insights and Forecast, 2020-2032
- 9.1. Market Analysis, Insights and Forecast - by Equipment
- 9.1.1. Automated Plate Handler
- 9.1.2. Automated Liquid Handler
- 9.1.3. Robotic Arm
- 9.1.4. Automated Storage and Retrieval System
- 9.1.5. Analyzer
- 9.2. Market Analysis, Insights and Forecast - by End User
- 9.2.1. Academic
- 9.2.2. Laboratory
- 9.2.3. Other End Users
- 9.1. Market Analysis, Insights and Forecast - by Equipment
- 10. Latin America Lab Automation For In-Vitro Diagnostics Market Analysis, Insights and Forecast, 2020-2032
- 10.1. Market Analysis, Insights and Forecast - by Equipment
- 10.1.1. Automated Plate Handler
- 10.1.2. Automated Liquid Handler
- 10.1.3. Robotic Arm
- 10.1.4. Automated Storage and Retrieval System
- 10.1.5. Analyzer
- 10.2. Market Analysis, Insights and Forecast - by End User
- 10.2.1. Academic
- 10.2.2. Laboratory
- 10.2.3. Other End Users
- 10.1. Market Analysis, Insights and Forecast - by Equipment
- 11. Middle East and Africa Lab Automation For In-Vitro Diagnostics Market Analysis, Insights and Forecast, 2020-2032
- 11.1. Market Analysis, Insights and Forecast - by Equipment
- 11.1.1. Automated Plate Handler
- 11.1.2. Automated Liquid Handler
- 11.1.3. Robotic Arm
- 11.1.4. Automated Storage and Retrieval System
- 11.1.5. Analyzer
- 11.2. Market Analysis, Insights and Forecast - by End User
- 11.2.1. Academic
- 11.2.2. Laboratory
- 11.2.3. Other End Users
- 11.1. Market Analysis, Insights and Forecast - by Equipment
- 12. North America Lab Automation For In-Vitro Diagnostics Market Analysis, Insights and Forecast, 2020-2032
- 12.1. Market Analysis, Insights and Forecast - By Country/Sub-region
- 12.1.1 United States
- 12.1.2 Canada
- 12.1.3 Mexico
- 13. Europe Lab Automation For In-Vitro Diagnostics Market Analysis, Insights and Forecast, 2020-2032
- 13.1. Market Analysis, Insights and Forecast - By Country/Sub-region
- 13.1.1 Germany
- 13.1.2 United Kingdom
- 13.1.3 France
- 13.1.4 Spain
- 13.1.5 Italy
- 13.1.6 Spain
- 13.1.7 Belgium
- 13.1.8 Netherland
- 13.1.9 Nordics
- 13.1.10 Rest of Europe
- 14. Asia Pacific Lab Automation For In-Vitro Diagnostics Market Analysis, Insights and Forecast, 2020-2032
- 14.1. Market Analysis, Insights and Forecast - By Country/Sub-region
- 14.1.1 China
- 14.1.2 Japan
- 14.1.3 India
- 14.1.4 South Korea
- 14.1.5 Southeast Asia
- 14.1.6 Australia
- 14.1.7 Indonesia
- 14.1.8 Phillipes
- 14.1.9 Singapore
- 14.1.10 Thailandc
- 14.1.11 Rest of Asia Pacific
- 15. South America Lab Automation For In-Vitro Diagnostics Market Analysis, Insights and Forecast, 2020-2032
- 15.1. Market Analysis, Insights and Forecast - By Country/Sub-region
- 15.1.1 Brazil
- 15.1.2 Argentina
- 15.1.3 Peru
- 15.1.4 Chile
- 15.1.5 Colombia
- 15.1.6 Ecuador
- 15.1.7 Venezuela
- 15.1.8 Rest of South America
- 16. North America Lab Automation For In-Vitro Diagnostics Market Analysis, Insights and Forecast, 2020-2032
- 16.1. Market Analysis, Insights and Forecast - By Country/Sub-region
- 16.1.1 United States
- 16.1.2 Canada
- 16.1.3 Mexico
- 17. MEA Lab Automation For In-Vitro Diagnostics Market Analysis, Insights and Forecast, 2020-2032
- 17.1. Market Analysis, Insights and Forecast - By Country/Sub-region
- 17.1.1 United Arab Emirates
- 17.1.2 Saudi Arabia
- 17.1.3 South Africa
- 17.1.4 Rest of Middle East and Africa
- 18. Competitive Analysis
- 18.1. Global Market Share Analysis 2025
- 18.2. Company Profiles
- 18.2.1 Becton Dickinson and Company
- 18.2.1.1. Overview
- 18.2.1.2. Products
- 18.2.1.3. SWOT Analysis
- 18.2.1.4. Recent Developments
- 18.2.1.5. Financials (Based on Availability)
- 18.2.2 Tecan Group Ltd
- 18.2.2.1. Overview
- 18.2.2.2. Products
- 18.2.2.3. SWOT Analysis
- 18.2.2.4. Recent Developments
- 18.2.2.5. Financials (Based on Availability)
- 18.2.3 Cognex Corporation
- 18.2.3.1. Overview
- 18.2.3.2. Products
- 18.2.3.3. SWOT Analysis
- 18.2.3.4. Recent Developments
- 18.2.3.5. Financials (Based on Availability)
- 18.2.4 Thermo Fisher Scientific Inc
- 18.2.4.1. Overview
- 18.2.4.2. Products
- 18.2.4.3. SWOT Analysis
- 18.2.4.4. Recent Developments
- 18.2.4.5. Financials (Based on Availability)
- 18.2.5 Abbott Laboratories
- 18.2.5.1. Overview
- 18.2.5.2. Products
- 18.2.5.3. SWOT Analysis
- 18.2.5.4. Recent Developments
- 18.2.5.5. Financials (Based on Availability)
- 18.2.6 Danaher Corporation
- 18.2.6.1. Overview
- 18.2.6.2. Products
- 18.2.6.3. SWOT Analysis
- 18.2.6.4. Recent Developments
- 18.2.6.5. Financials (Based on Availability)
- 18.2.7 Siemens Healthineers AG
- 18.2.7.1. Overview
- 18.2.7.2. Products
- 18.2.7.3. SWOT Analysis
- 18.2.7.4. Recent Developments
- 18.2.7.5. Financials (Based on Availability)
- 18.2.8 Agilent Technologies Inc
- 18.2.8.1. Overview
- 18.2.8.2. Products
- 18.2.8.3. SWOT Analysis
- 18.2.8.4. Recent Developments
- 18.2.8.5. Financials (Based on Availability)
- 18.2.9 PerkinElmer Inc
- 18.2.9.1. Overview
- 18.2.9.2. Products
- 18.2.9.3. SWOT Analysis
- 18.2.9.4. Recent Developments
- 18.2.9.5. Financials (Based on Availability)
- 18.2.10 Roche Holding AG
- 18.2.10.1. Overview
- 18.2.10.2. Products
- 18.2.10.3. SWOT Analysis
- 18.2.10.4. Recent Developments
- 18.2.10.5. Financials (Based on Availability)
- 18.2.1 Becton Dickinson and Company
List of Figures
- Figure 1: Global Lab Automation For In-Vitro Diagnostics Market Revenue Breakdown (Million, %) by Region 2025 & 2033
- Figure 2: Global Lab Automation For In-Vitro Diagnostics Market Volume Breakdown (K Unit, %) by Region 2025 & 2033
- Figure 3: North America Lab Automation For In-Vitro Diagnostics Market Revenue (Million), by Country 2025 & 2033
- Figure 4: North America Lab Automation For In-Vitro Diagnostics Market Volume (K Unit), by Country 2025 & 2033
- Figure 5: North America Lab Automation For In-Vitro Diagnostics Market Revenue Share (%), by Country 2025 & 2033
- Figure 6: North America Lab Automation For In-Vitro Diagnostics Market Volume Share (%), by Country 2025 & 2033
- Figure 7: Europe Lab Automation For In-Vitro Diagnostics Market Revenue (Million), by Country 2025 & 2033
- Figure 8: Europe Lab Automation For In-Vitro Diagnostics Market Volume (K Unit), by Country 2025 & 2033
- Figure 9: Europe Lab Automation For In-Vitro Diagnostics Market Revenue Share (%), by Country 2025 & 2033
- Figure 10: Europe Lab Automation For In-Vitro Diagnostics Market Volume Share (%), by Country 2025 & 2033
- Figure 11: Asia Pacific Lab Automation For In-Vitro Diagnostics Market Revenue (Million), by Country 2025 & 2033
- Figure 12: Asia Pacific Lab Automation For In-Vitro Diagnostics Market Volume (K Unit), by Country 2025 & 2033
- Figure 13: Asia Pacific Lab Automation For In-Vitro Diagnostics Market Revenue Share (%), by Country 2025 & 2033
- Figure 14: Asia Pacific Lab Automation For In-Vitro Diagnostics Market Volume Share (%), by Country 2025 & 2033
- Figure 15: South America Lab Automation For In-Vitro Diagnostics Market Revenue (Million), by Country 2025 & 2033
- Figure 16: South America Lab Automation For In-Vitro Diagnostics Market Volume (K Unit), by Country 2025 & 2033
- Figure 17: South America Lab Automation For In-Vitro Diagnostics Market Revenue Share (%), by Country 2025 & 2033
- Figure 18: South America Lab Automation For In-Vitro Diagnostics Market Volume Share (%), by Country 2025 & 2033
- Figure 19: North America Lab Automation For In-Vitro Diagnostics Market Revenue (Million), by Country 2025 & 2033
- Figure 20: North America Lab Automation For In-Vitro Diagnostics Market Volume (K Unit), by Country 2025 & 2033
- Figure 21: North America Lab Automation For In-Vitro Diagnostics Market Revenue Share (%), by Country 2025 & 2033
- Figure 22: North America Lab Automation For In-Vitro Diagnostics Market Volume Share (%), by Country 2025 & 2033
- Figure 23: MEA Lab Automation For In-Vitro Diagnostics Market Revenue (Million), by Country 2025 & 2033
- Figure 24: MEA Lab Automation For In-Vitro Diagnostics Market Volume (K Unit), by Country 2025 & 2033
- Figure 25: MEA Lab Automation For In-Vitro Diagnostics Market Revenue Share (%), by Country 2025 & 2033
- Figure 26: MEA Lab Automation For In-Vitro Diagnostics Market Volume Share (%), by Country 2025 & 2033
- Figure 27: North America Lab Automation For In-Vitro Diagnostics Market Revenue (Million), by Equipment 2025 & 2033
- Figure 28: North America Lab Automation For In-Vitro Diagnostics Market Volume (K Unit), by Equipment 2025 & 2033
- Figure 29: North America Lab Automation For In-Vitro Diagnostics Market Revenue Share (%), by Equipment 2025 & 2033
- Figure 30: North America Lab Automation For In-Vitro Diagnostics Market Volume Share (%), by Equipment 2025 & 2033
- Figure 31: North America Lab Automation For In-Vitro Diagnostics Market Revenue (Million), by End User 2025 & 2033
- Figure 32: North America Lab Automation For In-Vitro Diagnostics Market Volume (K Unit), by End User 2025 & 2033
- Figure 33: North America Lab Automation For In-Vitro Diagnostics Market Revenue Share (%), by End User 2025 & 2033
- Figure 34: North America Lab Automation For In-Vitro Diagnostics Market Volume Share (%), by End User 2025 & 2033
- Figure 35: North America Lab Automation For In-Vitro Diagnostics Market Revenue (Million), by Country 2025 & 2033
- Figure 36: North America Lab Automation For In-Vitro Diagnostics Market Volume (K Unit), by Country 2025 & 2033
- Figure 37: North America Lab Automation For In-Vitro Diagnostics Market Revenue Share (%), by Country 2025 & 2033
- Figure 38: North America Lab Automation For In-Vitro Diagnostics Market Volume Share (%), by Country 2025 & 2033
- Figure 39: Europe Lab Automation For In-Vitro Diagnostics Market Revenue (Million), by Equipment 2025 & 2033
- Figure 40: Europe Lab Automation For In-Vitro Diagnostics Market Volume (K Unit), by Equipment 2025 & 2033
- Figure 41: Europe Lab Automation For In-Vitro Diagnostics Market Revenue Share (%), by Equipment 2025 & 2033
- Figure 42: Europe Lab Automation For In-Vitro Diagnostics Market Volume Share (%), by Equipment 2025 & 2033
- Figure 43: Europe Lab Automation For In-Vitro Diagnostics Market Revenue (Million), by End User 2025 & 2033
- Figure 44: Europe Lab Automation For In-Vitro Diagnostics Market Volume (K Unit), by End User 2025 & 2033
- Figure 45: Europe Lab Automation For In-Vitro Diagnostics Market Revenue Share (%), by End User 2025 & 2033
- Figure 46: Europe Lab Automation For In-Vitro Diagnostics Market Volume Share (%), by End User 2025 & 2033
- Figure 47: Europe Lab Automation For In-Vitro Diagnostics Market Revenue (Million), by Country 2025 & 2033
- Figure 48: Europe Lab Automation For In-Vitro Diagnostics Market Volume (K Unit), by Country 2025 & 2033
- Figure 49: Europe Lab Automation For In-Vitro Diagnostics Market Revenue Share (%), by Country 2025 & 2033
- Figure 50: Europe Lab Automation For In-Vitro Diagnostics Market Volume Share (%), by Country 2025 & 2033
- Figure 51: Asia Lab Automation For In-Vitro Diagnostics Market Revenue (Million), by Equipment 2025 & 2033
- Figure 52: Asia Lab Automation For In-Vitro Diagnostics Market Volume (K Unit), by Equipment 2025 & 2033
- Figure 53: Asia Lab Automation For In-Vitro Diagnostics Market Revenue Share (%), by Equipment 2025 & 2033
- Figure 54: Asia Lab Automation For In-Vitro Diagnostics Market Volume Share (%), by Equipment 2025 & 2033
- Figure 55: Asia Lab Automation For In-Vitro Diagnostics Market Revenue (Million), by End User 2025 & 2033
- Figure 56: Asia Lab Automation For In-Vitro Diagnostics Market Volume (K Unit), by End User 2025 & 2033
- Figure 57: Asia Lab Automation For In-Vitro Diagnostics Market Revenue Share (%), by End User 2025 & 2033
- Figure 58: Asia Lab Automation For In-Vitro Diagnostics Market Volume Share (%), by End User 2025 & 2033
- Figure 59: Asia Lab Automation For In-Vitro Diagnostics Market Revenue (Million), by Country 2025 & 2033
- Figure 60: Asia Lab Automation For In-Vitro Diagnostics Market Volume (K Unit), by Country 2025 & 2033
- Figure 61: Asia Lab Automation For In-Vitro Diagnostics Market Revenue Share (%), by Country 2025 & 2033
- Figure 62: Asia Lab Automation For In-Vitro Diagnostics Market Volume Share (%), by Country 2025 & 2033
- Figure 63: Australia and New Zealand Lab Automation For In-Vitro Diagnostics Market Revenue (Million), by Equipment 2025 & 2033
- Figure 64: Australia and New Zealand Lab Automation For In-Vitro Diagnostics Market Volume (K Unit), by Equipment 2025 & 2033
- Figure 65: Australia and New Zealand Lab Automation For In-Vitro Diagnostics Market Revenue Share (%), by Equipment 2025 & 2033
- Figure 66: Australia and New Zealand Lab Automation For In-Vitro Diagnostics Market Volume Share (%), by Equipment 2025 & 2033
- Figure 67: Australia and New Zealand Lab Automation For In-Vitro Diagnostics Market Revenue (Million), by End User 2025 & 2033
- Figure 68: Australia and New Zealand Lab Automation For In-Vitro Diagnostics Market Volume (K Unit), by End User 2025 & 2033
- Figure 69: Australia and New Zealand Lab Automation For In-Vitro Diagnostics Market Revenue Share (%), by End User 2025 & 2033
- Figure 70: Australia and New Zealand Lab Automation For In-Vitro Diagnostics Market Volume Share (%), by End User 2025 & 2033
- Figure 71: Australia and New Zealand Lab Automation For In-Vitro Diagnostics Market Revenue (Million), by Country 2025 & 2033
- Figure 72: Australia and New Zealand Lab Automation For In-Vitro Diagnostics Market Volume (K Unit), by Country 2025 & 2033
- Figure 73: Australia and New Zealand Lab Automation For In-Vitro Diagnostics Market Revenue Share (%), by Country 2025 & 2033
- Figure 74: Australia and New Zealand Lab Automation For In-Vitro Diagnostics Market Volume Share (%), by Country 2025 & 2033
- Figure 75: Latin America Lab Automation For In-Vitro Diagnostics Market Revenue (Million), by Equipment 2025 & 2033
- Figure 76: Latin America Lab Automation For In-Vitro Diagnostics Market Volume (K Unit), by Equipment 2025 & 2033
- Figure 77: Latin America Lab Automation For In-Vitro Diagnostics Market Revenue Share (%), by Equipment 2025 & 2033
- Figure 78: Latin America Lab Automation For In-Vitro Diagnostics Market Volume Share (%), by Equipment 2025 & 2033
- Figure 79: Latin America Lab Automation For In-Vitro Diagnostics Market Revenue (Million), by End User 2025 & 2033
- Figure 80: Latin America Lab Automation For In-Vitro Diagnostics Market Volume (K Unit), by End User 2025 & 2033
- Figure 81: Latin America Lab Automation For In-Vitro Diagnostics Market Revenue Share (%), by End User 2025 & 2033
- Figure 82: Latin America Lab Automation For In-Vitro Diagnostics Market Volume Share (%), by End User 2025 & 2033
- Figure 83: Latin America Lab Automation For In-Vitro Diagnostics Market Revenue (Million), by Country 2025 & 2033
- Figure 84: Latin America Lab Automation For In-Vitro Diagnostics Market Volume (K Unit), by Country 2025 & 2033
- Figure 85: Latin America Lab Automation For In-Vitro Diagnostics Market Revenue Share (%), by Country 2025 & 2033
- Figure 86: Latin America Lab Automation For In-Vitro Diagnostics Market Volume Share (%), by Country 2025 & 2033
- Figure 87: Middle East and Africa Lab Automation For In-Vitro Diagnostics Market Revenue (Million), by Equipment 2025 & 2033
- Figure 88: Middle East and Africa Lab Automation For In-Vitro Diagnostics Market Volume (K Unit), by Equipment 2025 & 2033
- Figure 89: Middle East and Africa Lab Automation For In-Vitro Diagnostics Market Revenue Share (%), by Equipment 2025 & 2033
- Figure 90: Middle East and Africa Lab Automation For In-Vitro Diagnostics Market Volume Share (%), by Equipment 2025 & 2033
- Figure 91: Middle East and Africa Lab Automation For In-Vitro Diagnostics Market Revenue (Million), by End User 2025 & 2033
- Figure 92: Middle East and Africa Lab Automation For In-Vitro Diagnostics Market Volume (K Unit), by End User 2025 & 2033
- Figure 93: Middle East and Africa Lab Automation For In-Vitro Diagnostics Market Revenue Share (%), by End User 2025 & 2033
- Figure 94: Middle East and Africa Lab Automation For In-Vitro Diagnostics Market Volume Share (%), by End User 2025 & 2033
- Figure 95: Middle East and Africa Lab Automation For In-Vitro Diagnostics Market Revenue (Million), by Country 2025 & 2033
- Figure 96: Middle East and Africa Lab Automation For In-Vitro Diagnostics Market Volume (K Unit), by Country 2025 & 2033
- Figure 97: Middle East and Africa Lab Automation For In-Vitro Diagnostics Market Revenue Share (%), by Country 2025 & 2033
- Figure 98: Middle East and Africa Lab Automation For In-Vitro Diagnostics Market Volume Share (%), by Country 2025 & 2033
List of Tables
- Table 1: Global Lab Automation For In-Vitro Diagnostics Market Revenue Million Forecast, by Region 2020 & 2033
- Table 2: Global Lab Automation For In-Vitro Diagnostics Market Volume K Unit Forecast, by Region 2020 & 2033
- Table 3: Global Lab Automation For In-Vitro Diagnostics Market Revenue Million Forecast, by Equipment 2020 & 2033
- Table 4: Global Lab Automation For In-Vitro Diagnostics Market Volume K Unit Forecast, by Equipment 2020 & 2033
- Table 5: Global Lab Automation For In-Vitro Diagnostics Market Revenue Million Forecast, by End User 2020 & 2033
- Table 6: Global Lab Automation For In-Vitro Diagnostics Market Volume K Unit Forecast, by End User 2020 & 2033
- Table 7: Global Lab Automation For In-Vitro Diagnostics Market Revenue Million Forecast, by Region 2020 & 2033
- Table 8: Global Lab Automation For In-Vitro Diagnostics Market Volume K Unit Forecast, by Region 2020 & 2033
- Table 9: Global Lab Automation For In-Vitro Diagnostics Market Revenue Million Forecast, by Country 2020 & 2033
- Table 10: Global Lab Automation For In-Vitro Diagnostics Market Volume K Unit Forecast, by Country 2020 & 2033
- Table 11: United States Lab Automation For In-Vitro Diagnostics Market Revenue (Million) Forecast, by Application 2020 & 2033
- Table 12: United States Lab Automation For In-Vitro Diagnostics Market Volume (K Unit) Forecast, by Application 2020 & 2033
- Table 13: Canada Lab Automation For In-Vitro Diagnostics Market Revenue (Million) Forecast, by Application 2020 & 2033
- Table 14: Canada Lab Automation For In-Vitro Diagnostics Market Volume (K Unit) Forecast, by Application 2020 & 2033
- Table 15: Mexico Lab Automation For In-Vitro Diagnostics Market Revenue (Million) Forecast, by Application 2020 & 2033
- Table 16: Mexico Lab Automation For In-Vitro Diagnostics Market Volume (K Unit) Forecast, by Application 2020 & 2033
- Table 17: Global Lab Automation For In-Vitro Diagnostics Market Revenue Million Forecast, by Country 2020 & 2033
- Table 18: Global Lab Automation For In-Vitro Diagnostics Market Volume K Unit Forecast, by Country 2020 & 2033
- Table 19: Germany Lab Automation For In-Vitro Diagnostics Market Revenue (Million) Forecast, by Application 2020 & 2033
- Table 20: Germany Lab Automation For In-Vitro Diagnostics Market Volume (K Unit) Forecast, by Application 2020 & 2033
- Table 21: United Kingdom Lab Automation For In-Vitro Diagnostics Market Revenue (Million) Forecast, by Application 2020 & 2033
- Table 22: United Kingdom Lab Automation For In-Vitro Diagnostics Market Volume (K Unit) Forecast, by Application 2020 & 2033
- Table 23: France Lab Automation For In-Vitro Diagnostics Market Revenue (Million) Forecast, by Application 2020 & 2033
- Table 24: France Lab Automation For In-Vitro Diagnostics Market Volume (K Unit) Forecast, by Application 2020 & 2033
- Table 25: Spain Lab Automation For In-Vitro Diagnostics Market Revenue (Million) Forecast, by Application 2020 & 2033
- Table 26: Spain Lab Automation For In-Vitro Diagnostics Market Volume (K Unit) Forecast, by Application 2020 & 2033
- Table 27: Italy Lab Automation For In-Vitro Diagnostics Market Revenue (Million) Forecast, by Application 2020 & 2033
- Table 28: Italy Lab Automation For In-Vitro Diagnostics Market Volume (K Unit) Forecast, by Application 2020 & 2033
- Table 29: Spain Lab Automation For In-Vitro Diagnostics Market Revenue (Million) Forecast, by Application 2020 & 2033
- Table 30: Spain Lab Automation For In-Vitro Diagnostics Market Volume (K Unit) Forecast, by Application 2020 & 2033
- Table 31: Belgium Lab Automation For In-Vitro Diagnostics Market Revenue (Million) Forecast, by Application 2020 & 2033
- Table 32: Belgium Lab Automation For In-Vitro Diagnostics Market Volume (K Unit) Forecast, by Application 2020 & 2033
- Table 33: Netherland Lab Automation For In-Vitro Diagnostics Market Revenue (Million) Forecast, by Application 2020 & 2033
- Table 34: Netherland Lab Automation For In-Vitro Diagnostics Market Volume (K Unit) Forecast, by Application 2020 & 2033
- Table 35: Nordics Lab Automation For In-Vitro Diagnostics Market Revenue (Million) Forecast, by Application 2020 & 2033
- Table 36: Nordics Lab Automation For In-Vitro Diagnostics Market Volume (K Unit) Forecast, by Application 2020 & 2033
- Table 37: Rest of Europe Lab Automation For In-Vitro Diagnostics Market Revenue (Million) Forecast, by Application 2020 & 2033
- Table 38: Rest of Europe Lab Automation For In-Vitro Diagnostics Market Volume (K Unit) Forecast, by Application 2020 & 2033
- Table 39: Global Lab Automation For In-Vitro Diagnostics Market Revenue Million Forecast, by Country 2020 & 2033
- Table 40: Global Lab Automation For In-Vitro Diagnostics Market Volume K Unit Forecast, by Country 2020 & 2033
- Table 41: China Lab Automation For In-Vitro Diagnostics Market Revenue (Million) Forecast, by Application 2020 & 2033
- Table 42: China Lab Automation For In-Vitro Diagnostics Market Volume (K Unit) Forecast, by Application 2020 & 2033
- Table 43: Japan Lab Automation For In-Vitro Diagnostics Market Revenue (Million) Forecast, by Application 2020 & 2033
- Table 44: Japan Lab Automation For In-Vitro Diagnostics Market Volume (K Unit) Forecast, by Application 2020 & 2033
- Table 45: India Lab Automation For In-Vitro Diagnostics Market Revenue (Million) Forecast, by Application 2020 & 2033
- Table 46: India Lab Automation For In-Vitro Diagnostics Market Volume (K Unit) Forecast, by Application 2020 & 2033
- Table 47: South Korea Lab Automation For In-Vitro Diagnostics Market Revenue (Million) Forecast, by Application 2020 & 2033
- Table 48: South Korea Lab Automation For In-Vitro Diagnostics Market Volume (K Unit) Forecast, by Application 2020 & 2033
- Table 49: Southeast Asia Lab Automation For In-Vitro Diagnostics Market Revenue (Million) Forecast, by Application 2020 & 2033
- Table 50: Southeast Asia Lab Automation For In-Vitro Diagnostics Market Volume (K Unit) Forecast, by Application 2020 & 2033
- Table 51: Australia Lab Automation For In-Vitro Diagnostics Market Revenue (Million) Forecast, by Application 2020 & 2033
- Table 52: Australia Lab Automation For In-Vitro Diagnostics Market Volume (K Unit) Forecast, by Application 2020 & 2033
- Table 53: Indonesia Lab Automation For In-Vitro Diagnostics Market Revenue (Million) Forecast, by Application 2020 & 2033
- Table 54: Indonesia Lab Automation For In-Vitro Diagnostics Market Volume (K Unit) Forecast, by Application 2020 & 2033
- Table 55: Phillipes Lab Automation For In-Vitro Diagnostics Market Revenue (Million) Forecast, by Application 2020 & 2033
- Table 56: Phillipes Lab Automation For In-Vitro Diagnostics Market Volume (K Unit) Forecast, by Application 2020 & 2033
- Table 57: Singapore Lab Automation For In-Vitro Diagnostics Market Revenue (Million) Forecast, by Application 2020 & 2033
- Table 58: Singapore Lab Automation For In-Vitro Diagnostics Market Volume (K Unit) Forecast, by Application 2020 & 2033
- Table 59: Thailandc Lab Automation For In-Vitro Diagnostics Market Revenue (Million) Forecast, by Application 2020 & 2033
- Table 60: Thailandc Lab Automation For In-Vitro Diagnostics Market Volume (K Unit) Forecast, by Application 2020 & 2033
- Table 61: Rest of Asia Pacific Lab Automation For In-Vitro Diagnostics Market Revenue (Million) Forecast, by Application 2020 & 2033
- Table 62: Rest of Asia Pacific Lab Automation For In-Vitro Diagnostics Market Volume (K Unit) Forecast, by Application 2020 & 2033
- Table 63: Global Lab Automation For In-Vitro Diagnostics Market Revenue Million Forecast, by Country 2020 & 2033
- Table 64: Global Lab Automation For In-Vitro Diagnostics Market Volume K Unit Forecast, by Country 2020 & 2033
- Table 65: Brazil Lab Automation For In-Vitro Diagnostics Market Revenue (Million) Forecast, by Application 2020 & 2033
- Table 66: Brazil Lab Automation For In-Vitro Diagnostics Market Volume (K Unit) Forecast, by Application 2020 & 2033
- Table 67: Argentina Lab Automation For In-Vitro Diagnostics Market Revenue (Million) Forecast, by Application 2020 & 2033
- Table 68: Argentina Lab Automation For In-Vitro Diagnostics Market Volume (K Unit) Forecast, by Application 2020 & 2033
- Table 69: Peru Lab Automation For In-Vitro Diagnostics Market Revenue (Million) Forecast, by Application 2020 & 2033
- Table 70: Peru Lab Automation For In-Vitro Diagnostics Market Volume (K Unit) Forecast, by Application 2020 & 2033
- Table 71: Chile Lab Automation For In-Vitro Diagnostics Market Revenue (Million) Forecast, by Application 2020 & 2033
- Table 72: Chile Lab Automation For In-Vitro Diagnostics Market Volume (K Unit) Forecast, by Application 2020 & 2033
- Table 73: Colombia Lab Automation For In-Vitro Diagnostics Market Revenue (Million) Forecast, by Application 2020 & 2033
- Table 74: Colombia Lab Automation For In-Vitro Diagnostics Market Volume (K Unit) Forecast, by Application 2020 & 2033
- Table 75: Ecuador Lab Automation For In-Vitro Diagnostics Market Revenue (Million) Forecast, by Application 2020 & 2033
- Table 76: Ecuador Lab Automation For In-Vitro Diagnostics Market Volume (K Unit) Forecast, by Application 2020 & 2033
- Table 77: Venezuela Lab Automation For In-Vitro Diagnostics Market Revenue (Million) Forecast, by Application 2020 & 2033
- Table 78: Venezuela Lab Automation For In-Vitro Diagnostics Market Volume (K Unit) Forecast, by Application 2020 & 2033
- Table 79: Rest of South America Lab Automation For In-Vitro Diagnostics Market Revenue (Million) Forecast, by Application 2020 & 2033
- Table 80: Rest of South America Lab Automation For In-Vitro Diagnostics Market Volume (K Unit) Forecast, by Application 2020 & 2033
- Table 81: Global Lab Automation For In-Vitro Diagnostics Market Revenue Million Forecast, by Country 2020 & 2033
- Table 82: Global Lab Automation For In-Vitro Diagnostics Market Volume K Unit Forecast, by Country 2020 & 2033
- Table 83: United States Lab Automation For In-Vitro Diagnostics Market Revenue (Million) Forecast, by Application 2020 & 2033
- Table 84: United States Lab Automation For In-Vitro Diagnostics Market Volume (K Unit) Forecast, by Application 2020 & 2033
- Table 85: Canada Lab Automation For In-Vitro Diagnostics Market Revenue (Million) Forecast, by Application 2020 & 2033
- Table 86: Canada Lab Automation For In-Vitro Diagnostics Market Volume (K Unit) Forecast, by Application 2020 & 2033
- Table 87: Mexico Lab Automation For In-Vitro Diagnostics Market Revenue (Million) Forecast, by Application 2020 & 2033
- Table 88: Mexico Lab Automation For In-Vitro Diagnostics Market Volume (K Unit) Forecast, by Application 2020 & 2033
- Table 89: Global Lab Automation For In-Vitro Diagnostics Market Revenue Million Forecast, by Country 2020 & 2033
- Table 90: Global Lab Automation For In-Vitro Diagnostics Market Volume K Unit Forecast, by Country 2020 & 2033
- Table 91: United Arab Emirates Lab Automation For In-Vitro Diagnostics Market Revenue (Million) Forecast, by Application 2020 & 2033
- Table 92: United Arab Emirates Lab Automation For In-Vitro Diagnostics Market Volume (K Unit) Forecast, by Application 2020 & 2033
- Table 93: Saudi Arabia Lab Automation For In-Vitro Diagnostics Market Revenue (Million) Forecast, by Application 2020 & 2033
- Table 94: Saudi Arabia Lab Automation For In-Vitro Diagnostics Market Volume (K Unit) Forecast, by Application 2020 & 2033
- Table 95: South Africa Lab Automation For In-Vitro Diagnostics Market Revenue (Million) Forecast, by Application 2020 & 2033
- Table 96: South Africa Lab Automation For In-Vitro Diagnostics Market Volume (K Unit) Forecast, by Application 2020 & 2033
- Table 97: Rest of Middle East and Africa Lab Automation For In-Vitro Diagnostics Market Revenue (Million) Forecast, by Application 2020 & 2033
- Table 98: Rest of Middle East and Africa Lab Automation For In-Vitro Diagnostics Market Volume (K Unit) Forecast, by Application 2020 & 2033
- Table 99: Global Lab Automation For In-Vitro Diagnostics Market Revenue Million Forecast, by Equipment 2020 & 2033
- Table 100: Global Lab Automation For In-Vitro Diagnostics Market Volume K Unit Forecast, by Equipment 2020 & 2033
- Table 101: Global Lab Automation For In-Vitro Diagnostics Market Revenue Million Forecast, by End User 2020 & 2033
- Table 102: Global Lab Automation For In-Vitro Diagnostics Market Volume K Unit Forecast, by End User 2020 & 2033
- Table 103: Global Lab Automation For In-Vitro Diagnostics Market Revenue Million Forecast, by Country 2020 & 2033
- Table 104: Global Lab Automation For In-Vitro Diagnostics Market Volume K Unit Forecast, by Country 2020 & 2033
- Table 105: Global Lab Automation For In-Vitro Diagnostics Market Revenue Million Forecast, by Equipment 2020 & 2033
- Table 106: Global Lab Automation For In-Vitro Diagnostics Market Volume K Unit Forecast, by Equipment 2020 & 2033
- Table 107: Global Lab Automation For In-Vitro Diagnostics Market Revenue Million Forecast, by End User 2020 & 2033
- Table 108: Global Lab Automation For In-Vitro Diagnostics Market Volume K Unit Forecast, by End User 2020 & 2033
- Table 109: Global Lab Automation For In-Vitro Diagnostics Market Revenue Million Forecast, by Country 2020 & 2033
- Table 110: Global Lab Automation For In-Vitro Diagnostics Market Volume K Unit Forecast, by Country 2020 & 2033
- Table 111: Global Lab Automation For In-Vitro Diagnostics Market Revenue Million Forecast, by Equipment 2020 & 2033
- Table 112: Global Lab Automation For In-Vitro Diagnostics Market Volume K Unit Forecast, by Equipment 2020 & 2033
- Table 113: Global Lab Automation For In-Vitro Diagnostics Market Revenue Million Forecast, by End User 2020 & 2033
- Table 114: Global Lab Automation For In-Vitro Diagnostics Market Volume K Unit Forecast, by End User 2020 & 2033
- Table 115: Global Lab Automation For In-Vitro Diagnostics Market Revenue Million Forecast, by Country 2020 & 2033
- Table 116: Global Lab Automation For In-Vitro Diagnostics Market Volume K Unit Forecast, by Country 2020 & 2033
- Table 117: Global Lab Automation For In-Vitro Diagnostics Market Revenue Million Forecast, by Equipment 2020 & 2033
- Table 118: Global Lab Automation For In-Vitro Diagnostics Market Volume K Unit Forecast, by Equipment 2020 & 2033
- Table 119: Global Lab Automation For In-Vitro Diagnostics Market Revenue Million Forecast, by End User 2020 & 2033
- Table 120: Global Lab Automation For In-Vitro Diagnostics Market Volume K Unit Forecast, by End User 2020 & 2033
- Table 121: Global Lab Automation For In-Vitro Diagnostics Market Revenue Million Forecast, by Country 2020 & 2033
- Table 122: Global Lab Automation For In-Vitro Diagnostics Market Volume K Unit Forecast, by Country 2020 & 2033
- Table 123: Global Lab Automation For In-Vitro Diagnostics Market Revenue Million Forecast, by Equipment 2020 & 2033
- Table 124: Global Lab Automation For In-Vitro Diagnostics Market Volume K Unit Forecast, by Equipment 2020 & 2033
- Table 125: Global Lab Automation For In-Vitro Diagnostics Market Revenue Million Forecast, by End User 2020 & 2033
- Table 126: Global Lab Automation For In-Vitro Diagnostics Market Volume K Unit Forecast, by End User 2020 & 2033
- Table 127: Global Lab Automation For In-Vitro Diagnostics Market Revenue Million Forecast, by Country 2020 & 2033
- Table 128: Global Lab Automation For In-Vitro Diagnostics Market Volume K Unit Forecast, by Country 2020 & 2033
- Table 129: Global Lab Automation For In-Vitro Diagnostics Market Revenue Million Forecast, by Equipment 2020 & 2033
- Table 130: Global Lab Automation For In-Vitro Diagnostics Market Volume K Unit Forecast, by Equipment 2020 & 2033
- Table 131: Global Lab Automation For In-Vitro Diagnostics Market Revenue Million Forecast, by End User 2020 & 2033
- Table 132: Global Lab Automation For In-Vitro Diagnostics Market Volume K Unit Forecast, by End User 2020 & 2033
- Table 133: Global Lab Automation For In-Vitro Diagnostics Market Revenue Million Forecast, by Country 2020 & 2033
- Table 134: Global Lab Automation For In-Vitro Diagnostics Market Volume K Unit Forecast, by Country 2020 & 2033
Frequently Asked Questions
1. What is the projected Compound Annual Growth Rate (CAGR) of the Lab Automation For In-Vitro Diagnostics Market?
The projected CAGR is approximately 6.30%.
2. Which companies are prominent players in the Lab Automation For In-Vitro Diagnostics Market?
Key companies in the market include Becton Dickinson and Company, Tecan Group Ltd, Cognex Corporation, Thermo Fisher Scientific Inc, Abbott Laboratories, Danaher Corporation, Siemens Healthineers AG, Agilent Technologies Inc, PerkinElmer Inc, Roche Holding AG.
3. What are the main segments of the Lab Automation For In-Vitro Diagnostics Market?
The market segments include Equipment, End User.
4. Can you provide details about the market size?
The market size is estimated to be USD 5.75 Million as of 2022.
5. What are some drivers contributing to market growth?
Flexibility and Adaptability of Lab Automation Systems; Digital Transformation for Laboratories with IoT.
6. What are the notable trends driving market growth?
Adoption of Robotics Arms Aids the Market Growth.
7. Are there any restraints impacting market growth?
Slow Adoption Rates by Small and Medium Laboratories; Lack of Skilled Laboratory Professionals.
8. Can you provide examples of recent developments in the market?
October 2023 - Roche announced the U.S. launch of the cobas connection modules (CCM) Vertical, the elevator and overhead components of its fully automated and modular CCM system to assist low-, mid-, and high-volume laboratories in optimizing space, productivity, and patient care.
9. What pricing options are available for accessing the report?
Pricing options include single-user, multi-user, and enterprise licenses priced at USD 4750, USD 5250, and USD 8750 respectively.
10. Is the market size provided in terms of value or volume?
The market size is provided in terms of value, measured in Million and volume, measured in K Unit.
11. Are there any specific market keywords associated with the report?
Yes, the market keyword associated with the report is "Lab Automation For In-Vitro Diagnostics Market," which aids in identifying and referencing the specific market segment covered.
12. How do I determine which pricing option suits my needs best?
The pricing options vary based on user requirements and access needs. Individual users may opt for single-user licenses, while businesses requiring broader access may choose multi-user or enterprise licenses for cost-effective access to the report.
13. Are there any additional resources or data provided in the Lab Automation For In-Vitro Diagnostics Market report?
While the report offers comprehensive insights, it's advisable to review the specific contents or supplementary materials provided to ascertain if additional resources or data are available.
14. How can I stay updated on further developments or reports in the Lab Automation For In-Vitro Diagnostics Market?
To stay informed about further developments, trends, and reports in the Lab Automation For In-Vitro Diagnostics Market, consider subscribing to industry newsletters, following relevant companies and organizations, or regularly checking reputable industry news sources and publications.
Methodology
Step 1 - Identification of Relevant Samples Size from Population Database


Step 2 - Approaches for Defining Global Market Size (Value, Volume* & Price*)

Note*: In applicable scenarios
Step 3 - Data Sources
Primary Research
- Web Analytics
- Survey Reports
- Research Institute
- Latest Research Reports
- Opinion Leaders
Secondary Research
- Annual Reports
- White Paper
- Latest Press Release
- Industry Association
- Paid Database
- Investor Presentations

Step 4 - Data Triangulation
Involves using different sources of information in order to increase the validity of a study
These sources are likely to be stakeholders in a program - participants, other researchers, program staff, other community members, and so on.
Then we put all data in single framework & apply various statistical tools to find out the dynamic on the market.
During the analysis stage, feedback from the stakeholder groups would be compared to determine areas of agreement as well as areas of divergence
