

Key Insights
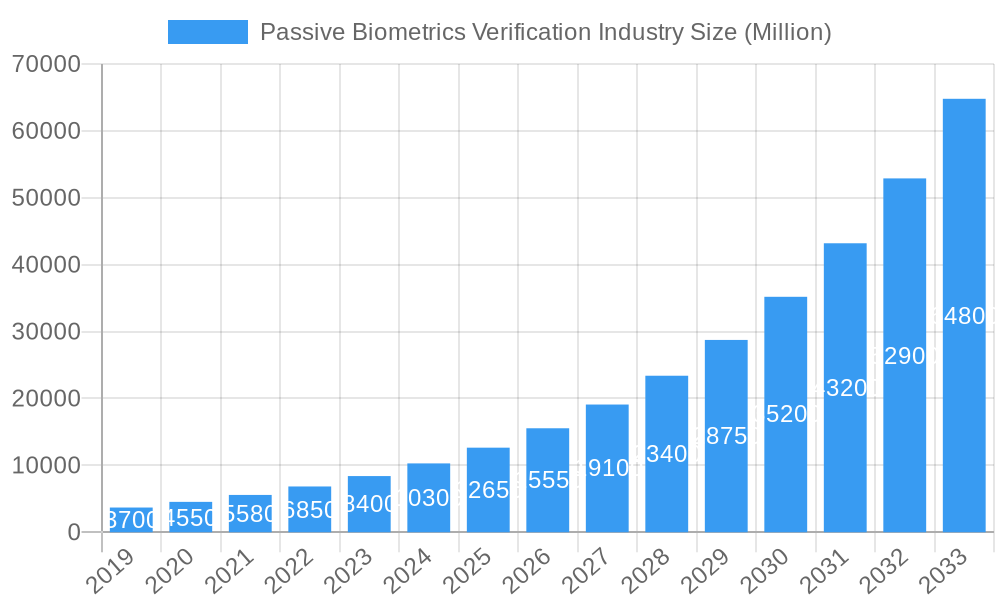
The Passive Biometrics Verification Industry is poised for explosive growth, projected to reach a substantial market size of approximately $15,200 million by 2025, driven by a remarkable Compound Annual Growth Rate (CAGR) of 23.65%. This robust expansion is fueled by the increasing demand for seamless and secure authentication solutions across a diverse range of industries. The inherent advantage of passive biometrics, which verifies identity without active user input, is revolutionizing fraud prevention and customer experience. Key market drivers include the escalating need for advanced cybersecurity measures to combat sophisticated digital threats, the proliferation of connected devices, and the growing adoption of cloud-based solutions for scalability and accessibility. The shift towards more intuitive and user-friendly authentication methods is a significant trend, moving away from cumbersome passwords and multi-factor authentication that often disrupt user workflows. Furthermore, regulatory compliance mandates are pushing organizations to invest in robust identity verification systems, further bolstering market growth.
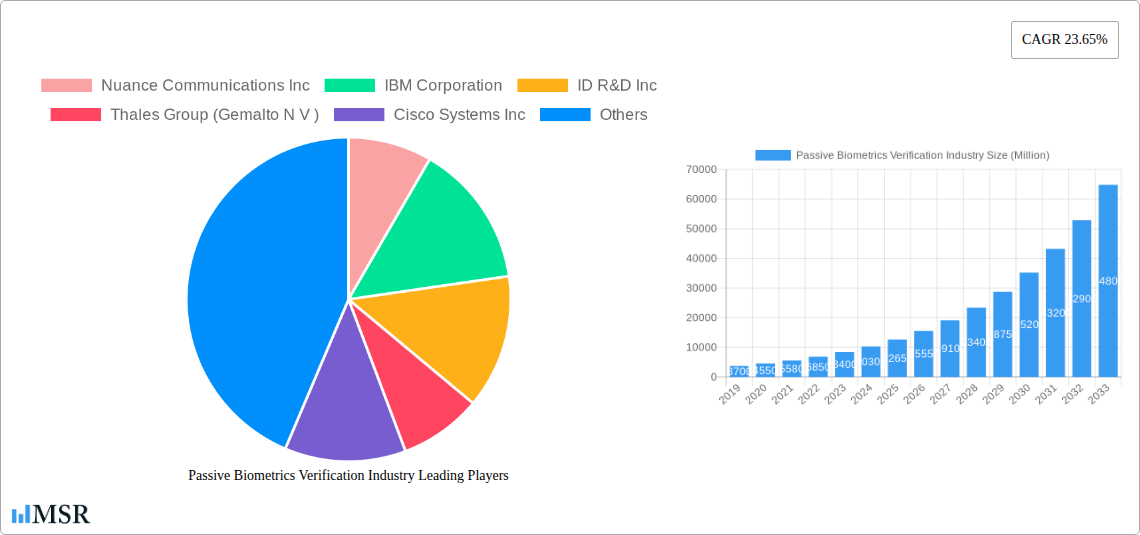
Passive Biometrics Verification Industry Market Size (In Billion)
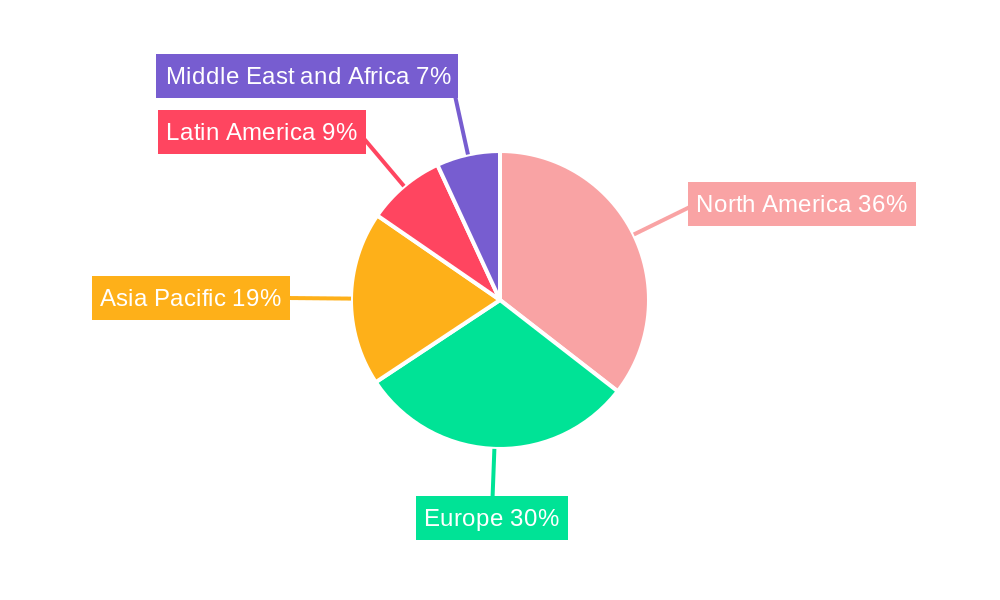
The industry is witnessing significant innovation in its service offerings, with software and services forming the core of this evolving landscape. Deployment models are predominantly shifting towards cloud-based solutions, offering greater flexibility, cost-effectiveness, and faster deployment times, although on-premises solutions retain relevance for highly regulated sectors. The BFSI sector is leading the charge in adoption due to the critical need for robust fraud detection and prevention in financial transactions. The retail, IT and telecom, healthcare, and government sectors are also rapidly embracing passive biometrics to enhance security and streamline customer interactions. Leading companies such as Nuance Communications Inc., IBM Corporation, and Thales Group (Gemalto N.V.) are at the forefront of this innovation, offering advanced solutions that leverage behavioral patterns, voice recognition, and other continuous authentication methods. Geographically, North America and Europe are expected to dominate the market, with the Asia Pacific region showing particularly strong growth potential due to its rapidly expanding digital economy and increasing cybersecurity concerns.
Passive Biometrics Verification Industry Company Market Share
This comprehensive report dives deep into the passive biometrics verification industry, a rapidly evolving sector transforming how we approach identity and access management. Uncover critical market dynamics, technological advancements, and strategic opportunities that will shape the future of secure, unobtrusive authentication. This analysis spans from 2019–2033, with a base and estimated year of 2025, and a forecast period of 2025–2033, building upon historical data from 2019–2024. Gain actionable insights for stakeholders navigating this high-growth market, estimated to reach over a million dollars in value.
Passive Biometrics Verification Industry Market Concentration & Dynamics
The passive biometrics verification industry exhibits a moderate to high market concentration, driven by the significant presence of established technology giants and specialized biometric solution providers. Innovation ecosystems are thriving, with over XX million dollars invested in research and development annually, fostering continuous advancements in algorithm accuracy and behavioral analytics. Regulatory frameworks, while still evolving, are increasingly emphasizing robust identity verification, creating tailwinds for passive solutions. Substitute products, primarily active biometric methods and traditional multi-factor authentication, are facing pressure from the convenience and enhanced security offered by passive biometrics. End-user trends strongly favor frictionless user experiences, propelling the adoption of continuous authentication methods. Merger and acquisition (M&A) activities are anticipated to remain robust, with an estimated XX M&A deals in the historical period, as larger players seek to consolidate market share and acquire cutting-edge technologies. Key players are strategically acquiring innovative startups to bolster their portfolios.
- Market Share Dominance: Leading players like Nuance Communications Inc. and IBM Corporation hold significant market share due to their extensive product portfolios and established customer bases.
- M&A Deal Counts: Expect continued consolidation as companies like Thales Group (Gemalto N V) and Cisco Systems Inc. pursue strategic acquisitions to enhance their offerings.
- Innovation Ecosystems: Driven by companies such as ID R&D Inc. and Aware Inc., a vibrant ecosystem of startups and established vendors fuels rapid technological progress.
Passive Biometrics Verification Industry Industry Insights & Trends
The passive biometrics verification industry is poised for substantial growth, projected to reach a market size of over a million dollars by 2025, with an impressive Compound Annual Growth Rate (CAGR) of over XX% during the forecast period. This growth is primarily fueled by the escalating need for enhanced cybersecurity measures across all sectors, driven by the surge in sophisticated cyber threats and data breaches. The shift towards remote work and the proliferation of digital services have further accelerated the demand for secure and seamless authentication solutions that do not disrupt user workflows. Technological disruptions, including advancements in Artificial Intelligence (AI) and Machine Learning (ML) for sophisticated behavioral analysis, are revolutionizing the accuracy and effectiveness of passive biometrics. Consumers are increasingly demanding frictionless experiences, leading them to embrace solutions that authenticate them without explicit user action, such as voice recognition, gait analysis, and typing dynamics. The integration of passive biometrics into mobile devices and IoT ecosystems is also a significant trend, expanding the application landscape and driving wider adoption. The ongoing evolution of AI algorithms is enabling more granular and accurate identification of individuals based on their unique behavioral patterns, offering a significant advantage over traditional authentication methods. The increasing focus on privacy and data protection regulations globally also plays a crucial role, as passive biometrics can often offer a more privacy-preserving alternative to active methods requiring explicit data capture.
Key Markets & Segments Leading Passive Biometrics Verification Industry
The BFSI (Banking, Financial Services, and Insurance) sector is a dominant market for passive biometrics verification, driven by stringent regulatory requirements, the high value of transactions, and the constant threat of financial fraud. The IT and Telecom sector also exhibits significant adoption due to the vast amounts of sensitive data handled and the need for secure access management in complex networks.
- BFSI Dominance Drivers:
- Regulatory Compliance: Mandates for strong customer authentication (SCA) and anti-money laundering (AML) regulations drive demand.
- Fraud Prevention: Passive biometrics effectively detect and prevent account takeovers and fraudulent transactions.
- Customer Experience: Seamless authentication enhances customer loyalty and reduces cart abandonment rates in online banking.
- IT and Telecom Adoption Drivers:
- Data Security: Protecting vast amounts of sensitive customer and corporate data.
- Network Access Control: Securing access to critical IT infrastructure and telecommunication networks.
- Remote Workforce Security: Enabling secure authentication for employees working remotely.
The Cloud deployment type is experiencing rapid growth, offering scalability, cost-effectiveness, and easier integration for businesses of all sizes. Services, including implementation, integration, and ongoing support, are crucial components driving market expansion, as organizations seek specialized expertise.
- Cloud Deployment Growth Drivers:
- Scalability and Flexibility: Cloud-based solutions easily adapt to fluctuating user demands.
- Reduced Infrastructure Costs: Eliminates the need for significant on-premises hardware investments.
- Faster Deployment: Enables quicker integration and time-to-market for new security features.
- Services Segment Importance:
- Expert Integration: Ensuring seamless compatibility with existing IT infrastructures.
- Ongoing Support and Maintenance: Providing continuous system optimization and issue resolution.
- Customization: Tailoring solutions to meet specific industry or organizational needs.
Passive Biometrics Verification Industry Product Developments
Recent product developments in the passive biometrics verification industry showcase a strong emphasis on AI-powered behavioral analytics, including keystroke dynamics, mouse movements, and voice recognition. Companies are launching advanced solutions capable of continuous authentication, providing real-time threat detection and enhancing user experience by eliminating the need for frequent logins. These innovations are designed to integrate seamlessly into existing workflows and devices, offering a competitive edge through enhanced security and user convenience. The market relevance of these products is escalating as organizations recognize the limitations of traditional authentication methods in combating sophisticated cyber threats.
Challenges in the Passive Biometrics Verification Industry Market
Despite its immense potential, the passive biometrics verification industry faces several challenges. Regulatory hurdles and the lack of standardized frameworks across different regions can slow down adoption. Supply chain issues for specialized hardware components, though improving, can still impact deployment timelines. Competitive pressures from established cybersecurity firms and the ongoing development of sophisticated evasion techniques by malicious actors necessitate continuous innovation and adaptation. The initial cost of implementation and the need for robust data privacy protocols also present significant considerations for potential adopters.
- Regulatory Uncertainty: Evolving data privacy laws and biometrics usage guidelines.
- Integration Complexity: Ensuring seamless integration with diverse IT environments.
- Perception of Accuracy: Overcoming skepticism regarding the reliability of behavioral analysis.
Forces Driving Passive Biometrics Verification Industry Growth
The passive biometrics verification industry is propelled by a confluence of powerful growth drivers. Technological advancements, particularly in AI and ML, are enabling more accurate and sophisticated behavioral analysis. The economic imperative to prevent financial losses due to fraud and data breaches is a significant motivator. Increasingly stringent regulatory landscapes across various sectors mandate robust identity verification solutions. Furthermore, the growing demand for frictionless user experiences in an increasingly digital world is pushing organizations towards passive authentication methods that don't interrupt user workflows, making security both robust and convenient.
Challenges in the Passive Biometrics Verification Industry Market
Long-term growth catalysts for the passive biometrics verification industry lie in its inherent adaptability and continuous innovation. The development of explainable AI (XAI) in biometric algorithms will build greater trust and transparency. Strategic partnerships between biometric providers and other cybersecurity entities will create comprehensive security solutions. Market expansions into emerging economies with burgeoning digital infrastructures offer substantial growth potential. The ongoing focus on privacy-preserving technologies and the development of federated learning models for biometric data will further enhance adoption and address consumer concerns, ensuring sustained and robust market growth.
Emerging Opportunities in Passive Biometrics Verification Industry
Emerging opportunities in the passive biometrics verification industry are abundant and diverse. The expansion of biometric-as-a-service (BaaS) models offers accessible and scalable solutions for smaller enterprises. The integration of passive biometrics into the Internet of Things (IoT) ecosystem presents new avenues for device authentication and secure data management. Growing consumer preference for contactless and touchless authentication methods, especially in post-pandemic scenarios, opens doors for voice and facial recognition-based passive systems. Furthermore, the increasing adoption in the healthcare sector for secure patient identification and access to sensitive medical records represents a significant untapped market.
Leading Players in the Passive Biometrics Verification Industry Sector
- Nuance Communications Inc
- IBM Corporation
- ID R&D Inc
- Thales Group (Gemalto N V)
- Cisco Systems Inc
- Aware Inc
- Pindrop Security Inc
- Verint Systems Inc
- OneSpan Inc
- NEC Corporation
- Fortress Identity
- Equifax Inc
- BioCatch Ltd
Key Milestones in Passive Biometrics Verification Industry Industry
- 2019: Increased investment in AI/ML for behavioral biometrics algorithms.
- 2020: Rise in remote work accelerates demand for continuous authentication solutions.
- 2021: Major players launch enhanced voice and keystroke dynamics technologies.
- 2022: Growing regulatory focus on strong customer authentication (SCA) globally.
- 2023: Expansion of passive biometrics into new industry verticals beyond BFSI.
- 2024: Development of more privacy-preserving biometric data handling techniques.
Strategic Outlook for Passive Biometrics Verification Industry Market
The strategic outlook for the passive biometrics verification industry market is exceptionally positive, driven by escalating cybersecurity threats and the global demand for seamless, secure authentication. Growth accelerators include the continued innovation in AI and ML for more sophisticated behavioral analytics, the expansion of cloud-based solutions, and strategic partnerships that create comprehensive security ecosystems. Emerging opportunities in the IoT and burgeoning economies, coupled with a growing emphasis on privacy-centric technologies, will further fuel market expansion. Companies that focus on user experience, continuous innovation, and addressing regulatory nuances will be well-positioned to capitalize on the substantial future market potential.
Passive Biometrics Verification Industry Segmentation
-
1. Component
- 1.1. Software
- 1.2. Services
-
2. Deployment Type
- 2.1. On-premises
- 2.2. Cloud
-
3. End-User Industry
- 3.1. BFSI
- 3.2. Retail
- 3.3. IT and Telecom
- 3.4. Helathcare
- 3.5. Government
- 3.6. Other End-User Inustries
Passive Biometrics Verification Industry Segmentation By Geography
- 1. North America
- 2. Europe
- 3. Asia Pacific
- 4. Latin America
- 5. Middle East and Africa
Passive Biometrics Verification Industry Regional Market Share
Geographic Coverage of Passive Biometrics Verification Industry
Passive Biometrics Verification Industry REPORT HIGHLIGHTS
| Aspects | Details |
|---|---|
| Study Period | 2020-2034 |
| Base Year | 2025 |
| Estimated Year | 2026 |
| Forecast Period | 2026-2034 |
| Historical Period | 2020-2025 |
| Growth Rate | CAGR of 15.4% from 2020-2034 |
| Segmentation |
|
Table of Contents
- 1. Introduction
- 1.1. Research Scope
- 1.2. Market Segmentation
- 1.3. Research Objective
- 1.4. Definitions and Assumptions
- 2. Executive Summary
- 2.1. Market Snapshot
- 3. Market Dynamics
- 3.1. Market Drivers
- 3.2. Market Restrains
- 3.3. Market Trends
- 3.4. Market Opportunities
- 4. Market Factor Analysis
- 4.1. Porters Five Forces
- 4.1.1. Bargaining Power of Suppliers
- 4.1.2. Bargaining Power of Buyers
- 4.1.3. Threat of New Entrants
- 4.1.4. Threat of Substitutes
- 4.1.5. Competitive Rivalry
- 4.2. PESTEL analysis
- 4.3. BCG Analysis
- 4.3.1. Stars (High Growth, High Market Share)
- 4.3.2. Cash Cows (Low Growth, High Market Share)
- 4.3.3. Question Mark (High Growth, Low Market Share)
- 4.3.4. Dogs (Low Growth, Low Market Share)
- 4.4. Ansoff Matrix Analysis
- 4.5. Supply Chain Analysis
- 4.6. Regulatory Landscape
- 4.7. Current Market Potential and Opportunity Assessment (TAM–SAM–SOM Framework)
- 4.8. MSR Analyst Note
- 4.1. Porters Five Forces
- 5. Market Analysis, Insights and Forecast 2021-2033
- 5.1. Market Analysis, Insights and Forecast - by Component
- 5.1.1. Software
- 5.1.2. Services
- 5.2. Market Analysis, Insights and Forecast - by Deployment Type
- 5.2.1. On-premises
- 5.2.2. Cloud
- 5.3. Market Analysis, Insights and Forecast - by End-User Industry
- 5.3.1. BFSI
- 5.3.2. Retail
- 5.3.3. IT and Telecom
- 5.3.4. Helathcare
- 5.3.5. Government
- 5.3.6. Other End-User Inustries
- 5.4. Market Analysis, Insights and Forecast - by Region
- 5.4.1. North America
- 5.4.2. Europe
- 5.4.3. Asia Pacific
- 5.4.4. Latin America
- 5.4.5. Middle East and Africa
- 5.1. Market Analysis, Insights and Forecast - by Component
- 6. Global Passive Biometrics Verification Industry Analysis, Insights and Forecast, 2021-2033
- 6.1. Market Analysis, Insights and Forecast - by Component
- 6.1.1. Software
- 6.1.2. Services
- 6.2. Market Analysis, Insights and Forecast - by Deployment Type
- 6.2.1. On-premises
- 6.2.2. Cloud
- 6.3. Market Analysis, Insights and Forecast - by End-User Industry
- 6.3.1. BFSI
- 6.3.2. Retail
- 6.3.3. IT and Telecom
- 6.3.4. Helathcare
- 6.3.5. Government
- 6.3.6. Other End-User Inustries
- 6.1. Market Analysis, Insights and Forecast - by Component
- 7. North America Passive Biometrics Verification Industry Analysis, Insights and Forecast, 2020-2032
- 7.1. Market Analysis, Insights and Forecast - by Component
- 7.1.1. Software
- 7.1.2. Services
- 7.2. Market Analysis, Insights and Forecast - by Deployment Type
- 7.2.1. On-premises
- 7.2.2. Cloud
- 7.3. Market Analysis, Insights and Forecast - by End-User Industry
- 7.3.1. BFSI
- 7.3.2. Retail
- 7.3.3. IT and Telecom
- 7.3.4. Helathcare
- 7.3.5. Government
- 7.3.6. Other End-User Inustries
- 7.1. Market Analysis, Insights and Forecast - by Component
- 8. Europe Passive Biometrics Verification Industry Analysis, Insights and Forecast, 2020-2032
- 8.1. Market Analysis, Insights and Forecast - by Component
- 8.1.1. Software
- 8.1.2. Services
- 8.2. Market Analysis, Insights and Forecast - by Deployment Type
- 8.2.1. On-premises
- 8.2.2. Cloud
- 8.3. Market Analysis, Insights and Forecast - by End-User Industry
- 8.3.1. BFSI
- 8.3.2. Retail
- 8.3.3. IT and Telecom
- 8.3.4. Helathcare
- 8.3.5. Government
- 8.3.6. Other End-User Inustries
- 8.1. Market Analysis, Insights and Forecast - by Component
- 9. Asia Pacific Passive Biometrics Verification Industry Analysis, Insights and Forecast, 2020-2032
- 9.1. Market Analysis, Insights and Forecast - by Component
- 9.1.1. Software
- 9.1.2. Services
- 9.2. Market Analysis, Insights and Forecast - by Deployment Type
- 9.2.1. On-premises
- 9.2.2. Cloud
- 9.3. Market Analysis, Insights and Forecast - by End-User Industry
- 9.3.1. BFSI
- 9.3.2. Retail
- 9.3.3. IT and Telecom
- 9.3.4. Helathcare
- 9.3.5. Government
- 9.3.6. Other End-User Inustries
- 9.1. Market Analysis, Insights and Forecast - by Component
- 10. Latin America Passive Biometrics Verification Industry Analysis, Insights and Forecast, 2020-2032
- 10.1. Market Analysis, Insights and Forecast - by Component
- 10.1.1. Software
- 10.1.2. Services
- 10.2. Market Analysis, Insights and Forecast - by Deployment Type
- 10.2.1. On-premises
- 10.2.2. Cloud
- 10.3. Market Analysis, Insights and Forecast - by End-User Industry
- 10.3.1. BFSI
- 10.3.2. Retail
- 10.3.3. IT and Telecom
- 10.3.4. Helathcare
- 10.3.5. Government
- 10.3.6. Other End-User Inustries
- 10.1. Market Analysis, Insights and Forecast - by Component
- 11. Middle East and Africa Passive Biometrics Verification Industry Analysis, Insights and Forecast, 2020-2032
- 11.1. Market Analysis, Insights and Forecast - by Component
- 11.1.1. Software
- 11.1.2. Services
- 11.2. Market Analysis, Insights and Forecast - by Deployment Type
- 11.2.1. On-premises
- 11.2.2. Cloud
- 11.3. Market Analysis, Insights and Forecast - by End-User Industry
- 11.3.1. BFSI
- 11.3.2. Retail
- 11.3.3. IT and Telecom
- 11.3.4. Helathcare
- 11.3.5. Government
- 11.3.6. Other End-User Inustries
- 11.1. Market Analysis, Insights and Forecast - by Component
- 12. Competitive Analysis
- 12.1. Company Profiles
- 12.1.1 Nuance Communications Inc
- 12.1.1.1. Company Overview
- 12.1.1.2. Products
- 12.1.1.3. Company Financials
- 12.1.1.4. SWOT Analysis
- 12.1.2 IBM Corporation
- 12.1.2.1. Company Overview
- 12.1.2.2. Products
- 12.1.2.3. Company Financials
- 12.1.2.4. SWOT Analysis
- 12.1.3 ID R&D Inc
- 12.1.3.1. Company Overview
- 12.1.3.2. Products
- 12.1.3.3. Company Financials
- 12.1.3.4. SWOT Analysis
- 12.1.4 Thales Group (Gemalto N V )
- 12.1.4.1. Company Overview
- 12.1.4.2. Products
- 12.1.4.3. Company Financials
- 12.1.4.4. SWOT Analysis
- 12.1.5 Cisco Systems Inc
- 12.1.5.1. Company Overview
- 12.1.5.2. Products
- 12.1.5.3. Company Financials
- 12.1.5.4. SWOT Analysis
- 12.1.6 Aware Inc
- 12.1.6.1. Company Overview
- 12.1.6.2. Products
- 12.1.6.3. Company Financials
- 12.1.6.4. SWOT Analysis
- 12.1.7 Pindrop Security Inc
- 12.1.7.1. Company Overview
- 12.1.7.2. Products
- 12.1.7.3. Company Financials
- 12.1.7.4. SWOT Analysis
- 12.1.8 Verint Systems Inc
- 12.1.8.1. Company Overview
- 12.1.8.2. Products
- 12.1.8.3. Company Financials
- 12.1.8.4. SWOT Analysis
- 12.1.9 OneSpan Inc
- 12.1.9.1. Company Overview
- 12.1.9.2. Products
- 12.1.9.3. Company Financials
- 12.1.9.4. SWOT Analysis
- 12.1.10 NEC Corporation
- 12.1.10.1. Company Overview
- 12.1.10.2. Products
- 12.1.10.3. Company Financials
- 12.1.10.4. SWOT Analysis
- 12.1.11 Fortress Identity*List Not Exhaustive
- 12.1.11.1. Company Overview
- 12.1.11.2. Products
- 12.1.11.3. Company Financials
- 12.1.11.4. SWOT Analysis
- 12.1.12 Equifax Inc
- 12.1.12.1. Company Overview
- 12.1.12.2. Products
- 12.1.12.3. Company Financials
- 12.1.12.4. SWOT Analysis
- 12.1.13 BioCatch Ltd
- 12.1.13.1. Company Overview
- 12.1.13.2. Products
- 12.1.13.3. Company Financials
- 12.1.13.4. SWOT Analysis
- 12.1.1 Nuance Communications Inc
- 12.2. Market Entropy
- 12.2.1 Company's Key Areas Served
- 12.2.2 Recent Developments
- 12.3. Company Market Share Analysis 2025
- 12.3.1 Top 5 Companies Market Share Analysis
- 12.3.2 Top 3 Companies Market Share Analysis
- 12.4. List of Potential Customers
- 13. Research Methodology
List of Figures
- Figure 1: Global Passive Biometrics Verification Industry Revenue Breakdown (billion, %) by Region 2025 & 2033
- Figure 2: North America Passive Biometrics Verification Industry Revenue (billion), by Component 2025 & 2033
- Figure 3: North America Passive Biometrics Verification Industry Revenue Share (%), by Component 2025 & 2033
- Figure 4: North America Passive Biometrics Verification Industry Revenue (billion), by Deployment Type 2025 & 2033
- Figure 5: North America Passive Biometrics Verification Industry Revenue Share (%), by Deployment Type 2025 & 2033
- Figure 6: North America Passive Biometrics Verification Industry Revenue (billion), by End-User Industry 2025 & 2033
- Figure 7: North America Passive Biometrics Verification Industry Revenue Share (%), by End-User Industry 2025 & 2033
- Figure 8: North America Passive Biometrics Verification Industry Revenue (billion), by Country 2025 & 2033
- Figure 9: North America Passive Biometrics Verification Industry Revenue Share (%), by Country 2025 & 2033
- Figure 10: Europe Passive Biometrics Verification Industry Revenue (billion), by Component 2025 & 2033
- Figure 11: Europe Passive Biometrics Verification Industry Revenue Share (%), by Component 2025 & 2033
- Figure 12: Europe Passive Biometrics Verification Industry Revenue (billion), by Deployment Type 2025 & 2033
- Figure 13: Europe Passive Biometrics Verification Industry Revenue Share (%), by Deployment Type 2025 & 2033
- Figure 14: Europe Passive Biometrics Verification Industry Revenue (billion), by End-User Industry 2025 & 2033
- Figure 15: Europe Passive Biometrics Verification Industry Revenue Share (%), by End-User Industry 2025 & 2033
- Figure 16: Europe Passive Biometrics Verification Industry Revenue (billion), by Country 2025 & 2033
- Figure 17: Europe Passive Biometrics Verification Industry Revenue Share (%), by Country 2025 & 2033
- Figure 18: Asia Pacific Passive Biometrics Verification Industry Revenue (billion), by Component 2025 & 2033
- Figure 19: Asia Pacific Passive Biometrics Verification Industry Revenue Share (%), by Component 2025 & 2033
- Figure 20: Asia Pacific Passive Biometrics Verification Industry Revenue (billion), by Deployment Type 2025 & 2033
- Figure 21: Asia Pacific Passive Biometrics Verification Industry Revenue Share (%), by Deployment Type 2025 & 2033
- Figure 22: Asia Pacific Passive Biometrics Verification Industry Revenue (billion), by End-User Industry 2025 & 2033
- Figure 23: Asia Pacific Passive Biometrics Verification Industry Revenue Share (%), by End-User Industry 2025 & 2033
- Figure 24: Asia Pacific Passive Biometrics Verification Industry Revenue (billion), by Country 2025 & 2033
- Figure 25: Asia Pacific Passive Biometrics Verification Industry Revenue Share (%), by Country 2025 & 2033
- Figure 26: Latin America Passive Biometrics Verification Industry Revenue (billion), by Component 2025 & 2033
- Figure 27: Latin America Passive Biometrics Verification Industry Revenue Share (%), by Component 2025 & 2033
- Figure 28: Latin America Passive Biometrics Verification Industry Revenue (billion), by Deployment Type 2025 & 2033
- Figure 29: Latin America Passive Biometrics Verification Industry Revenue Share (%), by Deployment Type 2025 & 2033
- Figure 30: Latin America Passive Biometrics Verification Industry Revenue (billion), by End-User Industry 2025 & 2033
- Figure 31: Latin America Passive Biometrics Verification Industry Revenue Share (%), by End-User Industry 2025 & 2033
- Figure 32: Latin America Passive Biometrics Verification Industry Revenue (billion), by Country 2025 & 2033
- Figure 33: Latin America Passive Biometrics Verification Industry Revenue Share (%), by Country 2025 & 2033
- Figure 34: Middle East and Africa Passive Biometrics Verification Industry Revenue (billion), by Component 2025 & 2033
- Figure 35: Middle East and Africa Passive Biometrics Verification Industry Revenue Share (%), by Component 2025 & 2033
- Figure 36: Middle East and Africa Passive Biometrics Verification Industry Revenue (billion), by Deployment Type 2025 & 2033
- Figure 37: Middle East and Africa Passive Biometrics Verification Industry Revenue Share (%), by Deployment Type 2025 & 2033
- Figure 38: Middle East and Africa Passive Biometrics Verification Industry Revenue (billion), by End-User Industry 2025 & 2033
- Figure 39: Middle East and Africa Passive Biometrics Verification Industry Revenue Share (%), by End-User Industry 2025 & 2033
- Figure 40: Middle East and Africa Passive Biometrics Verification Industry Revenue (billion), by Country 2025 & 2033
- Figure 41: Middle East and Africa Passive Biometrics Verification Industry Revenue Share (%), by Country 2025 & 2033
List of Tables
- Table 1: Global Passive Biometrics Verification Industry Revenue billion Forecast, by Component 2020 & 2033
- Table 2: Global Passive Biometrics Verification Industry Revenue billion Forecast, by Deployment Type 2020 & 2033
- Table 3: Global Passive Biometrics Verification Industry Revenue billion Forecast, by End-User Industry 2020 & 2033
- Table 4: Global Passive Biometrics Verification Industry Revenue billion Forecast, by Region 2020 & 2033
- Table 5: Global Passive Biometrics Verification Industry Revenue billion Forecast, by Component 2020 & 2033
- Table 6: Global Passive Biometrics Verification Industry Revenue billion Forecast, by Deployment Type 2020 & 2033
- Table 7: Global Passive Biometrics Verification Industry Revenue billion Forecast, by End-User Industry 2020 & 2033
- Table 8: Global Passive Biometrics Verification Industry Revenue billion Forecast, by Country 2020 & 2033
- Table 9: Global Passive Biometrics Verification Industry Revenue billion Forecast, by Component 2020 & 2033
- Table 10: Global Passive Biometrics Verification Industry Revenue billion Forecast, by Deployment Type 2020 & 2033
- Table 11: Global Passive Biometrics Verification Industry Revenue billion Forecast, by End-User Industry 2020 & 2033
- Table 12: Global Passive Biometrics Verification Industry Revenue billion Forecast, by Country 2020 & 2033
- Table 13: Global Passive Biometrics Verification Industry Revenue billion Forecast, by Component 2020 & 2033
- Table 14: Global Passive Biometrics Verification Industry Revenue billion Forecast, by Deployment Type 2020 & 2033
- Table 15: Global Passive Biometrics Verification Industry Revenue billion Forecast, by End-User Industry 2020 & 2033
- Table 16: Global Passive Biometrics Verification Industry Revenue billion Forecast, by Country 2020 & 2033
- Table 17: Global Passive Biometrics Verification Industry Revenue billion Forecast, by Component 2020 & 2033
- Table 18: Global Passive Biometrics Verification Industry Revenue billion Forecast, by Deployment Type 2020 & 2033
- Table 19: Global Passive Biometrics Verification Industry Revenue billion Forecast, by End-User Industry 2020 & 2033
- Table 20: Global Passive Biometrics Verification Industry Revenue billion Forecast, by Country 2020 & 2033
- Table 21: Global Passive Biometrics Verification Industry Revenue billion Forecast, by Component 2020 & 2033
- Table 22: Global Passive Biometrics Verification Industry Revenue billion Forecast, by Deployment Type 2020 & 2033
- Table 23: Global Passive Biometrics Verification Industry Revenue billion Forecast, by End-User Industry 2020 & 2033
- Table 24: Global Passive Biometrics Verification Industry Revenue billion Forecast, by Country 2020 & 2033
Frequently Asked Questions
1. What is the projected Compound Annual Growth Rate (CAGR) of the Passive Biometrics Verification Industry?
The projected CAGR is approximately 15.4%.
2. Which companies are prominent players in the Passive Biometrics Verification Industry?
Key companies in the market include Nuance Communications Inc, IBM Corporation, ID R&D Inc, Thales Group (Gemalto N V ), Cisco Systems Inc, Aware Inc, Pindrop Security Inc, Verint Systems Inc, OneSpan Inc, NEC Corporation, Fortress Identity*List Not Exhaustive, Equifax Inc, BioCatch Ltd.
3. What are the main segments of the Passive Biometrics Verification Industry?
The market segments include Component, Deployment Type, End-User Industry.
4. Can you provide details about the market size?
The market size is estimated to be USD 14.34 billion as of 2022.
5. What are some drivers contributing to market growth?
; Growing incidents related of fraud. scams. and data breach attacks; Rising need for better authentication systems to enhance the user experience.
6. What are the notable trends driving market growth?
BFSI is Expected Hold Significant Share.
7. Are there any restraints impacting market growth?
; Concerns related to privacy regarding actions running in the background.
8. Can you provide examples of recent developments in the market?
N/A
9. What pricing options are available for accessing the report?
Pricing options include single-user, multi-user, and enterprise licenses priced at USD 4750, USD 5250, and USD 8750 respectively.
10. Is the market size provided in terms of value or volume?
The market size is provided in terms of value, measured in billion.
11. Are there any specific market keywords associated with the report?
Yes, the market keyword associated with the report is "Passive Biometrics Verification Industry," which aids in identifying and referencing the specific market segment covered.
12. How do I determine which pricing option suits my needs best?
The pricing options vary based on user requirements and access needs. Individual users may opt for single-user licenses, while businesses requiring broader access may choose multi-user or enterprise licenses for cost-effective access to the report.
13. Are there any additional resources or data provided in the Passive Biometrics Verification Industry report?
While the report offers comprehensive insights, it's advisable to review the specific contents or supplementary materials provided to ascertain if additional resources or data are available.
14. How can I stay updated on further developments or reports in the Passive Biometrics Verification Industry?
To stay informed about further developments, trends, and reports in the Passive Biometrics Verification Industry, consider subscribing to industry newsletters, following relevant companies and organizations, or regularly checking reputable industry news sources and publications.
Methodology
Step 1 - Identification of Relevant Samples Size from Population Database


Step 2 - Approaches for Defining Global Market Size (Value, Volume* & Price*)

Note*: In applicable scenarios
Step 3 - Data Sources
Primary Research
- Web Analytics
- Survey Reports
- Research Institute
- Latest Research Reports
- Opinion Leaders
Secondary Research
- Annual Reports
- White Paper
- Latest Press Release
- Industry Association
- Paid Database
- Investor Presentations

Step 4 - Data Triangulation
Involves using different sources of information in order to increase the validity of a study
These sources are likely to be stakeholders in a program - participants, other researchers, program staff, other community members, and so on.
Then we put all data in single framework & apply various statistical tools to find out the dynamic on the market.
During the analysis stage, feedback from the stakeholder groups would be compared to determine areas of agreement as well as areas of divergence