

Key Insights
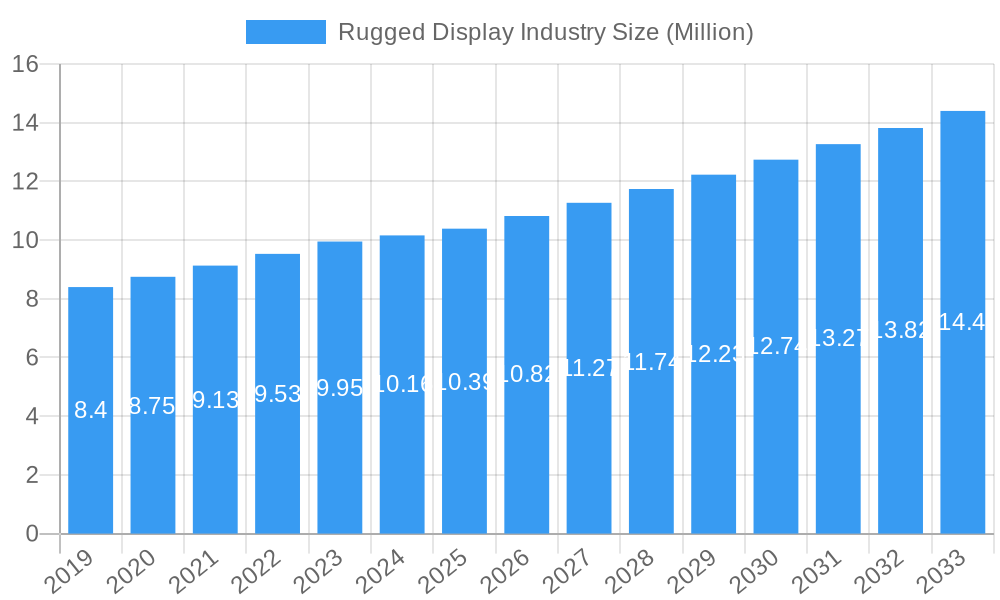
The global rugged display market is poised for robust growth, projected to reach $10.39 billion in value by 2025, expanding at a Compound Annual Growth Rate (CAGR) of 4.43%. This sustained expansion is driven by an escalating demand for durable and reliable display solutions across a multitude of demanding industries. The increasing adoption of advanced technologies like IoT and AI in harsh environments, coupled with stringent safety regulations in sectors such as defense, aerospace, and industrial automation, are primary catalysts for this market's upward trajectory. Furthermore, the continuous innovation in display technology, leading to enhanced performance in extreme temperatures, vibration, and shock, further fuels the adoption of rugged displays.
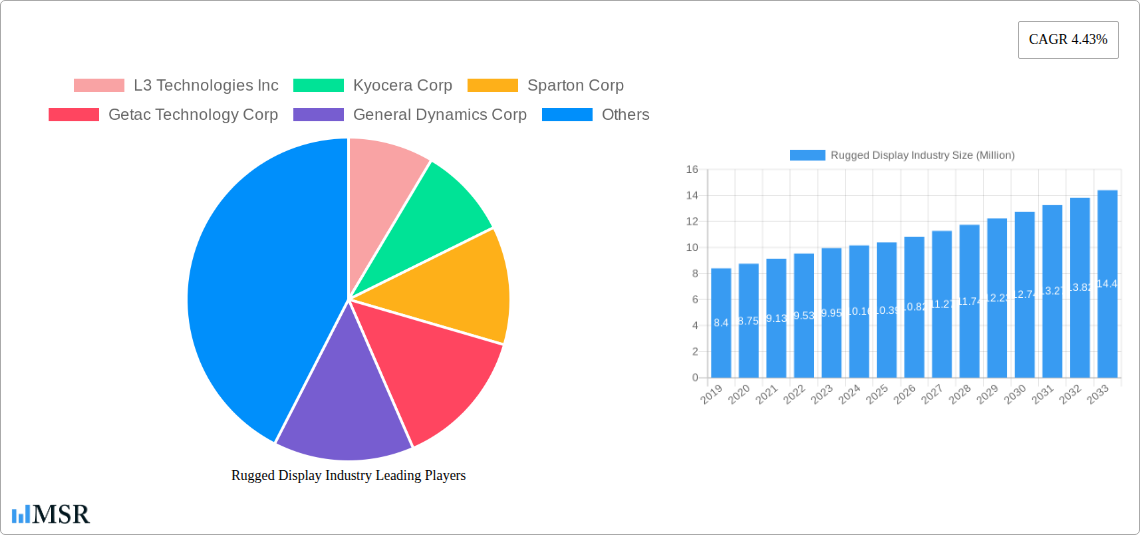
Rugged Display Industry Market Size (In Million)
The market segmentation reveals a dynamic landscape, with Smartphone and Handheld Computers and Tablet PCs emerging as significant contributors due to their increasing use in field service, logistics, and public safety applications. The Industrial, Automotive and Transportation, and Government, Defense, and Aerospace sectors are expected to remain dominant end-users, leveraging rugged displays for critical operations and mission-critical applications. While the market presents significant opportunities, challenges such as high manufacturing costs and the rapid pace of technological obsolescence could pose restraints. However, strategic collaborations among key players and a focus on developing cost-effective, yet highly durable, solutions are expected to mitigate these challenges and ensure continued market prosperity.
Rugged Display Industry Company Market Share
This in-depth report provides a thorough analysis of the rugged display industry, covering market dynamics, key trends, leading segments, product innovations, challenges, growth drivers, and emerging opportunities. With a study period spanning from 2019 to 2033, including historical data from 2019–2024 and a forecast from 2025–2033, this report offers invaluable insights for industry stakeholders, investors, and decision-makers. The rugged display market is projected to reach a substantial valuation by 2025, driven by increasing demand across diverse sectors like defense and aerospace, industrial automation, and oil and gas. This report will equip you with the strategic intelligence needed to navigate this dynamic and rapidly evolving market, projected to grow at a CAGR of xx% during the forecast period.
Rugged Display Industry Market Concentration & Dynamics
The rugged display market exhibits a moderate to high level of concentration, with key players like Panasonic Corporation, General Dynamics Corp, Kyocera Corp, and Getac Technology Corp holding significant market share. The innovation ecosystem is robust, fueled by continuous advancements in display technologies, such as enhanced brightness, improved sunlight readability, and advanced touch capabilities. Regulatory frameworks, particularly in the defense and aviation sectors, play a crucial role in dictating product specifications and adoption rates. Substitute products, like consumer-grade tablets with protective cases, are present but often fall short in meeting the stringent durability and performance requirements of professional applications. End-user trends show a growing preference for lighter, more powerful, and highly integrated rugged devices. Mergers and acquisitions (M&A) activities are anticipated to shape the competitive landscape further, with an estimated XX M&A deals recorded during the historical period. The market share of the top 5 players is estimated to be around XX% as of the base year 2025.
Rugged Display Industry Industry Insights & Trends
The rugged display industry is experiencing robust growth, driven by the escalating adoption of sophisticated electronic devices in harsh and demanding environments. The market size is projected to reach approximately $XX Million by 2025, with an estimated Compound Annual Growth Rate (CAGR) of xx% during the forecast period (2025–2033). Key growth drivers include the increasing need for reliable mobile computing solutions in sectors such as oil and gas exploration, field services, and emergency response. Technological disruptions, including the integration of IoT capabilities, advanced sensor technology, and enhanced battery life, are transforming the market. Evolving consumer behaviors are also contributing to market expansion, with a growing expectation for durable, high-performance devices that can withstand extreme temperatures, shocks, vibrations, and water ingress. The demand for fully-rugged and ultra-rugged displays is particularly high in mission-critical applications where device failure is not an option. The integration of advanced operating systems like Android and Windows ensures compatibility and ease of use for a wide range of applications, further fueling market adoption. The development of specialized avionics displays and vehicle-mounted computers for defense and transportation sectors is another significant trend, reflecting the industry's commitment to providing tailored solutions for specific end-user needs.
Key Markets & Segments Leading Rugged Display Industry
The rugged display industry is characterized by strong performance across several key markets and segments, with Government, Defense, and Aerospace emerging as a dominant end-user sector. This segment's demand is propelled by national security initiatives, modernized military equipment, and the critical need for reliable communication and operational displays in challenging terrains and combat situations. Within Product Type, Tablet PC and Laptop and Notebook segments are witnessing substantial growth due to their versatility and portability for field operations. The Avionics Display segment, while niche, is crucial for air safety and operational efficiency in aircraft.
Level of Ruggedness: The Fully-rugged and Ultra-rugged categories are leading the market, reflecting the extreme operational conditions faced by users in defense, oil and gas, and industrial sectors. These devices are designed to meet stringent MIL-STD-810G/H and IP ratings, ensuring resilience against drops, dust, water, and extreme temperatures. The Semi-rugged segment, however, offers a balance of durability and affordability, finding traction in less severe environments like retail or light industrial settings.
Operating System: Windows remains a dominant operating system due to its widespread enterprise compatibility and software support, particularly in industrial and defense applications. However, Android is rapidly gaining ground, driven by its user-friendly interface, app ecosystem, and cost-effectiveness, especially in logistics, warehousing, and field service operations.
End User: Beyond Government, Defense, and Aerospace, the Industrial sector is a significant driver, with a growing need for rugged devices in manufacturing, logistics, and utility management. The Oil and Gas sector also relies heavily on these robust displays for exploration, production, and maintenance in remote and hazardous locations. The Automotive and Transportation sector is increasingly adopting rugged solutions for in-vehicle computing, fleet management, and driver safety.
Drivers for Dominance in Defense and Aerospace:
- Increased defense spending and modernization programs globally.
- Stringent regulatory requirements for military-grade hardware.
- Need for battlefield intelligence and secure communication.
- Development of advanced aircraft and naval systems.
Drivers for Dominance in Industrial Sector:
- Rise of Industry 4.0 and smart manufacturing initiatives.
- Demand for real-time data collection and analytics in harsh factory environments.
- Increased focus on worker safety and efficiency.
- Growth in logistics and supply chain management solutions.
The Panel PC and Mission-critical Display segments are also experiencing strong demand due to their integration capabilities in control rooms, command centers, and specialized equipment, supporting operational continuity and decision-making.
Rugged Display Industry Product Developments
Product innovation in the rugged display industry is centered on enhancing durability, performance, and user experience in extreme conditions. Key advancements include the integration of brighter, higher-resolution displays with superior sunlight readability, improved touch sensitivity that works with gloves and in wet conditions, and longer-lasting battery solutions. The incorporation of advanced connectivity options, such as 5G and Wi-Fi 6, alongside enhanced processing power, enables real-time data transmission and complex application execution. Furthermore, the development of specialized form factors, like fully integrated vehicle-mounted computers and compact mission-critical displays, caters to specific end-user requirements, providing a competitive edge in specialized markets.
Challenges in the Rugged Display Industry Market
The rugged display industry faces several challenges that can impact market growth. High manufacturing costs associated with robust materials and rigorous testing processes can lead to higher price points, potentially limiting adoption in price-sensitive markets. Supply chain disruptions, particularly for specialized components, can affect production timelines and availability, as observed during the historical period. Intense competition from both established players and new entrants necessitates continuous innovation and competitive pricing strategies. Furthermore, evolving technological standards and the need for constant product upgrades to meet new functional requirements pose ongoing development challenges for manufacturers.
Forces Driving Rugged Display Industry Growth
Several key forces are propelling the growth of the rugged display industry. The increasing digitization of industries and the subsequent need for reliable mobile computing solutions in harsh environments are primary drivers. The continuous expansion of the Oil and Gas, Government, Defense, and Aerospace, and Industrial sectors fuels demand for durable devices capable of withstanding extreme conditions. Furthermore, government initiatives supporting technological advancement and modernization in defense and infrastructure projects are significant catalysts. The growing trend towards remote work and field operations across various industries also necessitates the use of resilient technology.
Challenges in the Rugged Display Industry Market
Long-term growth catalysts for the rugged display industry lie in persistent technological innovation and strategic market expansion. The development of next-generation display technologies, such as microLED and advanced flexible displays, promises enhanced performance and new application possibilities. Strategic partnerships and collaborations between display manufacturers and end-user solution providers are crucial for developing integrated offerings tailored to specific industry needs. Furthermore, the expansion into emerging geographical markets with developing industrial infrastructures and increasing adoption of rugged technology presents significant long-term growth opportunities.
Emerging Opportunities in Rugged Display Industry
Emerging opportunities in the rugged display industry are abundant. The burgeoning Internet of Things (IoT) ecosystem presents a vast potential for rugged devices equipped with advanced sensors and connectivity to act as robust data collection nodes in industrial, agricultural, and environmental monitoring applications. The rapid advancements in augmented reality (AR) and virtual reality (VR) technologies are creating demand for rugged displays that can seamlessly integrate with AR/VR headsets and provide immersive field experiences. The growing focus on predictive maintenance and AI-driven analytics in various industries will also necessitate rugged devices capable of processing and transmitting large volumes of data in real-time. Furthermore, the healthcare sector's increasing reliance on mobile diagnostic tools and patient monitoring systems in challenging environments offers a promising avenue for growth.
Leading Players in the Rugged Display Industry Sector
- L3 Technologies Inc
- Kyocera Corp
- Sparton Corp
- Getac Technology Corp
- General Dynamics Corp
- Dell Inc
- Xplore Technologies Corp
- Beijer Electronics AB
- Zebra Technologies Corp
- Esterline Technologies Corp
- Curtiss-Wright Corp
- Panasonic Corporation
Key Milestones in Rugged Display Industry Industry
- 2019: Increased adoption of 5G technology in rugged devices, enabling faster data transfer for field applications.
- 2020: Heightened demand for rugged tablets and laptops for remote work and essential services due to global events.
- 2021: Significant advancements in battery technology, offering extended operational life for rugged devices in remote locations.
- 2022: Introduction of more energy-efficient display technologies for rugged devices, improving overall device performance.
- 2023: Growing integration of AI and machine learning capabilities within rugged devices for enhanced data analytics and predictive maintenance.
- 2024: Expansion of IoT connectivity features in rugged devices, facilitating seamless integration into smart industrial and urban environments.
- 2025 (Projected): Widespread adoption of advanced touch technologies for rugged displays, enabling functionality with gloves and in wet conditions.
- 2026-2033 (Forecast): Continued innovation in display brightness, resolution, and durability, alongside the integration of emerging display technologies like microLED.
Strategic Outlook for Rugged Display Industry Market
The strategic outlook for the rugged display industry is exceptionally positive, driven by continuous technological advancements and expanding market penetration. Key growth accelerators include the increasing demand for IoT-enabled rugged devices, the development of specialized solutions for emerging sectors like smart agriculture and renewable energy, and the ongoing miniaturization and performance enhancement of rugged computing hardware. The strategic focus on offering customized solutions, enhancing user interface designs, and ensuring robust cybersecurity for connected rugged devices will be paramount for sustained market leadership and capturing future growth opportunities. The industry is poised for significant expansion through 2033.
Rugged Display Industry Segmentation
-
1. Product Type
- 1.1. Smartphone and Handheld Computer
- 1.2. Tablet PC
- 1.3. Laptop and Notebook
- 1.4. Avionics Display
- 1.5. Vehicle-mounted Computer
- 1.6. Panel PC and Mission-critical Display
-
2. Level of Ruggedness
- 2.1. Semi-rugged
- 2.2. Fully-rugged
- 2.3. Ultra-rugged
-
3. Operating System
- 3.1. Android
- 3.2. Windows
- 3.3. Other Operating Systems
-
4. End User
- 4.1. Oil and Gas
- 4.2. Government, Defense, and Aerospace
- 4.3. Industrial
- 4.4. Automotive and Transportation
- 4.5. Healthcare
- 4.6. Other End Users
Rugged Display Industry Segmentation By Geography
- 1. North America
- 2. Europe
- 3. Asia Pacific
- 4. Latin America
- 5. Middle East and Africa
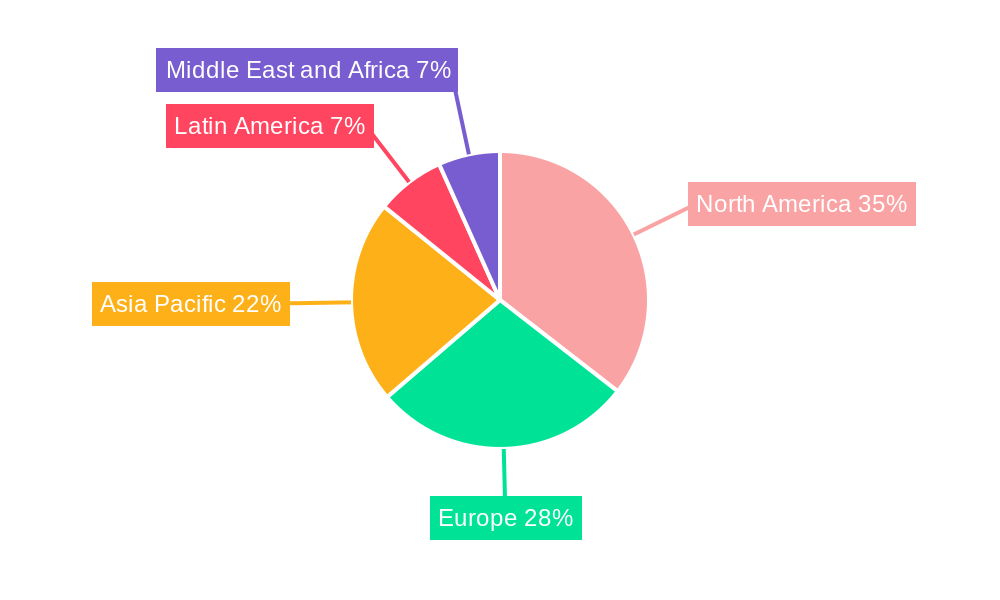
Rugged Display Industry Regional Market Share
Geographic Coverage of Rugged Display Industry
Rugged Display Industry REPORT HIGHLIGHTS
| Aspects | Details |
|---|---|
| Study Period | 2020-2034 |
| Base Year | 2025 |
| Estimated Year | 2026 |
| Forecast Period | 2026-2034 |
| Historical Period | 2020-2025 |
| Growth Rate | CAGR of 4.43% from 2020-2034 |
| Segmentation |
|
Table of Contents
- 1. Introduction
- 1.1. Research Scope
- 1.2. Market Segmentation
- 1.3. Research Objective
- 1.4. Definitions and Assumptions
- 2. Executive Summary
- 2.1. Market Snapshot
- 3. Market Dynamics
- 3.1. Market Drivers
- 3.2. Market Restrains
- 3.3. Market Trends
- 3.4. Market Opportunities
- 4. Market Factor Analysis
- 4.1. Porters Five Forces
- 4.1.1. Bargaining Power of Suppliers
- 4.1.2. Bargaining Power of Buyers
- 4.1.3. Threat of New Entrants
- 4.1.4. Threat of Substitutes
- 4.1.5. Competitive Rivalry
- 4.2. PESTEL analysis
- 4.3. BCG Analysis
- 4.3.1. Stars (High Growth, High Market Share)
- 4.3.2. Cash Cows (Low Growth, High Market Share)
- 4.3.3. Question Mark (High Growth, Low Market Share)
- 4.3.4. Dogs (Low Growth, Low Market Share)
- 4.4. Ansoff Matrix Analysis
- 4.5. Supply Chain Analysis
- 4.6. Regulatory Landscape
- 4.7. Current Market Potential and Opportunity Assessment (TAM–SAM–SOM Framework)
- 4.8. MSR Analyst Note
- 4.1. Porters Five Forces
- 5. Market Analysis, Insights and Forecast 2021-2033
- 5.1. Market Analysis, Insights and Forecast - by Product Type
- 5.1.1. Smartphone and Handheld Computer
- 5.1.2. Tablet PC
- 5.1.3. Laptop and Notebook
- 5.1.4. Avionics Display
- 5.1.5. Vehicle-mounted Computer
- 5.1.6. Panel PC and Mission-critical Display
- 5.2. Market Analysis, Insights and Forecast - by Level of Ruggedness
- 5.2.1. Semi-rugged
- 5.2.2. Fully-rugged
- 5.2.3. Ultra-rugged
- 5.3. Market Analysis, Insights and Forecast - by Operating System
- 5.3.1. Android
- 5.3.2. Windows
- 5.3.3. Other Operating Systems
- 5.4. Market Analysis, Insights and Forecast - by End User
- 5.4.1. Oil and Gas
- 5.4.2. Government, Defense, and Aerospace
- 5.4.3. Industrial
- 5.4.4. Automotive and Transportation
- 5.4.5. Healthcare
- 5.4.6. Other End Users
- 5.5. Market Analysis, Insights and Forecast - by Region
- 5.5.1. North America
- 5.5.2. Europe
- 5.5.3. Asia Pacific
- 5.5.4. Latin America
- 5.5.5. Middle East and Africa
- 5.1. Market Analysis, Insights and Forecast - by Product Type
- 6. Global Rugged Display Industry Analysis, Insights and Forecast, 2021-2033
- 6.1. Market Analysis, Insights and Forecast - by Product Type
- 6.1.1. Smartphone and Handheld Computer
- 6.1.2. Tablet PC
- 6.1.3. Laptop and Notebook
- 6.1.4. Avionics Display
- 6.1.5. Vehicle-mounted Computer
- 6.1.6. Panel PC and Mission-critical Display
- 6.2. Market Analysis, Insights and Forecast - by Level of Ruggedness
- 6.2.1. Semi-rugged
- 6.2.2. Fully-rugged
- 6.2.3. Ultra-rugged
- 6.3. Market Analysis, Insights and Forecast - by Operating System
- 6.3.1. Android
- 6.3.2. Windows
- 6.3.3. Other Operating Systems
- 6.4. Market Analysis, Insights and Forecast - by End User
- 6.4.1. Oil and Gas
- 6.4.2. Government, Defense, and Aerospace
- 6.4.3. Industrial
- 6.4.4. Automotive and Transportation
- 6.4.5. Healthcare
- 6.4.6. Other End Users
- 6.1. Market Analysis, Insights and Forecast - by Product Type
- 7. North America Rugged Display Industry Analysis, Insights and Forecast, 2020-2032
- 7.1. Market Analysis, Insights and Forecast - by Product Type
- 7.1.1. Smartphone and Handheld Computer
- 7.1.2. Tablet PC
- 7.1.3. Laptop and Notebook
- 7.1.4. Avionics Display
- 7.1.5. Vehicle-mounted Computer
- 7.1.6. Panel PC and Mission-critical Display
- 7.2. Market Analysis, Insights and Forecast - by Level of Ruggedness
- 7.2.1. Semi-rugged
- 7.2.2. Fully-rugged
- 7.2.3. Ultra-rugged
- 7.3. Market Analysis, Insights and Forecast - by Operating System
- 7.3.1. Android
- 7.3.2. Windows
- 7.3.3. Other Operating Systems
- 7.4. Market Analysis, Insights and Forecast - by End User
- 7.4.1. Oil and Gas
- 7.4.2. Government, Defense, and Aerospace
- 7.4.3. Industrial
- 7.4.4. Automotive and Transportation
- 7.4.5. Healthcare
- 7.4.6. Other End Users
- 7.1. Market Analysis, Insights and Forecast - by Product Type
- 8. Europe Rugged Display Industry Analysis, Insights and Forecast, 2020-2032
- 8.1. Market Analysis, Insights and Forecast - by Product Type
- 8.1.1. Smartphone and Handheld Computer
- 8.1.2. Tablet PC
- 8.1.3. Laptop and Notebook
- 8.1.4. Avionics Display
- 8.1.5. Vehicle-mounted Computer
- 8.1.6. Panel PC and Mission-critical Display
- 8.2. Market Analysis, Insights and Forecast - by Level of Ruggedness
- 8.2.1. Semi-rugged
- 8.2.2. Fully-rugged
- 8.2.3. Ultra-rugged
- 8.3. Market Analysis, Insights and Forecast - by Operating System
- 8.3.1. Android
- 8.3.2. Windows
- 8.3.3. Other Operating Systems
- 8.4. Market Analysis, Insights and Forecast - by End User
- 8.4.1. Oil and Gas
- 8.4.2. Government, Defense, and Aerospace
- 8.4.3. Industrial
- 8.4.4. Automotive and Transportation
- 8.4.5. Healthcare
- 8.4.6. Other End Users
- 8.1. Market Analysis, Insights and Forecast - by Product Type
- 9. Asia Pacific Rugged Display Industry Analysis, Insights and Forecast, 2020-2032
- 9.1. Market Analysis, Insights and Forecast - by Product Type
- 9.1.1. Smartphone and Handheld Computer
- 9.1.2. Tablet PC
- 9.1.3. Laptop and Notebook
- 9.1.4. Avionics Display
- 9.1.5. Vehicle-mounted Computer
- 9.1.6. Panel PC and Mission-critical Display
- 9.2. Market Analysis, Insights and Forecast - by Level of Ruggedness
- 9.2.1. Semi-rugged
- 9.2.2. Fully-rugged
- 9.2.3. Ultra-rugged
- 9.3. Market Analysis, Insights and Forecast - by Operating System
- 9.3.1. Android
- 9.3.2. Windows
- 9.3.3. Other Operating Systems
- 9.4. Market Analysis, Insights and Forecast - by End User
- 9.4.1. Oil and Gas
- 9.4.2. Government, Defense, and Aerospace
- 9.4.3. Industrial
- 9.4.4. Automotive and Transportation
- 9.4.5. Healthcare
- 9.4.6. Other End Users
- 9.1. Market Analysis, Insights and Forecast - by Product Type
- 10. Latin America Rugged Display Industry Analysis, Insights and Forecast, 2020-2032
- 10.1. Market Analysis, Insights and Forecast - by Product Type
- 10.1.1. Smartphone and Handheld Computer
- 10.1.2. Tablet PC
- 10.1.3. Laptop and Notebook
- 10.1.4. Avionics Display
- 10.1.5. Vehicle-mounted Computer
- 10.1.6. Panel PC and Mission-critical Display
- 10.2. Market Analysis, Insights and Forecast - by Level of Ruggedness
- 10.2.1. Semi-rugged
- 10.2.2. Fully-rugged
- 10.2.3. Ultra-rugged
- 10.3. Market Analysis, Insights and Forecast - by Operating System
- 10.3.1. Android
- 10.3.2. Windows
- 10.3.3. Other Operating Systems
- 10.4. Market Analysis, Insights and Forecast - by End User
- 10.4.1. Oil and Gas
- 10.4.2. Government, Defense, and Aerospace
- 10.4.3. Industrial
- 10.4.4. Automotive and Transportation
- 10.4.5. Healthcare
- 10.4.6. Other End Users
- 10.1. Market Analysis, Insights and Forecast - by Product Type
- 11. Middle East and Africa Rugged Display Industry Analysis, Insights and Forecast, 2020-2032
- 11.1. Market Analysis, Insights and Forecast - by Product Type
- 11.1.1. Smartphone and Handheld Computer
- 11.1.2. Tablet PC
- 11.1.3. Laptop and Notebook
- 11.1.4. Avionics Display
- 11.1.5. Vehicle-mounted Computer
- 11.1.6. Panel PC and Mission-critical Display
- 11.2. Market Analysis, Insights and Forecast - by Level of Ruggedness
- 11.2.1. Semi-rugged
- 11.2.2. Fully-rugged
- 11.2.3. Ultra-rugged
- 11.3. Market Analysis, Insights and Forecast - by Operating System
- 11.3.1. Android
- 11.3.2. Windows
- 11.3.3. Other Operating Systems
- 11.4. Market Analysis, Insights and Forecast - by End User
- 11.4.1. Oil and Gas
- 11.4.2. Government, Defense, and Aerospace
- 11.4.3. Industrial
- 11.4.4. Automotive and Transportation
- 11.4.5. Healthcare
- 11.4.6. Other End Users
- 11.1. Market Analysis, Insights and Forecast - by Product Type
- 12. Competitive Analysis
- 12.1. Company Profiles
- 12.1.1 L3 Technologies Inc
- 12.1.1.1. Company Overview
- 12.1.1.2. Products
- 12.1.1.3. Company Financials
- 12.1.1.4. SWOT Analysis
- 12.1.2 Kyocera Corp
- 12.1.2.1. Company Overview
- 12.1.2.2. Products
- 12.1.2.3. Company Financials
- 12.1.2.4. SWOT Analysis
- 12.1.3 Sparton Corp
- 12.1.3.1. Company Overview
- 12.1.3.2. Products
- 12.1.3.3. Company Financials
- 12.1.3.4. SWOT Analysis
- 12.1.4 Getac Technology Corp
- 12.1.4.1. Company Overview
- 12.1.4.2. Products
- 12.1.4.3. Company Financials
- 12.1.4.4. SWOT Analysis
- 12.1.5 General Dynamics Corp
- 12.1.5.1. Company Overview
- 12.1.5.2. Products
- 12.1.5.3. Company Financials
- 12.1.5.4. SWOT Analysis
- 12.1.6 Dell Inc
- 12.1.6.1. Company Overview
- 12.1.6.2. Products
- 12.1.6.3. Company Financials
- 12.1.6.4. SWOT Analysis
- 12.1.7 Xplore Technologies Corp
- 12.1.7.1. Company Overview
- 12.1.7.2. Products
- 12.1.7.3. Company Financials
- 12.1.7.4. SWOT Analysis
- 12.1.8 Beijer Electronics AB
- 12.1.8.1. Company Overview
- 12.1.8.2. Products
- 12.1.8.3. Company Financials
- 12.1.8.4. SWOT Analysis
- 12.1.9 Zebra Technologies Corp
- 12.1.9.1. Company Overview
- 12.1.9.2. Products
- 12.1.9.3. Company Financials
- 12.1.9.4. SWOT Analysis
- 12.1.10 Esterline Technologies Corp
- 12.1.10.1. Company Overview
- 12.1.10.2. Products
- 12.1.10.3. Company Financials
- 12.1.10.4. SWOT Analysis
- 12.1.11 Curtiss-Wright Corp
- 12.1.11.1. Company Overview
- 12.1.11.2. Products
- 12.1.11.3. Company Financials
- 12.1.11.4. SWOT Analysis
- 12.1.12 Panasonic Corporation
- 12.1.12.1. Company Overview
- 12.1.12.2. Products
- 12.1.12.3. Company Financials
- 12.1.12.4. SWOT Analysis
- 12.1.1 L3 Technologies Inc
- 12.2. Market Entropy
- 12.2.1 Company's Key Areas Served
- 12.2.2 Recent Developments
- 12.3. Company Market Share Analysis 2025
- 12.3.1 Top 5 Companies Market Share Analysis
- 12.3.2 Top 3 Companies Market Share Analysis
- 12.4. List of Potential Customers
- 13. Research Methodology
List of Figures
- Figure 1: Global Rugged Display Industry Revenue Breakdown (Million, %) by Region 2025 & 2033
- Figure 2: North America Rugged Display Industry Revenue (Million), by Product Type 2025 & 2033
- Figure 3: North America Rugged Display Industry Revenue Share (%), by Product Type 2025 & 2033
- Figure 4: North America Rugged Display Industry Revenue (Million), by Level of Ruggedness 2025 & 2033
- Figure 5: North America Rugged Display Industry Revenue Share (%), by Level of Ruggedness 2025 & 2033
- Figure 6: North America Rugged Display Industry Revenue (Million), by Operating System 2025 & 2033
- Figure 7: North America Rugged Display Industry Revenue Share (%), by Operating System 2025 & 2033
- Figure 8: North America Rugged Display Industry Revenue (Million), by End User 2025 & 2033
- Figure 9: North America Rugged Display Industry Revenue Share (%), by End User 2025 & 2033
- Figure 10: North America Rugged Display Industry Revenue (Million), by Country 2025 & 2033
- Figure 11: North America Rugged Display Industry Revenue Share (%), by Country 2025 & 2033
- Figure 12: Europe Rugged Display Industry Revenue (Million), by Product Type 2025 & 2033
- Figure 13: Europe Rugged Display Industry Revenue Share (%), by Product Type 2025 & 2033
- Figure 14: Europe Rugged Display Industry Revenue (Million), by Level of Ruggedness 2025 & 2033
- Figure 15: Europe Rugged Display Industry Revenue Share (%), by Level of Ruggedness 2025 & 2033
- Figure 16: Europe Rugged Display Industry Revenue (Million), by Operating System 2025 & 2033
- Figure 17: Europe Rugged Display Industry Revenue Share (%), by Operating System 2025 & 2033
- Figure 18: Europe Rugged Display Industry Revenue (Million), by End User 2025 & 2033
- Figure 19: Europe Rugged Display Industry Revenue Share (%), by End User 2025 & 2033
- Figure 20: Europe Rugged Display Industry Revenue (Million), by Country 2025 & 2033
- Figure 21: Europe Rugged Display Industry Revenue Share (%), by Country 2025 & 2033
- Figure 22: Asia Pacific Rugged Display Industry Revenue (Million), by Product Type 2025 & 2033
- Figure 23: Asia Pacific Rugged Display Industry Revenue Share (%), by Product Type 2025 & 2033
- Figure 24: Asia Pacific Rugged Display Industry Revenue (Million), by Level of Ruggedness 2025 & 2033
- Figure 25: Asia Pacific Rugged Display Industry Revenue Share (%), by Level of Ruggedness 2025 & 2033
- Figure 26: Asia Pacific Rugged Display Industry Revenue (Million), by Operating System 2025 & 2033
- Figure 27: Asia Pacific Rugged Display Industry Revenue Share (%), by Operating System 2025 & 2033
- Figure 28: Asia Pacific Rugged Display Industry Revenue (Million), by End User 2025 & 2033
- Figure 29: Asia Pacific Rugged Display Industry Revenue Share (%), by End User 2025 & 2033
- Figure 30: Asia Pacific Rugged Display Industry Revenue (Million), by Country 2025 & 2033
- Figure 31: Asia Pacific Rugged Display Industry Revenue Share (%), by Country 2025 & 2033
- Figure 32: Latin America Rugged Display Industry Revenue (Million), by Product Type 2025 & 2033
- Figure 33: Latin America Rugged Display Industry Revenue Share (%), by Product Type 2025 & 2033
- Figure 34: Latin America Rugged Display Industry Revenue (Million), by Level of Ruggedness 2025 & 2033
- Figure 35: Latin America Rugged Display Industry Revenue Share (%), by Level of Ruggedness 2025 & 2033
- Figure 36: Latin America Rugged Display Industry Revenue (Million), by Operating System 2025 & 2033
- Figure 37: Latin America Rugged Display Industry Revenue Share (%), by Operating System 2025 & 2033
- Figure 38: Latin America Rugged Display Industry Revenue (Million), by End User 2025 & 2033
- Figure 39: Latin America Rugged Display Industry Revenue Share (%), by End User 2025 & 2033
- Figure 40: Latin America Rugged Display Industry Revenue (Million), by Country 2025 & 2033
- Figure 41: Latin America Rugged Display Industry Revenue Share (%), by Country 2025 & 2033
- Figure 42: Middle East and Africa Rugged Display Industry Revenue (Million), by Product Type 2025 & 2033
- Figure 43: Middle East and Africa Rugged Display Industry Revenue Share (%), by Product Type 2025 & 2033
- Figure 44: Middle East and Africa Rugged Display Industry Revenue (Million), by Level of Ruggedness 2025 & 2033
- Figure 45: Middle East and Africa Rugged Display Industry Revenue Share (%), by Level of Ruggedness 2025 & 2033
- Figure 46: Middle East and Africa Rugged Display Industry Revenue (Million), by Operating System 2025 & 2033
- Figure 47: Middle East and Africa Rugged Display Industry Revenue Share (%), by Operating System 2025 & 2033
- Figure 48: Middle East and Africa Rugged Display Industry Revenue (Million), by End User 2025 & 2033
- Figure 49: Middle East and Africa Rugged Display Industry Revenue Share (%), by End User 2025 & 2033
- Figure 50: Middle East and Africa Rugged Display Industry Revenue (Million), by Country 2025 & 2033
- Figure 51: Middle East and Africa Rugged Display Industry Revenue Share (%), by Country 2025 & 2033
List of Tables
- Table 1: Global Rugged Display Industry Revenue Million Forecast, by Product Type 2020 & 2033
- Table 2: Global Rugged Display Industry Revenue Million Forecast, by Level of Ruggedness 2020 & 2033
- Table 3: Global Rugged Display Industry Revenue Million Forecast, by Operating System 2020 & 2033
- Table 4: Global Rugged Display Industry Revenue Million Forecast, by End User 2020 & 2033
- Table 5: Global Rugged Display Industry Revenue Million Forecast, by Region 2020 & 2033
- Table 6: Global Rugged Display Industry Revenue Million Forecast, by Product Type 2020 & 2033
- Table 7: Global Rugged Display Industry Revenue Million Forecast, by Level of Ruggedness 2020 & 2033
- Table 8: Global Rugged Display Industry Revenue Million Forecast, by Operating System 2020 & 2033
- Table 9: Global Rugged Display Industry Revenue Million Forecast, by End User 2020 & 2033
- Table 10: Global Rugged Display Industry Revenue Million Forecast, by Country 2020 & 2033
- Table 11: Global Rugged Display Industry Revenue Million Forecast, by Product Type 2020 & 2033
- Table 12: Global Rugged Display Industry Revenue Million Forecast, by Level of Ruggedness 2020 & 2033
- Table 13: Global Rugged Display Industry Revenue Million Forecast, by Operating System 2020 & 2033
- Table 14: Global Rugged Display Industry Revenue Million Forecast, by End User 2020 & 2033
- Table 15: Global Rugged Display Industry Revenue Million Forecast, by Country 2020 & 2033
- Table 16: Global Rugged Display Industry Revenue Million Forecast, by Product Type 2020 & 2033
- Table 17: Global Rugged Display Industry Revenue Million Forecast, by Level of Ruggedness 2020 & 2033
- Table 18: Global Rugged Display Industry Revenue Million Forecast, by Operating System 2020 & 2033
- Table 19: Global Rugged Display Industry Revenue Million Forecast, by End User 2020 & 2033
- Table 20: Global Rugged Display Industry Revenue Million Forecast, by Country 2020 & 2033
- Table 21: Global Rugged Display Industry Revenue Million Forecast, by Product Type 2020 & 2033
- Table 22: Global Rugged Display Industry Revenue Million Forecast, by Level of Ruggedness 2020 & 2033
- Table 23: Global Rugged Display Industry Revenue Million Forecast, by Operating System 2020 & 2033
- Table 24: Global Rugged Display Industry Revenue Million Forecast, by End User 2020 & 2033
- Table 25: Global Rugged Display Industry Revenue Million Forecast, by Country 2020 & 2033
- Table 26: Global Rugged Display Industry Revenue Million Forecast, by Product Type 2020 & 2033
- Table 27: Global Rugged Display Industry Revenue Million Forecast, by Level of Ruggedness 2020 & 2033
- Table 28: Global Rugged Display Industry Revenue Million Forecast, by Operating System 2020 & 2033
- Table 29: Global Rugged Display Industry Revenue Million Forecast, by End User 2020 & 2033
- Table 30: Global Rugged Display Industry Revenue Million Forecast, by Country 2020 & 2033
Frequently Asked Questions
1. What is the projected Compound Annual Growth Rate (CAGR) of the Rugged Display Industry?
The projected CAGR is approximately 4.43%.
2. Which companies are prominent players in the Rugged Display Industry?
Key companies in the market include L3 Technologies Inc, Kyocera Corp, Sparton Corp, Getac Technology Corp, General Dynamics Corp, Dell Inc, Xplore Technologies Corp, Beijer Electronics AB, Zebra Technologies Corp, Esterline Technologies Corp, Curtiss-Wright Corp, Panasonic Corporation.
3. What are the main segments of the Rugged Display Industry?
The market segments include Product Type, Level of Ruggedness, Operating System, End User.
4. Can you provide details about the market size?
The market size is estimated to be USD 10.39 Million as of 2022.
5. What are some drivers contributing to market growth?
; Reduced Total Cost of Ownership (TCO); Rising Demand for HMI and IoT in Various Industries.
6. What are the notable trends driving market growth?
Rugged Tablets are Expected to Hold Major Share.
7. Are there any restraints impacting market growth?
; Adoption of Consumer-grade Devices for Industrial Applications.
8. Can you provide examples of recent developments in the market?
N/A
9. What pricing options are available for accessing the report?
Pricing options include single-user, multi-user, and enterprise licenses priced at USD 4750, USD 5250, and USD 8750 respectively.
10. Is the market size provided in terms of value or volume?
The market size is provided in terms of value, measured in Million.
11. Are there any specific market keywords associated with the report?
Yes, the market keyword associated with the report is "Rugged Display Industry," which aids in identifying and referencing the specific market segment covered.
12. How do I determine which pricing option suits my needs best?
The pricing options vary based on user requirements and access needs. Individual users may opt for single-user licenses, while businesses requiring broader access may choose multi-user or enterprise licenses for cost-effective access to the report.
13. Are there any additional resources or data provided in the Rugged Display Industry report?
While the report offers comprehensive insights, it's advisable to review the specific contents or supplementary materials provided to ascertain if additional resources or data are available.
14. How can I stay updated on further developments or reports in the Rugged Display Industry?
To stay informed about further developments, trends, and reports in the Rugged Display Industry, consider subscribing to industry newsletters, following relevant companies and organizations, or regularly checking reputable industry news sources and publications.
Methodology
Step 1 - Identification of Relevant Samples Size from Population Database


Step 2 - Approaches for Defining Global Market Size (Value, Volume* & Price*)

Note*: In applicable scenarios
Step 3 - Data Sources
Primary Research
- Web Analytics
- Survey Reports
- Research Institute
- Latest Research Reports
- Opinion Leaders
Secondary Research
- Annual Reports
- White Paper
- Latest Press Release
- Industry Association
- Paid Database
- Investor Presentations

Step 4 - Data Triangulation
Involves using different sources of information in order to increase the validity of a study
These sources are likely to be stakeholders in a program - participants, other researchers, program staff, other community members, and so on.
Then we put all data in single framework & apply various statistical tools to find out the dynamic on the market.
During the analysis stage, feedback from the stakeholder groups would be compared to determine areas of agreement as well as areas of divergence