

Key Insights
The global ammonium phosphate market is projected to reach 528.26 million by 2025, with an anticipated Compound Annual Growth Rate (CAGR) of 5.4% from 2025 to 2033. This growth is primarily driven by the expanding agricultural sector and the increasing demand for enhanced crop yields to support a growing global population. Ammonium phosphate is a vital nutrient source, essential for intensive farming practices. Government initiatives promoting sustainable agriculture and crop improvement, especially in developing economies, further bolster market demand. Technological advancements in fertilizer production are also contributing positively by improving efficiency and minimizing environmental impact. However, raw material price volatility and energy cost fluctuations present challenges, alongside environmental concerns associated with fertilizer runoff, necessitating sustainable management practices.
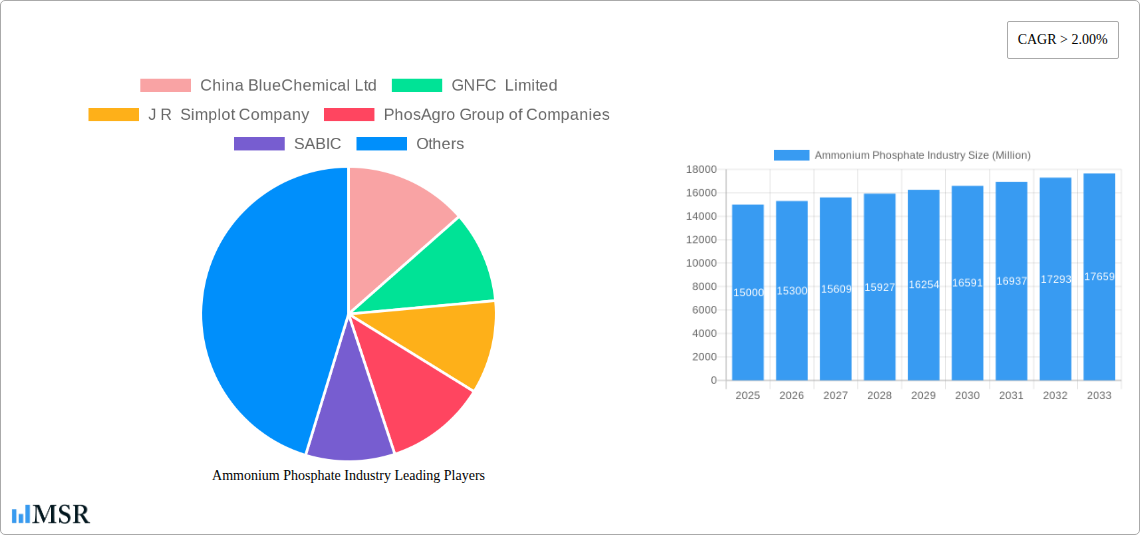
Ammonium Phosphate Industry Market Size (In Million)
The market is segmented by diverse agricultural applications, with specialized formulations addressing varied crop types and soil requirements. Key industry players including China BlueChemical Ltd, GNFC Limited, J R Simplot Company, PhosAgro Group of Companies, SABIC, Shifang Chuanxi Xingda Chemical Co Ltd, The Mosaic Company, and Yara are actively influencing market dynamics through strategic initiatives such as expansions, technological innovation, and mergers and acquisitions. Regional agricultural practices and fertilizer consumption patterns dictate market share distribution. The forecast period (2025-2033) anticipates sustained market expansion, influenced by global economic trends, agricultural policy shifts, and advancements in sustainable farming technologies. Growth is expected to be particularly strong in regions with developing agricultural sectors and increasing adoption of modern cultivation techniques.
Ammonium Phosphate Industry Company Market Share
Ammonium Phosphate Industry: A Comprehensive Market Report (2019-2033)
This comprehensive report provides an in-depth analysis of the global ammonium phosphate industry, offering valuable insights for stakeholders seeking to navigate this dynamic market. The report covers the period 2019-2033, with a focus on the forecast period 2025-2033 (Base Year: 2025, Estimated Year: 2025). We delve into market dynamics, key players, emerging trends, and future growth opportunities, providing actionable intelligence to inform strategic decision-making.
Ammonium Phosphate Industry Market Concentration & Dynamics
This section analyzes the competitive landscape of the ammonium phosphate market, examining market concentration, innovation, regulation, substitutes, end-user trends, and mergers & acquisitions (M&A) activity.
The global ammonium phosphate market exhibits a moderately concentrated structure, with a few key players holding significant market share. While precise market share figures for each company vary year to year and are commercially sensitive, it's estimated that the top 8 players (including China BlueChemical Ltd, GNFC Limited, J R Simplot Company, PhosAgro Group of Companies, SABIC, Shifang Chuanxi Xingda Chemical Co Ltd, The Mosaic Company, and Yara) collectively account for approximately xx% of the global market. Innovation within the industry is driven by efficiency improvements in production processes and the development of specialized fertilizers catering to specific crop needs. Regulatory frameworks, which vary by region, significantly influence production and distribution. Competition from substitute products, such as other nitrogen and phosphate fertilizers, is a key factor influencing pricing and market share. End-user trends, particularly the rising demand for high-yield agriculture in developing nations, is a strong market driver. M&A activity within the sector has been moderate in recent years, with approximately xx deals recorded between 2019 and 2024, reflecting strategic consolidation and expansion efforts.
Ammonium Phosphate Industry Industry Insights & Trends
The global ammonium phosphate market is projected to reach USD xx Million by 2033, exhibiting a Compound Annual Growth Rate (CAGR) of xx% during the forecast period (2025-2033). This growth is fueled by several key factors: the increasing global population and subsequent demand for food security, driving the need for higher agricultural yields; expanding arable land use and intensification of farming practices; favorable government policies promoting agricultural development in several regions; and ongoing technological advancements improving fertilizer efficiency and application methods. However, fluctuating raw material prices (phosphate rock and ammonia), environmental concerns associated with fertilizer use, and potential trade restrictions pose significant challenges. The market size in 2025 is estimated at USD xx Million, representing substantial growth compared to the USD xx Million recorded in 2019.
Key Markets & Segments Leading Ammonium Phosphate Industry
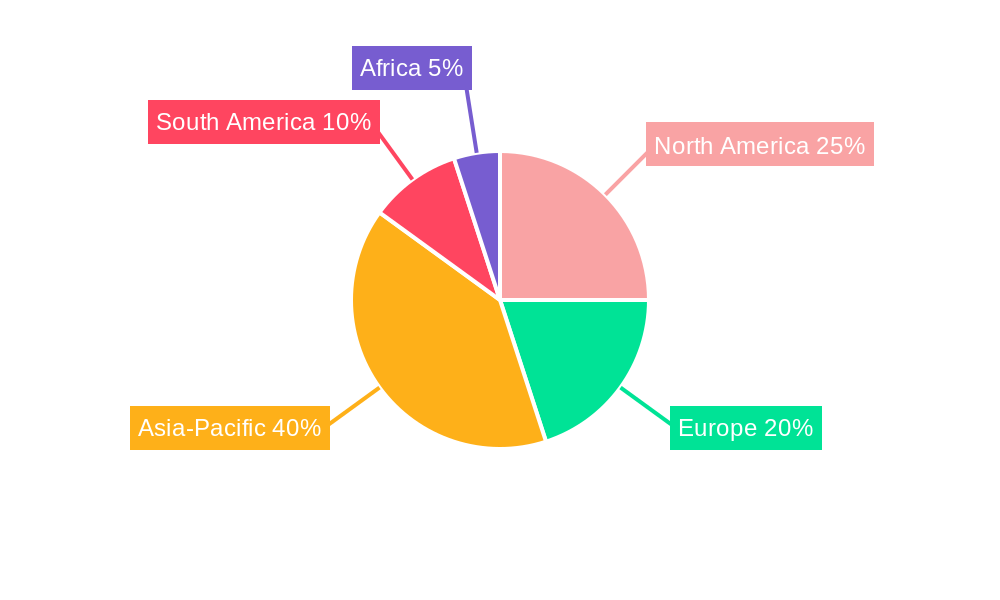
The Asia-Pacific region currently dominates the global ammonium phosphate market, driven by rapid agricultural expansion and increasing fertilizer consumption in countries like India and China.
- Drivers in Asia-Pacific:
- Rapid economic growth and rising disposable incomes.
- Significant investments in agricultural infrastructure and modernization.
- Expanding arable land under cultivation.
- Government initiatives to boost agricultural productivity.
The dominance of Asia-Pacific stems from its large agricultural sector, high population density, and increasing adoption of modern farming techniques requiring high-quality fertilizers. While other regions like North America and South America also exhibit substantial growth, the sheer scale of demand in Asia-Pacific makes it the leading market. Europe and Africa show moderate growth, influenced by agricultural policies and economic conditions. Detailed analysis reveals that the specific country-level performance is influenced by factors such as climate, agricultural policy, and economic development.
Ammonium Phosphate Industry Product Developments
Recent years have witnessed significant product innovations in the ammonium phosphate industry, focusing on enhancing nutrient efficiency, reducing environmental impact, and improving crop yields. Developments include granular formulations for improved application, coated products for controlled nutrient release, and blends with micronutrients tailored to specific crop needs. These innovations contribute to greater efficiency and environmental sustainability, providing producers with a competitive edge in the marketplace. The industry's focus on precision agriculture further enhances the effectiveness of ammonium phosphate fertilizers, leading to optimized nutrient utilization and maximized crop returns.
Challenges in the Ammonium Phosphate Industry Market
The ammonium phosphate industry faces several key challenges, including volatile raw material prices impacting production costs, stringent environmental regulations concerning nutrient runoff and greenhouse gas emissions, and intense competition among established and emerging players. Supply chain disruptions, especially those related to phosphate rock sourcing, also pose a significant threat to consistent production and timely delivery. These factors can collectively reduce profit margins and impede market growth, requiring strategic adaptations by producers. The estimated impact of these combined challenges is a reduction in industry profitability by approximately xx% during periods of heightened volatility.
Forces Driving Ammonium Phosphate Industry Growth
Several key factors drive the growth of the ammonium phosphate industry. Firstly, the escalating global population necessitates increased food production, significantly boosting the demand for fertilizers. Secondly, rising incomes in developing countries are fueling higher consumption of protein-rich foods, increasing the demand for crops dependent on ammonium phosphate. Thirdly, advancements in agricultural technologies are enhancing the efficiency of fertilizer utilization, optimizing crop yields, and further increasing demand. These factors collectively contribute to the sustained growth trajectory of this essential agricultural input market.
Long-Term Growth Catalysts in the Ammonium Phosphate Industry
Long-term growth in the ammonium phosphate industry hinges on continued innovation, strategic partnerships, and market expansion into new regions. The development of more efficient and sustainable fertilizer formulations, combined with advancements in precision agriculture, will be key to meeting future demand. Furthermore, collaborations between fertilizer producers and agricultural technology firms can unlock new efficiencies and improve resource utilization. Expansion into emerging markets, particularly in sub-Saharan Africa, presents significant growth opportunities.
Emerging Opportunities in Ammonium Phosphate Industry
Emerging opportunities include the increasing demand for sustainable and environmentally friendly fertilizer products, leading to the growth of slow-release and bio-based fertilizers. Precision agriculture technologies, which optimize fertilizer application, represent another significant opportunity. Furthermore, expanding into new geographic markets, especially in regions with growing agricultural needs but limited fertilizer access, presents considerable potential.
Leading Players in the Ammonium Phosphate Industry Sector
- China BlueChemical Ltd
- GNFC Limited
- J R Simplot Company
- PhosAgro Group of Companies
- SABIC
- Shifang Chuanxi Xingda Chemical Co Ltd
- The Mosaic Company
- Yara *List Not Exhaustive
Key Milestones in Ammonium Phosphate Industry Industry
- 2020: Several major producers implemented stricter environmental standards for their manufacturing processes.
- 2021: A significant merger between two regional players reshaped the competitive landscape.
- 2022: Launch of a new, high-efficiency ammonium phosphate formulation by a leading company.
- 2023: Increased investment in research and development of sustainable fertilizer technologies.
- 2024: Several governments implemented policies aimed at promoting sustainable fertilizer usage.
Strategic Outlook for Ammonium Phosphate Industry Market
The future of the ammonium phosphate market is bright, driven by long-term factors such as population growth and the increasing demand for food. Strategic opportunities exist in focusing on sustainable production methods, technological advancements improving efficiency and yield, and expanding into underserved markets. Companies that embrace innovation, sustainable practices, and strategic partnerships are best positioned to capitalize on this substantial growth potential and secure a leading market position.
Ammonium Phosphate Industry Segmentation
-
1. Application
- 1.1. Fertilizer
- 1.2. Food & Beverages
- 1.3. Fire Retardant
- 1.4. Metals
Ammonium Phosphate Industry Segmentation By Geography
-
1. Asia Pacific
- 1.1. China
- 1.2. India
- 1.3. Japan
- 1.4. South Korea
- 1.5. Rest of Asia Pacific
-
2. North America
- 2.1. United States
- 2.2. Canada
- 2.3. Mexico
-
3. Europe
- 3.1. Germany
- 3.2. United Kingdom
- 3.3. Italy
- 3.4. France
- 3.5. Rest of Europe
-
4. South America
- 4.1. Brazil
- 4.2. Argentina
- 4.3. Rest of South America
-
5. Middle East and Africa
- 5.1. Saudi Arabia
- 5.2. South Africa
- 5.3. Rest of Middle East and Africa
Ammonium Phosphate Industry Regional Market Share
Geographic Coverage of Ammonium Phosphate Industry
Ammonium Phosphate Industry REPORT HIGHLIGHTS
| Aspects | Details |
|---|---|
| Study Period | 2020-2034 |
| Base Year | 2025 |
| Estimated Year | 2026 |
| Forecast Period | 2026-2034 |
| Historical Period | 2020-2025 |
| Growth Rate | CAGR of 5.4% from 2020-2034 |
| Segmentation |
|
Table of Contents
- 1. Introduction
- 1.1. Research Scope
- 1.2. Market Segmentation
- 1.3. Research Objective
- 1.4. Definitions and Assumptions
- 2. Executive Summary
- 2.1. Market Snapshot
- 3. Market Dynamics
- 3.1. Market Drivers
- 3.2. Market Restrains
- 3.3. Market Trends
- 3.4. Market Opportunities
- 4. Market Factor Analysis
- 4.1. Porters Five Forces
- 4.1.1. Bargaining Power of Suppliers
- 4.1.2. Bargaining Power of Buyers
- 4.1.3. Threat of New Entrants
- 4.1.4. Threat of Substitutes
- 4.1.5. Competitive Rivalry
- 4.2. PESTEL analysis
- 4.3. BCG Analysis
- 4.3.1. Stars (High Growth, High Market Share)
- 4.3.2. Cash Cows (Low Growth, High Market Share)
- 4.3.3. Question Mark (High Growth, Low Market Share)
- 4.3.4. Dogs (Low Growth, Low Market Share)
- 4.4. Ansoff Matrix Analysis
- 4.5. Supply Chain Analysis
- 4.6. Regulatory Landscape
- 4.7. Current Market Potential and Opportunity Assessment (TAM–SAM–SOM Framework)
- 4.8. MSR Analyst Note
- 4.1. Porters Five Forces
- 5. Market Analysis, Insights and Forecast 2021-2033
- 5.1. Market Analysis, Insights and Forecast - by Application
- 5.1.1. Fertilizer
- 5.1.2. Food & Beverages
- 5.1.3. Fire Retardant
- 5.1.4. Metals
- 5.2. Market Analysis, Insights and Forecast - by Region
- 5.2.1. Asia Pacific
- 5.2.2. North America
- 5.2.3. Europe
- 5.2.4. South America
- 5.2.5. Middle East and Africa
- 5.1. Market Analysis, Insights and Forecast - by Application
- 6. Global Ammonium Phosphate Industry Analysis, Insights and Forecast, 2021-2033
- 6.1. Market Analysis, Insights and Forecast - by Application
- 6.1.1. Fertilizer
- 6.1.2. Food & Beverages
- 6.1.3. Fire Retardant
- 6.1.4. Metals
- 6.1. Market Analysis, Insights and Forecast - by Application
- 7. Asia Pacific Ammonium Phosphate Industry Analysis, Insights and Forecast, 2020-2032
- 7.1. Market Analysis, Insights and Forecast - by Application
- 7.1.1. Fertilizer
- 7.1.2. Food & Beverages
- 7.1.3. Fire Retardant
- 7.1.4. Metals
- 7.1. Market Analysis, Insights and Forecast - by Application
- 8. North America Ammonium Phosphate Industry Analysis, Insights and Forecast, 2020-2032
- 8.1. Market Analysis, Insights and Forecast - by Application
- 8.1.1. Fertilizer
- 8.1.2. Food & Beverages
- 8.1.3. Fire Retardant
- 8.1.4. Metals
- 8.1. Market Analysis, Insights and Forecast - by Application
- 9. Europe Ammonium Phosphate Industry Analysis, Insights and Forecast, 2020-2032
- 9.1. Market Analysis, Insights and Forecast - by Application
- 9.1.1. Fertilizer
- 9.1.2. Food & Beverages
- 9.1.3. Fire Retardant
- 9.1.4. Metals
- 9.1. Market Analysis, Insights and Forecast - by Application
- 10. South America Ammonium Phosphate Industry Analysis, Insights and Forecast, 2020-2032
- 10.1. Market Analysis, Insights and Forecast - by Application
- 10.1.1. Fertilizer
- 10.1.2. Food & Beverages
- 10.1.3. Fire Retardant
- 10.1.4. Metals
- 10.1. Market Analysis, Insights and Forecast - by Application
- 11. Middle East and Africa Ammonium Phosphate Industry Analysis, Insights and Forecast, 2020-2032
- 11.1. Market Analysis, Insights and Forecast - by Application
- 11.1.1. Fertilizer
- 11.1.2. Food & Beverages
- 11.1.3. Fire Retardant
- 11.1.4. Metals
- 11.1. Market Analysis, Insights and Forecast - by Application
- 12. Competitive Analysis
- 12.1. Company Profiles
- 12.1.1 China BlueChemical Ltd
- 12.1.1.1. Company Overview
- 12.1.1.2. Products
- 12.1.1.3. Company Financials
- 12.1.1.4. SWOT Analysis
- 12.1.2 GNFC Limited
- 12.1.2.1. Company Overview
- 12.1.2.2. Products
- 12.1.2.3. Company Financials
- 12.1.2.4. SWOT Analysis
- 12.1.3 J R Simplot Company
- 12.1.3.1. Company Overview
- 12.1.3.2. Products
- 12.1.3.3. Company Financials
- 12.1.3.4. SWOT Analysis
- 12.1.4 PhosAgro Group of Companies
- 12.1.4.1. Company Overview
- 12.1.4.2. Products
- 12.1.4.3. Company Financials
- 12.1.4.4. SWOT Analysis
- 12.1.5 SABIC
- 12.1.5.1. Company Overview
- 12.1.5.2. Products
- 12.1.5.3. Company Financials
- 12.1.5.4. SWOT Analysis
- 12.1.6 Shifang Chuanxi Xingda Chemical Co Ltd
- 12.1.6.1. Company Overview
- 12.1.6.2. Products
- 12.1.6.3. Company Financials
- 12.1.6.4. SWOT Analysis
- 12.1.7 The Mosaic Company
- 12.1.7.1. Company Overview
- 12.1.7.2. Products
- 12.1.7.3. Company Financials
- 12.1.7.4. SWOT Analysis
- 12.1.8 Yara*List Not Exhaustive
- 12.1.8.1. Company Overview
- 12.1.8.2. Products
- 12.1.8.3. Company Financials
- 12.1.8.4. SWOT Analysis
- 12.1.1 China BlueChemical Ltd
- 12.2. Market Entropy
- 12.2.1 Company's Key Areas Served
- 12.2.2 Recent Developments
- 12.3. Company Market Share Analysis 2025
- 12.3.1 Top 5 Companies Market Share Analysis
- 12.3.2 Top 3 Companies Market Share Analysis
- 12.4. List of Potential Customers
- 13. Research Methodology
List of Figures
- Figure 1: Global Ammonium Phosphate Industry Revenue Breakdown (million, %) by Region 2025 & 2033
- Figure 2: Asia Pacific Ammonium Phosphate Industry Revenue (million), by Application 2025 & 2033
- Figure 3: Asia Pacific Ammonium Phosphate Industry Revenue Share (%), by Application 2025 & 2033
- Figure 4: Asia Pacific Ammonium Phosphate Industry Revenue (million), by Country 2025 & 2033
- Figure 5: Asia Pacific Ammonium Phosphate Industry Revenue Share (%), by Country 2025 & 2033
- Figure 6: North America Ammonium Phosphate Industry Revenue (million), by Application 2025 & 2033
- Figure 7: North America Ammonium Phosphate Industry Revenue Share (%), by Application 2025 & 2033
- Figure 8: North America Ammonium Phosphate Industry Revenue (million), by Country 2025 & 2033
- Figure 9: North America Ammonium Phosphate Industry Revenue Share (%), by Country 2025 & 2033
- Figure 10: Europe Ammonium Phosphate Industry Revenue (million), by Application 2025 & 2033
- Figure 11: Europe Ammonium Phosphate Industry Revenue Share (%), by Application 2025 & 2033
- Figure 12: Europe Ammonium Phosphate Industry Revenue (million), by Country 2025 & 2033
- Figure 13: Europe Ammonium Phosphate Industry Revenue Share (%), by Country 2025 & 2033
- Figure 14: South America Ammonium Phosphate Industry Revenue (million), by Application 2025 & 2033
- Figure 15: South America Ammonium Phosphate Industry Revenue Share (%), by Application 2025 & 2033
- Figure 16: South America Ammonium Phosphate Industry Revenue (million), by Country 2025 & 2033
- Figure 17: South America Ammonium Phosphate Industry Revenue Share (%), by Country 2025 & 2033
- Figure 18: Middle East and Africa Ammonium Phosphate Industry Revenue (million), by Application 2025 & 2033
- Figure 19: Middle East and Africa Ammonium Phosphate Industry Revenue Share (%), by Application 2025 & 2033
- Figure 20: Middle East and Africa Ammonium Phosphate Industry Revenue (million), by Country 2025 & 2033
- Figure 21: Middle East and Africa Ammonium Phosphate Industry Revenue Share (%), by Country 2025 & 2033
List of Tables
- Table 1: Global Ammonium Phosphate Industry Revenue million Forecast, by Application 2020 & 2033
- Table 2: Global Ammonium Phosphate Industry Revenue million Forecast, by Region 2020 & 2033
- Table 3: Global Ammonium Phosphate Industry Revenue million Forecast, by Application 2020 & 2033
- Table 4: Global Ammonium Phosphate Industry Revenue million Forecast, by Country 2020 & 2033
- Table 5: China Ammonium Phosphate Industry Revenue (million) Forecast, by Application 2020 & 2033
- Table 6: India Ammonium Phosphate Industry Revenue (million) Forecast, by Application 2020 & 2033
- Table 7: Japan Ammonium Phosphate Industry Revenue (million) Forecast, by Application 2020 & 2033
- Table 8: South Korea Ammonium Phosphate Industry Revenue (million) Forecast, by Application 2020 & 2033
- Table 9: Rest of Asia Pacific Ammonium Phosphate Industry Revenue (million) Forecast, by Application 2020 & 2033
- Table 10: Global Ammonium Phosphate Industry Revenue million Forecast, by Application 2020 & 2033
- Table 11: Global Ammonium Phosphate Industry Revenue million Forecast, by Country 2020 & 2033
- Table 12: United States Ammonium Phosphate Industry Revenue (million) Forecast, by Application 2020 & 2033
- Table 13: Canada Ammonium Phosphate Industry Revenue (million) Forecast, by Application 2020 & 2033
- Table 14: Mexico Ammonium Phosphate Industry Revenue (million) Forecast, by Application 2020 & 2033
- Table 15: Global Ammonium Phosphate Industry Revenue million Forecast, by Application 2020 & 2033
- Table 16: Global Ammonium Phosphate Industry Revenue million Forecast, by Country 2020 & 2033
- Table 17: Germany Ammonium Phosphate Industry Revenue (million) Forecast, by Application 2020 & 2033
- Table 18: United Kingdom Ammonium Phosphate Industry Revenue (million) Forecast, by Application 2020 & 2033
- Table 19: Italy Ammonium Phosphate Industry Revenue (million) Forecast, by Application 2020 & 2033
- Table 20: France Ammonium Phosphate Industry Revenue (million) Forecast, by Application 2020 & 2033
- Table 21: Rest of Europe Ammonium Phosphate Industry Revenue (million) Forecast, by Application 2020 & 2033
- Table 22: Global Ammonium Phosphate Industry Revenue million Forecast, by Application 2020 & 2033
- Table 23: Global Ammonium Phosphate Industry Revenue million Forecast, by Country 2020 & 2033
- Table 24: Brazil Ammonium Phosphate Industry Revenue (million) Forecast, by Application 2020 & 2033
- Table 25: Argentina Ammonium Phosphate Industry Revenue (million) Forecast, by Application 2020 & 2033
- Table 26: Rest of South America Ammonium Phosphate Industry Revenue (million) Forecast, by Application 2020 & 2033
- Table 27: Global Ammonium Phosphate Industry Revenue million Forecast, by Application 2020 & 2033
- Table 28: Global Ammonium Phosphate Industry Revenue million Forecast, by Country 2020 & 2033
- Table 29: Saudi Arabia Ammonium Phosphate Industry Revenue (million) Forecast, by Application 2020 & 2033
- Table 30: South Africa Ammonium Phosphate Industry Revenue (million) Forecast, by Application 2020 & 2033
- Table 31: Rest of Middle East and Africa Ammonium Phosphate Industry Revenue (million) Forecast, by Application 2020 & 2033
Frequently Asked Questions
1. What is the projected Compound Annual Growth Rate (CAGR) of the Ammonium Phosphate Industry?
The projected CAGR is approximately 5.4%.
2. Which companies are prominent players in the Ammonium Phosphate Industry?
Key companies in the market include China BlueChemical Ltd, GNFC Limited, J R Simplot Company, PhosAgro Group of Companies, SABIC, Shifang Chuanxi Xingda Chemical Co Ltd, The Mosaic Company, Yara*List Not Exhaustive.
3. What are the main segments of the Ammonium Phosphate Industry?
The market segments include Application.
4. Can you provide details about the market size?
The market size is estimated to be USD 528.26 million as of 2022.
5. What are some drivers contributing to market growth?
; Increasing Demand of Diammonium Hydrogen Phosphate in Fertilizers; Rising Demand from Brewing.
6. What are the notable trends driving market growth?
Increasing Demand from Fertilizers Segment.
7. Are there any restraints impacting market growth?
; Increasing Demand of Diammonium Hydrogen Phosphate in Fertilizers; Rising Demand from Brewing.
8. Can you provide examples of recent developments in the market?
N/A
9. What pricing options are available for accessing the report?
Pricing options include single-user, multi-user, and enterprise licenses priced at USD 4750, USD 5250, and USD 8750 respectively.
10. Is the market size provided in terms of value or volume?
The market size is provided in terms of value, measured in million.
11. Are there any specific market keywords associated with the report?
Yes, the market keyword associated with the report is "Ammonium Phosphate Industry," which aids in identifying and referencing the specific market segment covered.
12. How do I determine which pricing option suits my needs best?
The pricing options vary based on user requirements and access needs. Individual users may opt for single-user licenses, while businesses requiring broader access may choose multi-user or enterprise licenses for cost-effective access to the report.
13. Are there any additional resources or data provided in the Ammonium Phosphate Industry report?
While the report offers comprehensive insights, it's advisable to review the specific contents or supplementary materials provided to ascertain if additional resources or data are available.
14. How can I stay updated on further developments or reports in the Ammonium Phosphate Industry?
To stay informed about further developments, trends, and reports in the Ammonium Phosphate Industry, consider subscribing to industry newsletters, following relevant companies and organizations, or regularly checking reputable industry news sources and publications.
Methodology
Step 1 - Identification of Relevant Samples Size from Population Database


Step 2 - Approaches for Defining Global Market Size (Value, Volume* & Price*)

Note*: In applicable scenarios
Step 3 - Data Sources
Primary Research
- Web Analytics
- Survey Reports
- Research Institute
- Latest Research Reports
- Opinion Leaders
Secondary Research
- Annual Reports
- White Paper
- Latest Press Release
- Industry Association
- Paid Database
- Investor Presentations

Step 4 - Data Triangulation
Involves using different sources of information in order to increase the validity of a study
These sources are likely to be stakeholders in a program - participants, other researchers, program staff, other community members, and so on.
Then we put all data in single framework & apply various statistical tools to find out the dynamic on the market.
During the analysis stage, feedback from the stakeholder groups would be compared to determine areas of agreement as well as areas of divergence