

Key Insights
The Asia-Pacific (APAC) carbon fiber building materials market is experiencing robust growth, driven by the region's expanding construction and infrastructure sectors, coupled with increasing demand for lightweight, high-strength materials in buildings and infrastructure projects. A significant driver is the rising adoption of sustainable construction practices, with carbon fiber offering superior durability and longevity compared to traditional materials, leading to reduced lifecycle costs and environmental impact. Furthermore, government initiatives promoting green building technologies and investments in infrastructure development across countries like China, India, and Japan are fueling market expansion. While the high initial cost of carbon fiber compared to alternatives like steel and concrete remains a restraint, technological advancements are continuously improving manufacturing processes, making carbon fiber increasingly cost-competitive. The market segmentation within APAC reveals a strong preference for virgin carbon fiber (VCF) due to its superior properties, though the recycled carbon fiber (RCF) segment is witnessing growing interest driven by sustainability concerns and cost optimization efforts. Key applications include reinforced concrete, prefabricated structures, and bridge components, reflecting the increasing utilization of carbon fiber in large-scale construction projects. Major players in the APAC market are strategically focusing on partnerships and collaborations to expand their market reach and enhance technological capabilities. The market's growth trajectory is projected to remain strong throughout the forecast period, driven by sustained infrastructure investment and the increasing awareness of carbon fiber's benefits in the construction industry.
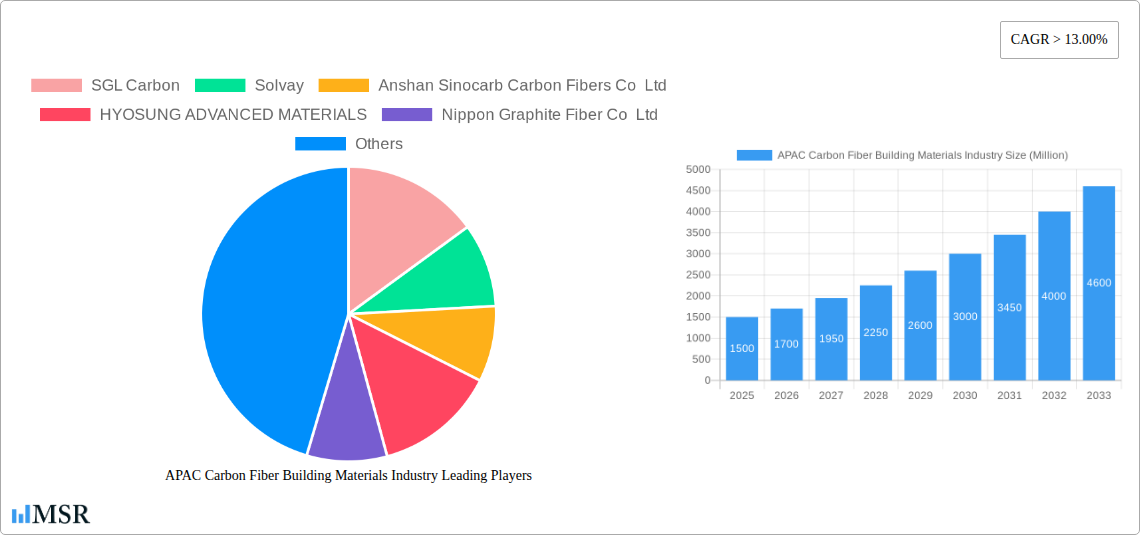
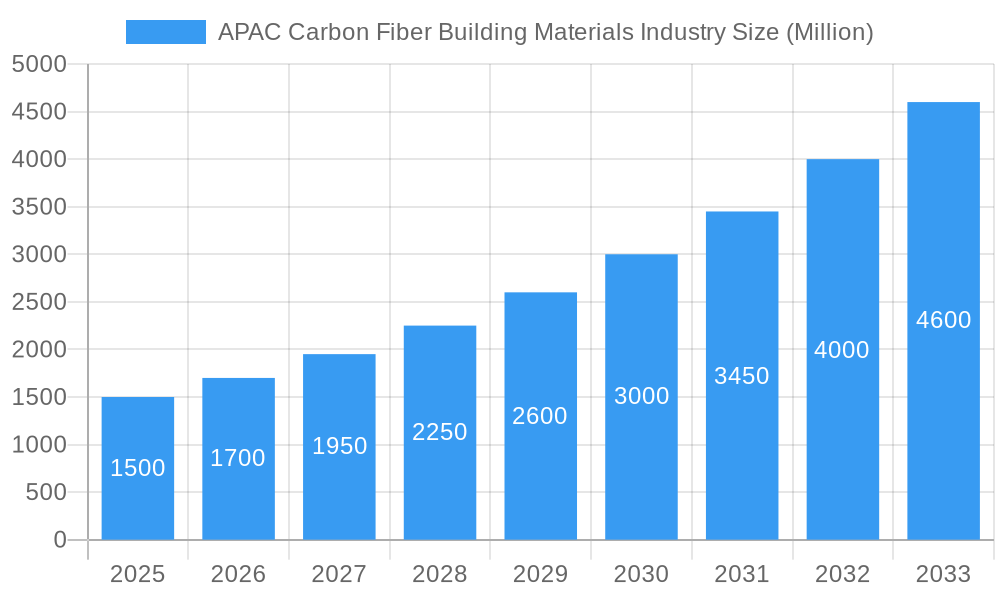
APAC Carbon Fiber Building Materials Industry Market Size (In Billion)
The APAC region's dominance in the global carbon fiber market is further strengthened by its burgeoning manufacturing base and the presence of major carbon fiber producers. This self-sufficiency in raw material production contributes significantly to the region's competitive advantage. The market is further segmented by material type (PAN, Petroleum Pitch, Rayon) reflecting diverse production methods and material properties influencing application choice. The competitive landscape is characterized by both established international players and rapidly growing domestic companies, leading to an increasingly dynamic market environment. While challenges remain related to supply chain management and ensuring consistent quality control across the vast APAC region, the overall market outlook remains optimistic, driven by the region's robust economic growth, urbanization, and commitment to sustainable development. The increasing adoption of advanced construction techniques and the pursuit of higher building performance standards are further solidifying the role of carbon fiber as a key material in the future of construction within APAC. This growth is expected to outpace global averages, making APAC a focal point for investors and businesses in the carbon fiber industry.
APAC Carbon Fiber Building Materials Industry Company Market Share
APAC Carbon Fiber Building Materials Industry Report: 2019-2033
This comprehensive report provides an in-depth analysis of the Asia-Pacific (APAC) carbon fiber building materials industry, covering market size, growth drivers, key players, and future trends. The study period spans 2019-2033, with a focus on the estimated year 2025 and forecast period 2025-2033. This report is crucial for stakeholders, investors, and industry professionals seeking actionable insights into this rapidly evolving sector. The report meticulously covers raw materials like Polyacrtlonitrile (PAN), Petroleum Pitch, and Rayon, fiber types (Virgin Fiber (VCF), Recycled Fiber (RCF)), diverse applications (Composite Materials, Textiles, Microelectrodes, Catalysis), and a wide range of end-user industries, including Aerospace & Defense, Alternative Energy, Automotive, Construction & Infrastructure, Sporting Goods, and other specialized sectors.
APAC Carbon Fiber Building Materials Industry Market Concentration & Dynamics
The APAC carbon fiber building materials market exhibits a moderately concentrated landscape, with several major players holding significant market share. While precise market share data for each company remains proprietary, it's observed that companies like Toray Industries Inc., SGL Carbon, and Solvay hold prominent positions, influencing overall market dynamics. The innovation ecosystem is dynamic, with ongoing R&D efforts focused on enhancing fiber strength, durability, and cost-effectiveness. Regulatory frameworks vary across APAC nations, impacting material standards and production processes. Substitute materials like fiberglass and other advanced composites exert competitive pressure, although carbon fiber’s superior strength-to-weight ratio often justifies its premium price. End-user trends lean towards lightweighting and increased durability across various sectors like automotive and aerospace. M&A activity is relatively moderate. During the historical period (2019-2024), approximately xx M&A deals were observed, primarily involving smaller companies being acquired by larger players to expand their product portfolio or geographic reach.
- Market Concentration: Moderately concentrated with a few dominant players.
- Innovation: Strong R&D focus on enhancing fiber properties and reducing costs.
- Regulatory Landscape: Varies across APAC nations, impacting production and standards.
- Substitute Products: Fiberglass and other advanced composites pose competitive pressure.
- End-User Trends: Increasing demand for lightweight, high-strength materials.
- M&A Activity: Approximately xx deals during 2019-2024, primarily involving smaller players.
APAC Carbon Fiber Building Materials Industry Industry Insights & Trends
The APAC carbon fiber building materials market is experiencing robust growth, driven by increasing demand from various sectors. The market size in 2025 is estimated at USD xx Million, with a compound annual growth rate (CAGR) of xx% projected from 2025 to 2033. This growth is fueled by factors such as expanding infrastructure development, particularly in rapidly developing economies, the burgeoning renewable energy sector (demand for wind turbine blades), and the lightweighting trend in automotive manufacturing. Technological advancements, such as the development of improved fiber production techniques and more efficient composite manufacturing processes, are further boosting market expansion. Evolving consumer preferences for sustainable and high-performance materials are also driving demand. However, challenges such as raw material price volatility and the need for specialized manufacturing expertise can impact growth.
Key Markets & Segments Leading APAC Carbon Fiber Building Materials Industry
The construction and infrastructure sector represents the largest end-user segment for carbon fiber building materials in APAC, followed closely by the automotive and aerospace sectors. Within raw materials, Polyacrylonitrile (PAN) dominates the market due to its superior properties and established production infrastructure. Virgin fiber (VCF) accounts for the largest share of fiber types, while recycled fiber (RCF) is emerging as a more sustainable alternative. China and Japan are currently the leading markets in the region, driven by strong industrial growth and significant government investments in infrastructure.
Key Market Drivers:
- Rapid infrastructure development across APAC.
- Growth of the renewable energy sector (wind energy).
- Lightweighting trend in the automotive industry.
- Increasing demand for high-performance building materials.
Dominant Regions/Segments:
- Region: China and Japan hold leading positions.
- Raw Material: Polyacrylonitrile (PAN) dominates.
- Fiber Type: Virgin Fiber (VCF) holds the largest market share.
- End-User Industry: Construction & Infrastructure, Automotive, and Aerospace are key segments.
APAP Carbon Fiber Building Materials Industry Product Developments
Recent product innovations focus on enhancing the properties of carbon fiber, including improved tensile strength, higher modulus, and better resistance to environmental factors. These advancements are achieved through improved fiber production processes and the development of novel composite materials. The introduction of recycled carbon fiber is gaining traction, addressing environmental concerns and reducing material costs. New applications are emerging, particularly in construction and infrastructure projects, where carbon fiber offers significant advantages over traditional materials in terms of strength, weight, and durability. This leads to lighter, stronger, and more sustainable structures.
Challenges in the APAC Carbon Fiber Building Materials Industry Market
The APAC carbon fiber building materials industry faces several challenges, including the high cost of raw materials, particularly PAN, and the volatility of these prices. Supply chain disruptions, particularly felt during the recent global pandemic, can significantly impact production and delivery timelines. Intense competition from established players and emerging companies necessitates constant innovation and cost optimization. Furthermore, stringent regulatory requirements and safety standards can add complexity to the manufacturing process. These factors collectively impact the market's overall profitability and growth trajectory.
Forces Driving APAC Carbon Fiber Building Materials Industry Growth
Technological advancements in fiber production and composite manufacturing play a vital role in driving market growth. Government initiatives supporting infrastructure development and renewable energy projects create significant demand. Increasing investments from private and public sectors in R&D further fuel the industry's expansion. The rising demand for lightweight, high-strength materials in various end-use industries, coupled with growing environmental consciousness, fuels the adoption of carbon fiber composites as sustainable solutions.
Long-Term Growth Catalysts in the APAC Carbon Fiber Building Materials Industry
Long-term growth in the APAC carbon fiber building materials industry is supported by continued innovation in materials science, leading to improved fiber performance and cost reduction. Strategic partnerships between material producers and end-use industries can facilitate the wider adoption of carbon fiber solutions. Expanding infrastructure projects and increasing investments in renewable energy sources are expected to drive substantial growth in the coming years. Exploring new applications in emerging sectors will further broaden the market's potential.
Emerging Opportunities in APAC Carbon Fiber Building Materials Industry
The industry presents several compelling opportunities, particularly in the development and commercialization of recycled carbon fibers. The growing focus on sustainability and circular economy principles drives the demand for eco-friendly alternatives. Exploring new applications within the construction and infrastructure segments, like prefabricated building components, opens up substantial market potential. Further technological advancements in enhancing fiber properties and manufacturing processes will lead to higher efficiency and cost reduction.
Leading Players in the APAC Carbon Fiber Building Materials Industry Sector
- SGL Carbon
- Solvay
- Anshan Sinocarb Carbon Fibers Co Ltd
- HYOSUNG ADVANCED MATERIALS
- Nippon Graphite Fiber Co Ltd
- TORAY INDUSTRIES INC
- Mitsubishi Chemical Carbon Fiber and Composites Inc
- Hexcel Corporation
- Formosa Plastics Corporation
- TEIJIN LIMITED
- Zhongfu Shenying Carbon Fiber Co Ltd
Key Milestones in APAC Carbon Fiber Building Materials Industry Industry
- April 2021: Hyosung Advanced Materials secured a USD 144 Million contract with Hanwha Solutions for supplying high-strength carbon fiber for hydrogen vehicle fuel tanks. This deal significantly boosts the market's growth in the alternative energy sector.
Strategic Outlook for APAC Carbon Fiber Building Materials Industry Market
The APAC carbon fiber building materials market presents significant growth potential fueled by robust infrastructure development, the increasing adoption of renewable energy technologies, and the ongoing lightweighting trend in various industries. Strategic opportunities for players include focusing on product innovation, expanding into new applications, and forging strategic partnerships to capture a larger market share. A focus on sustainability and the development of cost-effective manufacturing processes will be crucial for long-term success.
APAC Carbon Fiber Building Materials Industry Segmentation
-
1. Raw Material
- 1.1. Polyacrtlonitrile (PAN)
- 1.2. Petroleum Pitch and Rayon
-
2. Type
- 2.1. Virgin Fiber (VCF)
- 2.2. Recycled Fiber (RCF)
-
3. Application
- 3.1. Composite Materials
- 3.2. Textiles
- 3.3. Microelectrodes
- 3.4. Catalysis
-
4. End-user Industry
- 4.1. Aerospace and Defense
- 4.2. Alternative Energy
- 4.3. Automotive
- 4.4. Construction and Infrastructure
- 4.5. Sporting Goods
- 4.6. Other En
-
5. Geography
- 5.1. China
- 5.2. India
- 5.3. Japan
- 5.4. South Korea
- 5.5. ASEAN Countries
- 5.6. Rest of Asia-Pacific
APAC Carbon Fiber Building Materials Industry Segmentation By Geography
- 1. China
- 2. India
- 3. Japan
- 4. South Korea
- 5. ASEAN Countries
- 6. Rest of Asia Pacific
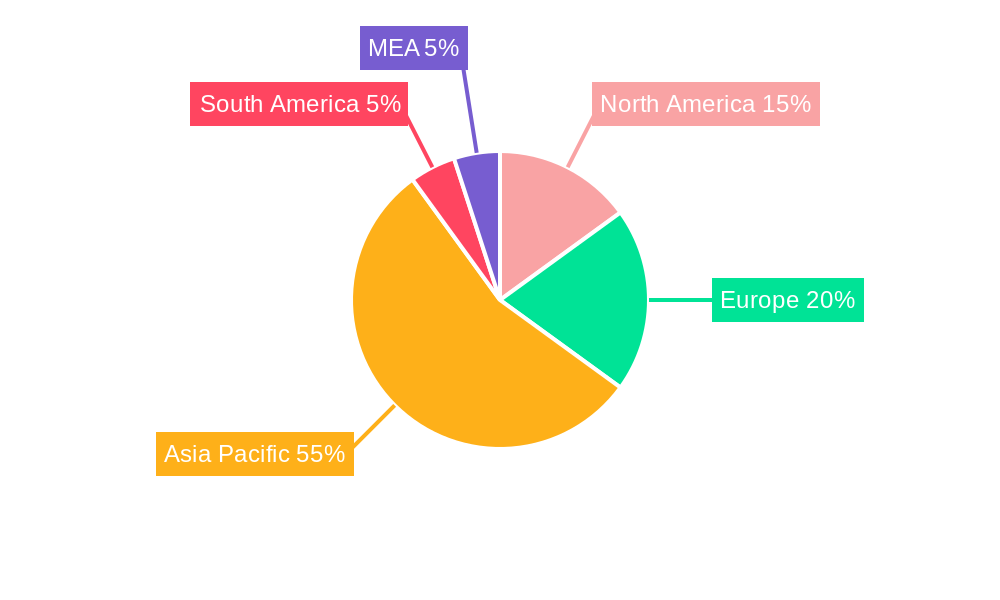
APAC Carbon Fiber Building Materials Industry Regional Market Share
Geographic Coverage of APAC Carbon Fiber Building Materials Industry
APAC Carbon Fiber Building Materials Industry REPORT HIGHLIGHTS
| Aspects | Details |
|---|---|
| Study Period | 2020-2034 |
| Base Year | 2025 |
| Estimated Year | 2026 |
| Forecast Period | 2026-2034 |
| Historical Period | 2020-2025 |
| Growth Rate | CAGR of 10.9% from 2020-2034 |
| Segmentation |
|
Table of Contents
- 1. Introduction
- 1.1. Research Scope
- 1.2. Market Segmentation
- 1.3. Research Objective
- 1.4. Definitions and Assumptions
- 2. Executive Summary
- 2.1. Market Snapshot
- 3. Market Dynamics
- 3.1. Market Drivers
- 3.2. Market Restrains
- 3.3. Market Trends
- 3.4. Market Opportunities
- 4. Market Factor Analysis
- 4.1. Porters Five Forces
- 4.1.1. Bargaining Power of Suppliers
- 4.1.2. Bargaining Power of Buyers
- 4.1.3. Threat of New Entrants
- 4.1.4. Threat of Substitutes
- 4.1.5. Competitive Rivalry
- 4.2. PESTEL analysis
- 4.3. BCG Analysis
- 4.3.1. Stars (High Growth, High Market Share)
- 4.3.2. Cash Cows (Low Growth, High Market Share)
- 4.3.3. Question Mark (High Growth, Low Market Share)
- 4.3.4. Dogs (Low Growth, Low Market Share)
- 4.4. Ansoff Matrix Analysis
- 4.5. Supply Chain Analysis
- 4.6. Regulatory Landscape
- 4.7. Current Market Potential and Opportunity Assessment (TAM–SAM–SOM Framework)
- 4.8. MSR Analyst Note
- 4.1. Porters Five Forces
- 5. Market Analysis, Insights and Forecast 2021-2033
- 5.1. Market Analysis, Insights and Forecast - by Raw Material
- 5.1.1. Polyacrtlonitrile (PAN)
- 5.1.2. Petroleum Pitch and Rayon
- 5.2. Market Analysis, Insights and Forecast - by Type
- 5.2.1. Virgin Fiber (VCF)
- 5.2.2. Recycled Fiber (RCF)
- 5.3. Market Analysis, Insights and Forecast - by Application
- 5.3.1. Composite Materials
- 5.3.2. Textiles
- 5.3.3. Microelectrodes
- 5.3.4. Catalysis
- 5.4. Market Analysis, Insights and Forecast - by End-user Industry
- 5.4.1. Aerospace and Defense
- 5.4.2. Alternative Energy
- 5.4.3. Automotive
- 5.4.4. Construction and Infrastructure
- 5.4.5. Sporting Goods
- 5.4.6. Other En
- 5.5. Market Analysis, Insights and Forecast - by Geography
- 5.5.1. China
- 5.5.2. India
- 5.5.3. Japan
- 5.5.4. South Korea
- 5.5.5. ASEAN Countries
- 5.5.6. Rest of Asia-Pacific
- 5.6. Market Analysis, Insights and Forecast - by Region
- 5.6.1. China
- 5.6.2. India
- 5.6.3. Japan
- 5.6.4. South Korea
- 5.6.5. ASEAN Countries
- 5.6.6. Rest of Asia Pacific
- 5.1. Market Analysis, Insights and Forecast - by Raw Material
- 6. Global APAC Carbon Fiber Building Materials Industry Analysis, Insights and Forecast, 2021-2033
- 6.1. Market Analysis, Insights and Forecast - by Raw Material
- 6.1.1. Polyacrtlonitrile (PAN)
- 6.1.2. Petroleum Pitch and Rayon
- 6.2. Market Analysis, Insights and Forecast - by Type
- 6.2.1. Virgin Fiber (VCF)
- 6.2.2. Recycled Fiber (RCF)
- 6.3. Market Analysis, Insights and Forecast - by Application
- 6.3.1. Composite Materials
- 6.3.2. Textiles
- 6.3.3. Microelectrodes
- 6.3.4. Catalysis
- 6.4. Market Analysis, Insights and Forecast - by End-user Industry
- 6.4.1. Aerospace and Defense
- 6.4.2. Alternative Energy
- 6.4.3. Automotive
- 6.4.4. Construction and Infrastructure
- 6.4.5. Sporting Goods
- 6.4.6. Other En
- 6.5. Market Analysis, Insights and Forecast - by Geography
- 6.5.1. China
- 6.5.2. India
- 6.5.3. Japan
- 6.5.4. South Korea
- 6.5.5. ASEAN Countries
- 6.5.6. Rest of Asia-Pacific
- 6.1. Market Analysis, Insights and Forecast - by Raw Material
- 7. China APAC Carbon Fiber Building Materials Industry Analysis, Insights and Forecast, 2020-2032
- 7.1. Market Analysis, Insights and Forecast - by Raw Material
- 7.1.1. Polyacrtlonitrile (PAN)
- 7.1.2. Petroleum Pitch and Rayon
- 7.2. Market Analysis, Insights and Forecast - by Type
- 7.2.1. Virgin Fiber (VCF)
- 7.2.2. Recycled Fiber (RCF)
- 7.3. Market Analysis, Insights and Forecast - by Application
- 7.3.1. Composite Materials
- 7.3.2. Textiles
- 7.3.3. Microelectrodes
- 7.3.4. Catalysis
- 7.4. Market Analysis, Insights and Forecast - by End-user Industry
- 7.4.1. Aerospace and Defense
- 7.4.2. Alternative Energy
- 7.4.3. Automotive
- 7.4.4. Construction and Infrastructure
- 7.4.5. Sporting Goods
- 7.4.6. Other En
- 7.5. Market Analysis, Insights and Forecast - by Geography
- 7.5.1. China
- 7.5.2. India
- 7.5.3. Japan
- 7.5.4. South Korea
- 7.5.5. ASEAN Countries
- 7.5.6. Rest of Asia-Pacific
- 7.1. Market Analysis, Insights and Forecast - by Raw Material
- 8. India APAC Carbon Fiber Building Materials Industry Analysis, Insights and Forecast, 2020-2032
- 8.1. Market Analysis, Insights and Forecast - by Raw Material
- 8.1.1. Polyacrtlonitrile (PAN)
- 8.1.2. Petroleum Pitch and Rayon
- 8.2. Market Analysis, Insights and Forecast - by Type
- 8.2.1. Virgin Fiber (VCF)
- 8.2.2. Recycled Fiber (RCF)
- 8.3. Market Analysis, Insights and Forecast - by Application
- 8.3.1. Composite Materials
- 8.3.2. Textiles
- 8.3.3. Microelectrodes
- 8.3.4. Catalysis
- 8.4. Market Analysis, Insights and Forecast - by End-user Industry
- 8.4.1. Aerospace and Defense
- 8.4.2. Alternative Energy
- 8.4.3. Automotive
- 8.4.4. Construction and Infrastructure
- 8.4.5. Sporting Goods
- 8.4.6. Other En
- 8.5. Market Analysis, Insights and Forecast - by Geography
- 8.5.1. China
- 8.5.2. India
- 8.5.3. Japan
- 8.5.4. South Korea
- 8.5.5. ASEAN Countries
- 8.5.6. Rest of Asia-Pacific
- 8.1. Market Analysis, Insights and Forecast - by Raw Material
- 9. Japan APAC Carbon Fiber Building Materials Industry Analysis, Insights and Forecast, 2020-2032
- 9.1. Market Analysis, Insights and Forecast - by Raw Material
- 9.1.1. Polyacrtlonitrile (PAN)
- 9.1.2. Petroleum Pitch and Rayon
- 9.2. Market Analysis, Insights and Forecast - by Type
- 9.2.1. Virgin Fiber (VCF)
- 9.2.2. Recycled Fiber (RCF)
- 9.3. Market Analysis, Insights and Forecast - by Application
- 9.3.1. Composite Materials
- 9.3.2. Textiles
- 9.3.3. Microelectrodes
- 9.3.4. Catalysis
- 9.4. Market Analysis, Insights and Forecast - by End-user Industry
- 9.4.1. Aerospace and Defense
- 9.4.2. Alternative Energy
- 9.4.3. Automotive
- 9.4.4. Construction and Infrastructure
- 9.4.5. Sporting Goods
- 9.4.6. Other En
- 9.5. Market Analysis, Insights and Forecast - by Geography
- 9.5.1. China
- 9.5.2. India
- 9.5.3. Japan
- 9.5.4. South Korea
- 9.5.5. ASEAN Countries
- 9.5.6. Rest of Asia-Pacific
- 9.1. Market Analysis, Insights and Forecast - by Raw Material
- 10. South Korea APAC Carbon Fiber Building Materials Industry Analysis, Insights and Forecast, 2020-2032
- 10.1. Market Analysis, Insights and Forecast - by Raw Material
- 10.1.1. Polyacrtlonitrile (PAN)
- 10.1.2. Petroleum Pitch and Rayon
- 10.2. Market Analysis, Insights and Forecast - by Type
- 10.2.1. Virgin Fiber (VCF)
- 10.2.2. Recycled Fiber (RCF)
- 10.3. Market Analysis, Insights and Forecast - by Application
- 10.3.1. Composite Materials
- 10.3.2. Textiles
- 10.3.3. Microelectrodes
- 10.3.4. Catalysis
- 10.4. Market Analysis, Insights and Forecast - by End-user Industry
- 10.4.1. Aerospace and Defense
- 10.4.2. Alternative Energy
- 10.4.3. Automotive
- 10.4.4. Construction and Infrastructure
- 10.4.5. Sporting Goods
- 10.4.6. Other En
- 10.5. Market Analysis, Insights and Forecast - by Geography
- 10.5.1. China
- 10.5.2. India
- 10.5.3. Japan
- 10.5.4. South Korea
- 10.5.5. ASEAN Countries
- 10.5.6. Rest of Asia-Pacific
- 10.1. Market Analysis, Insights and Forecast - by Raw Material
- 11. ASEAN Countries APAC Carbon Fiber Building Materials Industry Analysis, Insights and Forecast, 2020-2032
- 11.1. Market Analysis, Insights and Forecast - by Raw Material
- 11.1.1. Polyacrtlonitrile (PAN)
- 11.1.2. Petroleum Pitch and Rayon
- 11.2. Market Analysis, Insights and Forecast - by Type
- 11.2.1. Virgin Fiber (VCF)
- 11.2.2. Recycled Fiber (RCF)
- 11.3. Market Analysis, Insights and Forecast - by Application
- 11.3.1. Composite Materials
- 11.3.2. Textiles
- 11.3.3. Microelectrodes
- 11.3.4. Catalysis
- 11.4. Market Analysis, Insights and Forecast - by End-user Industry
- 11.4.1. Aerospace and Defense
- 11.4.2. Alternative Energy
- 11.4.3. Automotive
- 11.4.4. Construction and Infrastructure
- 11.4.5. Sporting Goods
- 11.4.6. Other En
- 11.5. Market Analysis, Insights and Forecast - by Geography
- 11.5.1. China
- 11.5.2. India
- 11.5.3. Japan
- 11.5.4. South Korea
- 11.5.5. ASEAN Countries
- 11.5.6. Rest of Asia-Pacific
- 11.1. Market Analysis, Insights and Forecast - by Raw Material
- 12. Rest of Asia Pacific APAC Carbon Fiber Building Materials Industry Analysis, Insights and Forecast, 2020-2032
- 12.1. Market Analysis, Insights and Forecast - by Raw Material
- 12.1.1. Polyacrtlonitrile (PAN)
- 12.1.2. Petroleum Pitch and Rayon
- 12.2. Market Analysis, Insights and Forecast - by Type
- 12.2.1. Virgin Fiber (VCF)
- 12.2.2. Recycled Fiber (RCF)
- 12.3. Market Analysis, Insights and Forecast - by Application
- 12.3.1. Composite Materials
- 12.3.2. Textiles
- 12.3.3. Microelectrodes
- 12.3.4. Catalysis
- 12.4. Market Analysis, Insights and Forecast - by End-user Industry
- 12.4.1. Aerospace and Defense
- 12.4.2. Alternative Energy
- 12.4.3. Automotive
- 12.4.4. Construction and Infrastructure
- 12.4.5. Sporting Goods
- 12.4.6. Other En
- 12.5. Market Analysis, Insights and Forecast - by Geography
- 12.5.1. China
- 12.5.2. India
- 12.5.3. Japan
- 12.5.4. South Korea
- 12.5.5. ASEAN Countries
- 12.5.6. Rest of Asia-Pacific
- 12.1. Market Analysis, Insights and Forecast - by Raw Material
- 13. Competitive Analysis
- 13.1. Company Profiles
- 13.1.1 SGL Carbon
- 13.1.1.1. Company Overview
- 13.1.1.2. Products
- 13.1.1.3. Company Financials
- 13.1.1.4. SWOT Analysis
- 13.1.2 Solvay
- 13.1.2.1. Company Overview
- 13.1.2.2. Products
- 13.1.2.3. Company Financials
- 13.1.2.4. SWOT Analysis
- 13.1.3 Anshan Sinocarb Carbon Fibers Co Ltd
- 13.1.3.1. Company Overview
- 13.1.3.2. Products
- 13.1.3.3. Company Financials
- 13.1.3.4. SWOT Analysis
- 13.1.4 HYOSUNG ADVANCED MATERIALS
- 13.1.4.1. Company Overview
- 13.1.4.2. Products
- 13.1.4.3. Company Financials
- 13.1.4.4. SWOT Analysis
- 13.1.5 Nippon Graphite Fiber Co Ltd
- 13.1.5.1. Company Overview
- 13.1.5.2. Products
- 13.1.5.3. Company Financials
- 13.1.5.4. SWOT Analysis
- 13.1.6 TORAY INDUSTRIES INC
- 13.1.6.1. Company Overview
- 13.1.6.2. Products
- 13.1.6.3. Company Financials
- 13.1.6.4. SWOT Analysis
- 13.1.7 Mitsubishi Chemical Carbon Fiber and Composites Inc
- 13.1.7.1. Company Overview
- 13.1.7.2. Products
- 13.1.7.3. Company Financials
- 13.1.7.4. SWOT Analysis
- 13.1.8 Hexcel Corporation
- 13.1.8.1. Company Overview
- 13.1.8.2. Products
- 13.1.8.3. Company Financials
- 13.1.8.4. SWOT Analysis
- 13.1.9 Formosa Plastics Corporation
- 13.1.9.1. Company Overview
- 13.1.9.2. Products
- 13.1.9.3. Company Financials
- 13.1.9.4. SWOT Analysis
- 13.1.10 TEIJIN LIMITED
- 13.1.10.1. Company Overview
- 13.1.10.2. Products
- 13.1.10.3. Company Financials
- 13.1.10.4. SWOT Analysis
- 13.1.11 Zhongfu Shenying Carbon Fiber Co Ltd*List Not Exhaustive
- 13.1.11.1. Company Overview
- 13.1.11.2. Products
- 13.1.11.3. Company Financials
- 13.1.11.4. SWOT Analysis
- 13.1.1 SGL Carbon
- 13.2. Market Entropy
- 13.2.1 Company's Key Areas Served
- 13.2.2 Recent Developments
- 13.3. Company Market Share Analysis 2025
- 13.3.1 Top 5 Companies Market Share Analysis
- 13.3.2 Top 3 Companies Market Share Analysis
- 13.4. List of Potential Customers
- 14. Research Methodology
List of Figures
- Figure 1: Global APAC Carbon Fiber Building Materials Industry Revenue Breakdown (billion, %) by Region 2025 & 2033
- Figure 2: China APAC Carbon Fiber Building Materials Industry Revenue (billion), by Raw Material 2025 & 2033
- Figure 3: China APAC Carbon Fiber Building Materials Industry Revenue Share (%), by Raw Material 2025 & 2033
- Figure 4: China APAC Carbon Fiber Building Materials Industry Revenue (billion), by Type 2025 & 2033
- Figure 5: China APAC Carbon Fiber Building Materials Industry Revenue Share (%), by Type 2025 & 2033
- Figure 6: China APAC Carbon Fiber Building Materials Industry Revenue (billion), by Application 2025 & 2033
- Figure 7: China APAC Carbon Fiber Building Materials Industry Revenue Share (%), by Application 2025 & 2033
- Figure 8: China APAC Carbon Fiber Building Materials Industry Revenue (billion), by End-user Industry 2025 & 2033
- Figure 9: China APAC Carbon Fiber Building Materials Industry Revenue Share (%), by End-user Industry 2025 & 2033
- Figure 10: China APAC Carbon Fiber Building Materials Industry Revenue (billion), by Geography 2025 & 2033
- Figure 11: China APAC Carbon Fiber Building Materials Industry Revenue Share (%), by Geography 2025 & 2033
- Figure 12: China APAC Carbon Fiber Building Materials Industry Revenue (billion), by Country 2025 & 2033
- Figure 13: China APAC Carbon Fiber Building Materials Industry Revenue Share (%), by Country 2025 & 2033
- Figure 14: India APAC Carbon Fiber Building Materials Industry Revenue (billion), by Raw Material 2025 & 2033
- Figure 15: India APAC Carbon Fiber Building Materials Industry Revenue Share (%), by Raw Material 2025 & 2033
- Figure 16: India APAC Carbon Fiber Building Materials Industry Revenue (billion), by Type 2025 & 2033
- Figure 17: India APAC Carbon Fiber Building Materials Industry Revenue Share (%), by Type 2025 & 2033
- Figure 18: India APAC Carbon Fiber Building Materials Industry Revenue (billion), by Application 2025 & 2033
- Figure 19: India APAC Carbon Fiber Building Materials Industry Revenue Share (%), by Application 2025 & 2033
- Figure 20: India APAC Carbon Fiber Building Materials Industry Revenue (billion), by End-user Industry 2025 & 2033
- Figure 21: India APAC Carbon Fiber Building Materials Industry Revenue Share (%), by End-user Industry 2025 & 2033
- Figure 22: India APAC Carbon Fiber Building Materials Industry Revenue (billion), by Geography 2025 & 2033
- Figure 23: India APAC Carbon Fiber Building Materials Industry Revenue Share (%), by Geography 2025 & 2033
- Figure 24: India APAC Carbon Fiber Building Materials Industry Revenue (billion), by Country 2025 & 2033
- Figure 25: India APAC Carbon Fiber Building Materials Industry Revenue Share (%), by Country 2025 & 2033
- Figure 26: Japan APAC Carbon Fiber Building Materials Industry Revenue (billion), by Raw Material 2025 & 2033
- Figure 27: Japan APAC Carbon Fiber Building Materials Industry Revenue Share (%), by Raw Material 2025 & 2033
- Figure 28: Japan APAC Carbon Fiber Building Materials Industry Revenue (billion), by Type 2025 & 2033
- Figure 29: Japan APAC Carbon Fiber Building Materials Industry Revenue Share (%), by Type 2025 & 2033
- Figure 30: Japan APAC Carbon Fiber Building Materials Industry Revenue (billion), by Application 2025 & 2033
- Figure 31: Japan APAC Carbon Fiber Building Materials Industry Revenue Share (%), by Application 2025 & 2033
- Figure 32: Japan APAC Carbon Fiber Building Materials Industry Revenue (billion), by End-user Industry 2025 & 2033
- Figure 33: Japan APAC Carbon Fiber Building Materials Industry Revenue Share (%), by End-user Industry 2025 & 2033
- Figure 34: Japan APAC Carbon Fiber Building Materials Industry Revenue (billion), by Geography 2025 & 2033
- Figure 35: Japan APAC Carbon Fiber Building Materials Industry Revenue Share (%), by Geography 2025 & 2033
- Figure 36: Japan APAC Carbon Fiber Building Materials Industry Revenue (billion), by Country 2025 & 2033
- Figure 37: Japan APAC Carbon Fiber Building Materials Industry Revenue Share (%), by Country 2025 & 2033
- Figure 38: South Korea APAC Carbon Fiber Building Materials Industry Revenue (billion), by Raw Material 2025 & 2033
- Figure 39: South Korea APAC Carbon Fiber Building Materials Industry Revenue Share (%), by Raw Material 2025 & 2033
- Figure 40: South Korea APAC Carbon Fiber Building Materials Industry Revenue (billion), by Type 2025 & 2033
- Figure 41: South Korea APAC Carbon Fiber Building Materials Industry Revenue Share (%), by Type 2025 & 2033
- Figure 42: South Korea APAC Carbon Fiber Building Materials Industry Revenue (billion), by Application 2025 & 2033
- Figure 43: South Korea APAC Carbon Fiber Building Materials Industry Revenue Share (%), by Application 2025 & 2033
- Figure 44: South Korea APAC Carbon Fiber Building Materials Industry Revenue (billion), by End-user Industry 2025 & 2033
- Figure 45: South Korea APAC Carbon Fiber Building Materials Industry Revenue Share (%), by End-user Industry 2025 & 2033
- Figure 46: South Korea APAC Carbon Fiber Building Materials Industry Revenue (billion), by Geography 2025 & 2033
- Figure 47: South Korea APAC Carbon Fiber Building Materials Industry Revenue Share (%), by Geography 2025 & 2033
- Figure 48: South Korea APAC Carbon Fiber Building Materials Industry Revenue (billion), by Country 2025 & 2033
- Figure 49: South Korea APAC Carbon Fiber Building Materials Industry Revenue Share (%), by Country 2025 & 2033
- Figure 50: ASEAN Countries APAC Carbon Fiber Building Materials Industry Revenue (billion), by Raw Material 2025 & 2033
- Figure 51: ASEAN Countries APAC Carbon Fiber Building Materials Industry Revenue Share (%), by Raw Material 2025 & 2033
- Figure 52: ASEAN Countries APAC Carbon Fiber Building Materials Industry Revenue (billion), by Type 2025 & 2033
- Figure 53: ASEAN Countries APAC Carbon Fiber Building Materials Industry Revenue Share (%), by Type 2025 & 2033
- Figure 54: ASEAN Countries APAC Carbon Fiber Building Materials Industry Revenue (billion), by Application 2025 & 2033
- Figure 55: ASEAN Countries APAC Carbon Fiber Building Materials Industry Revenue Share (%), by Application 2025 & 2033
- Figure 56: ASEAN Countries APAC Carbon Fiber Building Materials Industry Revenue (billion), by End-user Industry 2025 & 2033
- Figure 57: ASEAN Countries APAC Carbon Fiber Building Materials Industry Revenue Share (%), by End-user Industry 2025 & 2033
- Figure 58: ASEAN Countries APAC Carbon Fiber Building Materials Industry Revenue (billion), by Geography 2025 & 2033
- Figure 59: ASEAN Countries APAC Carbon Fiber Building Materials Industry Revenue Share (%), by Geography 2025 & 2033
- Figure 60: ASEAN Countries APAC Carbon Fiber Building Materials Industry Revenue (billion), by Country 2025 & 2033
- Figure 61: ASEAN Countries APAC Carbon Fiber Building Materials Industry Revenue Share (%), by Country 2025 & 2033
- Figure 62: Rest of Asia Pacific APAC Carbon Fiber Building Materials Industry Revenue (billion), by Raw Material 2025 & 2033
- Figure 63: Rest of Asia Pacific APAC Carbon Fiber Building Materials Industry Revenue Share (%), by Raw Material 2025 & 2033
- Figure 64: Rest of Asia Pacific APAC Carbon Fiber Building Materials Industry Revenue (billion), by Type 2025 & 2033
- Figure 65: Rest of Asia Pacific APAC Carbon Fiber Building Materials Industry Revenue Share (%), by Type 2025 & 2033
- Figure 66: Rest of Asia Pacific APAC Carbon Fiber Building Materials Industry Revenue (billion), by Application 2025 & 2033
- Figure 67: Rest of Asia Pacific APAC Carbon Fiber Building Materials Industry Revenue Share (%), by Application 2025 & 2033
- Figure 68: Rest of Asia Pacific APAC Carbon Fiber Building Materials Industry Revenue (billion), by End-user Industry 2025 & 2033
- Figure 69: Rest of Asia Pacific APAC Carbon Fiber Building Materials Industry Revenue Share (%), by End-user Industry 2025 & 2033
- Figure 70: Rest of Asia Pacific APAC Carbon Fiber Building Materials Industry Revenue (billion), by Geography 2025 & 2033
- Figure 71: Rest of Asia Pacific APAC Carbon Fiber Building Materials Industry Revenue Share (%), by Geography 2025 & 2033
- Figure 72: Rest of Asia Pacific APAC Carbon Fiber Building Materials Industry Revenue (billion), by Country 2025 & 2033
- Figure 73: Rest of Asia Pacific APAC Carbon Fiber Building Materials Industry Revenue Share (%), by Country 2025 & 2033
List of Tables
- Table 1: Global APAC Carbon Fiber Building Materials Industry Revenue billion Forecast, by Raw Material 2020 & 2033
- Table 2: Global APAC Carbon Fiber Building Materials Industry Revenue billion Forecast, by Type 2020 & 2033
- Table 3: Global APAC Carbon Fiber Building Materials Industry Revenue billion Forecast, by Application 2020 & 2033
- Table 4: Global APAC Carbon Fiber Building Materials Industry Revenue billion Forecast, by End-user Industry 2020 & 2033
- Table 5: Global APAC Carbon Fiber Building Materials Industry Revenue billion Forecast, by Geography 2020 & 2033
- Table 6: Global APAC Carbon Fiber Building Materials Industry Revenue billion Forecast, by Region 2020 & 2033
- Table 7: Global APAC Carbon Fiber Building Materials Industry Revenue billion Forecast, by Raw Material 2020 & 2033
- Table 8: Global APAC Carbon Fiber Building Materials Industry Revenue billion Forecast, by Type 2020 & 2033
- Table 9: Global APAC Carbon Fiber Building Materials Industry Revenue billion Forecast, by Application 2020 & 2033
- Table 10: Global APAC Carbon Fiber Building Materials Industry Revenue billion Forecast, by End-user Industry 2020 & 2033
- Table 11: Global APAC Carbon Fiber Building Materials Industry Revenue billion Forecast, by Geography 2020 & 2033
- Table 12: Global APAC Carbon Fiber Building Materials Industry Revenue billion Forecast, by Country 2020 & 2033
- Table 13: Global APAC Carbon Fiber Building Materials Industry Revenue billion Forecast, by Raw Material 2020 & 2033
- Table 14: Global APAC Carbon Fiber Building Materials Industry Revenue billion Forecast, by Type 2020 & 2033
- Table 15: Global APAC Carbon Fiber Building Materials Industry Revenue billion Forecast, by Application 2020 & 2033
- Table 16: Global APAC Carbon Fiber Building Materials Industry Revenue billion Forecast, by End-user Industry 2020 & 2033
- Table 17: Global APAC Carbon Fiber Building Materials Industry Revenue billion Forecast, by Geography 2020 & 2033
- Table 18: Global APAC Carbon Fiber Building Materials Industry Revenue billion Forecast, by Country 2020 & 2033
- Table 19: Global APAC Carbon Fiber Building Materials Industry Revenue billion Forecast, by Raw Material 2020 & 2033
- Table 20: Global APAC Carbon Fiber Building Materials Industry Revenue billion Forecast, by Type 2020 & 2033
- Table 21: Global APAC Carbon Fiber Building Materials Industry Revenue billion Forecast, by Application 2020 & 2033
- Table 22: Global APAC Carbon Fiber Building Materials Industry Revenue billion Forecast, by End-user Industry 2020 & 2033
- Table 23: Global APAC Carbon Fiber Building Materials Industry Revenue billion Forecast, by Geography 2020 & 2033
- Table 24: Global APAC Carbon Fiber Building Materials Industry Revenue billion Forecast, by Country 2020 & 2033
- Table 25: Global APAC Carbon Fiber Building Materials Industry Revenue billion Forecast, by Raw Material 2020 & 2033
- Table 26: Global APAC Carbon Fiber Building Materials Industry Revenue billion Forecast, by Type 2020 & 2033
- Table 27: Global APAC Carbon Fiber Building Materials Industry Revenue billion Forecast, by Application 2020 & 2033
- Table 28: Global APAC Carbon Fiber Building Materials Industry Revenue billion Forecast, by End-user Industry 2020 & 2033
- Table 29: Global APAC Carbon Fiber Building Materials Industry Revenue billion Forecast, by Geography 2020 & 2033
- Table 30: Global APAC Carbon Fiber Building Materials Industry Revenue billion Forecast, by Country 2020 & 2033
- Table 31: Global APAC Carbon Fiber Building Materials Industry Revenue billion Forecast, by Raw Material 2020 & 2033
- Table 32: Global APAC Carbon Fiber Building Materials Industry Revenue billion Forecast, by Type 2020 & 2033
- Table 33: Global APAC Carbon Fiber Building Materials Industry Revenue billion Forecast, by Application 2020 & 2033
- Table 34: Global APAC Carbon Fiber Building Materials Industry Revenue billion Forecast, by End-user Industry 2020 & 2033
- Table 35: Global APAC Carbon Fiber Building Materials Industry Revenue billion Forecast, by Geography 2020 & 2033
- Table 36: Global APAC Carbon Fiber Building Materials Industry Revenue billion Forecast, by Country 2020 & 2033
- Table 37: Global APAC Carbon Fiber Building Materials Industry Revenue billion Forecast, by Raw Material 2020 & 2033
- Table 38: Global APAC Carbon Fiber Building Materials Industry Revenue billion Forecast, by Type 2020 & 2033
- Table 39: Global APAC Carbon Fiber Building Materials Industry Revenue billion Forecast, by Application 2020 & 2033
- Table 40: Global APAC Carbon Fiber Building Materials Industry Revenue billion Forecast, by End-user Industry 2020 & 2033
- Table 41: Global APAC Carbon Fiber Building Materials Industry Revenue billion Forecast, by Geography 2020 & 2033
- Table 42: Global APAC Carbon Fiber Building Materials Industry Revenue billion Forecast, by Country 2020 & 2033
Frequently Asked Questions
1. What is the projected Compound Annual Growth Rate (CAGR) of the APAC Carbon Fiber Building Materials Industry?
The projected CAGR is approximately 10.9%.
2. Which companies are prominent players in the APAC Carbon Fiber Building Materials Industry?
Key companies in the market include SGL Carbon, Solvay, Anshan Sinocarb Carbon Fibers Co Ltd, HYOSUNG ADVANCED MATERIALS, Nippon Graphite Fiber Co Ltd, TORAY INDUSTRIES INC, Mitsubishi Chemical Carbon Fiber and Composites Inc, Hexcel Corporation, Formosa Plastics Corporation, TEIJIN LIMITED, Zhongfu Shenying Carbon Fiber Co Ltd*List Not Exhaustive.
3. What are the main segments of the APAC Carbon Fiber Building Materials Industry?
The market segments include Raw Material, Type, Application, End-user Industry, Geography.
4. Can you provide details about the market size?
The market size is estimated to be USD 6.4 billion as of 2022.
5. What are some drivers contributing to market growth?
Increasing Demand for Fuel-efficient and Lightweight Vehicles.
6. What are the notable trends driving market growth?
Aerospace and Defense Segment to Dominate the Market.
7. Are there any restraints impacting market growth?
Concerns Related to Raw Materials.
8. Can you provide examples of recent developments in the market?
In April 2021, Hyosung Advanced Materials announced that it had signed a long-term contract to supply Hanwha Solutions with high-strength carbon fiber to be used to reinforce fuel tanks for hydrogen vehicles for six years from 2021. The supply is worth about 160 billion won (USD 144 million).
9. What pricing options are available for accessing the report?
Pricing options include single-user, multi-user, and enterprise licenses priced at USD 4750, USD 5250, and USD 8750 respectively.
10. Is the market size provided in terms of value or volume?
The market size is provided in terms of value, measured in billion.
11. Are there any specific market keywords associated with the report?
Yes, the market keyword associated with the report is "APAC Carbon Fiber Building Materials Industry," which aids in identifying and referencing the specific market segment covered.
12. How do I determine which pricing option suits my needs best?
The pricing options vary based on user requirements and access needs. Individual users may opt for single-user licenses, while businesses requiring broader access may choose multi-user or enterprise licenses for cost-effective access to the report.
13. Are there any additional resources or data provided in the APAC Carbon Fiber Building Materials Industry report?
While the report offers comprehensive insights, it's advisable to review the specific contents or supplementary materials provided to ascertain if additional resources or data are available.
14. How can I stay updated on further developments or reports in the APAC Carbon Fiber Building Materials Industry?
To stay informed about further developments, trends, and reports in the APAC Carbon Fiber Building Materials Industry, consider subscribing to industry newsletters, following relevant companies and organizations, or regularly checking reputable industry news sources and publications.
Methodology
Step 1 - Identification of Relevant Samples Size from Population Database


Step 2 - Approaches for Defining Global Market Size (Value, Volume* & Price*)

Note*: In applicable scenarios
Step 3 - Data Sources
Primary Research
- Web Analytics
- Survey Reports
- Research Institute
- Latest Research Reports
- Opinion Leaders
Secondary Research
- Annual Reports
- White Paper
- Latest Press Release
- Industry Association
- Paid Database
- Investor Presentations

Step 4 - Data Triangulation
Involves using different sources of information in order to increase the validity of a study
These sources are likely to be stakeholders in a program - participants, other researchers, program staff, other community members, and so on.
Then we put all data in single framework & apply various statistical tools to find out the dynamic on the market.
During the analysis stage, feedback from the stakeholder groups would be compared to determine areas of agreement as well as areas of divergence