

Key Insights
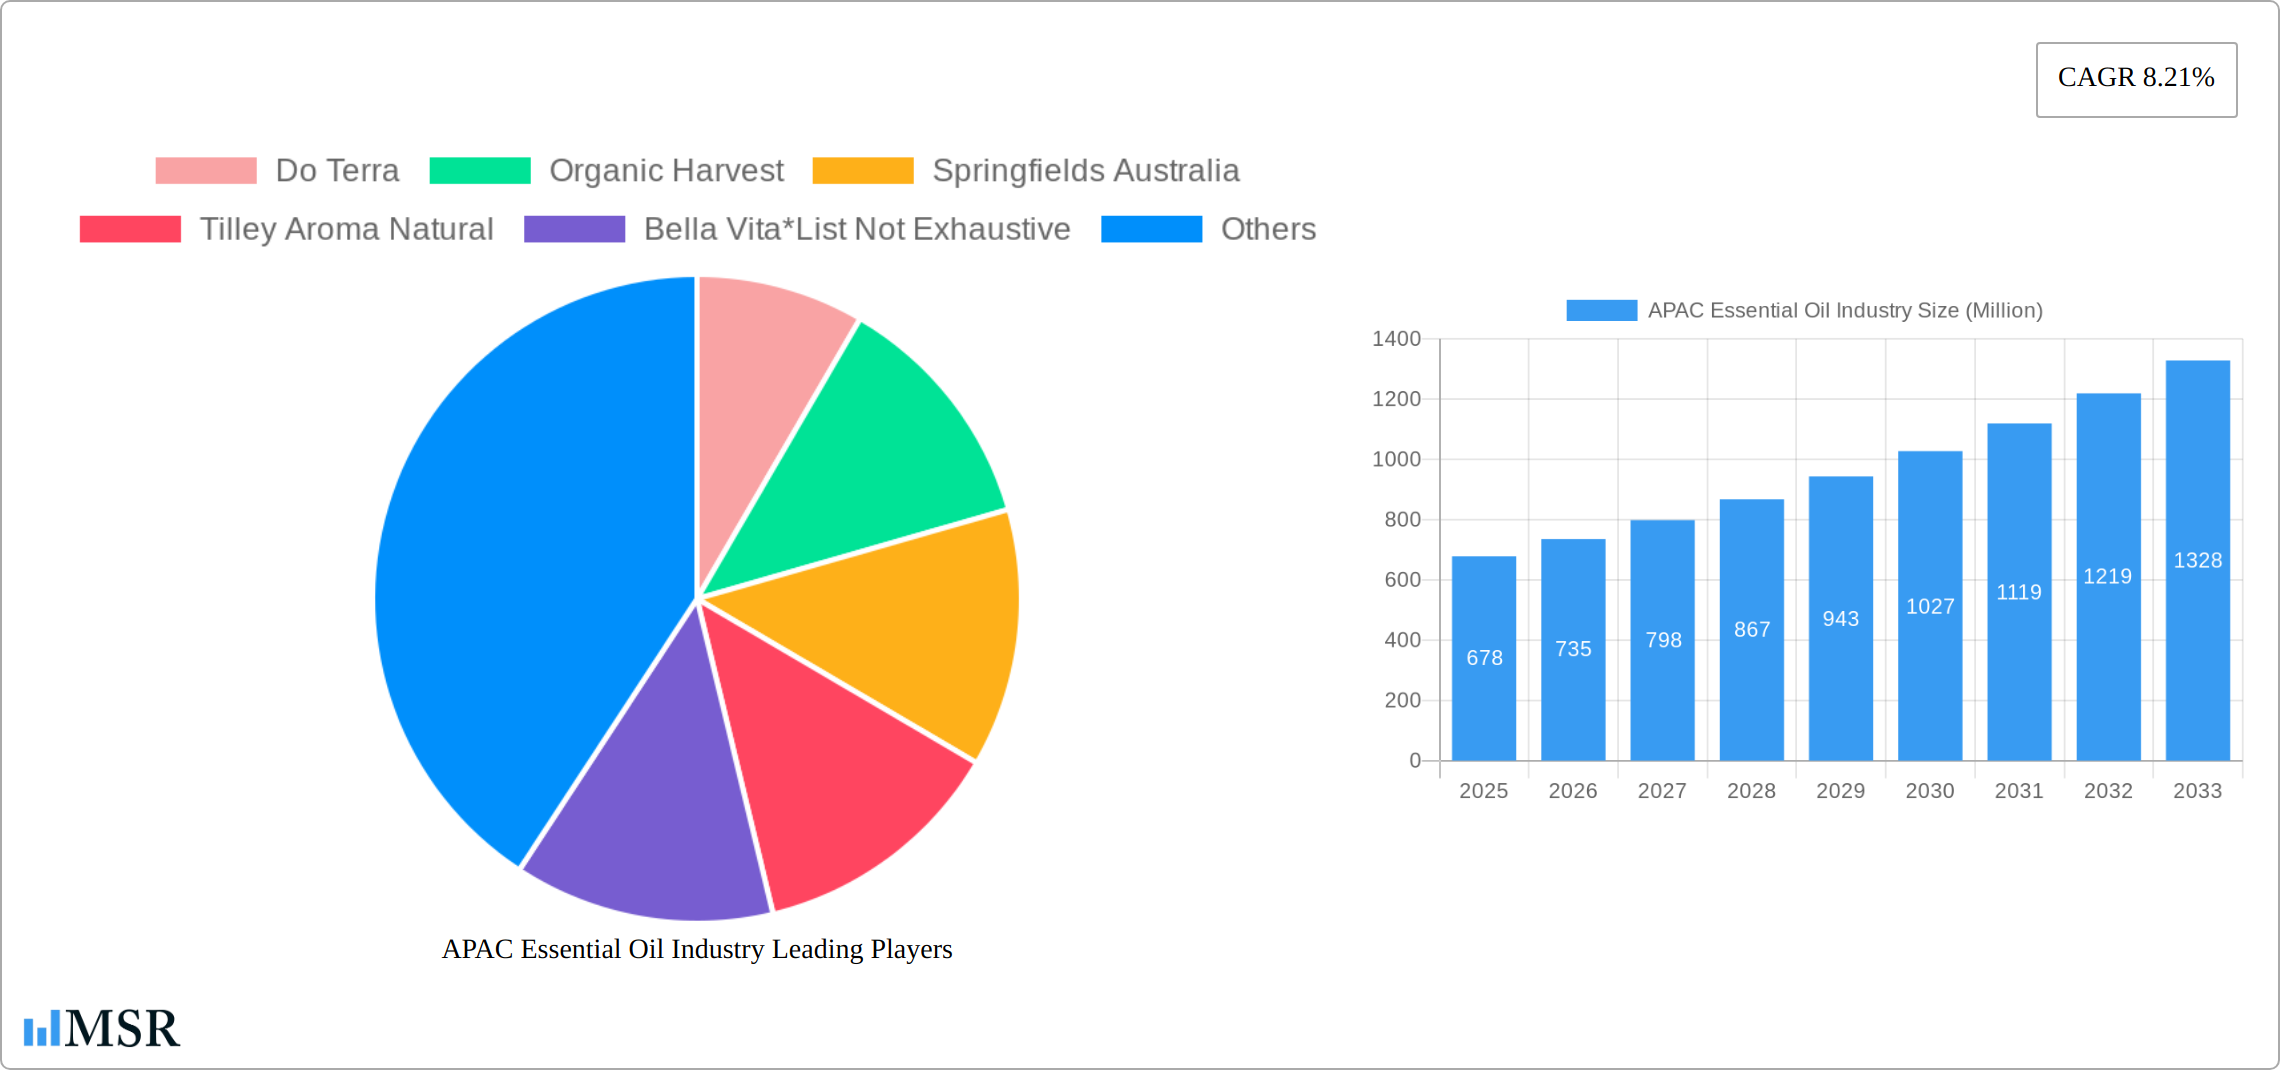
The Asia-Pacific (APAC) essential oil market presents a significant growth opportunity, driven by rising consumer awareness of natural and holistic wellness solutions. The region's diverse cultures and traditions, coupled with increasing disposable incomes, particularly in rapidly developing economies like India and China, fuel strong demand for aromatherapy, personal care products, and food & beverage applications incorporating essential oils. The market's expansion is further fueled by the burgeoning popularity of natural remedies and the increasing prevalence of stress and anxiety, leading consumers to seek natural alternatives for relaxation and well-being. While the exact market size for APAC in 2025 is not explicitly stated, considering the global market size of $2.26 billion and a projected CAGR of 8.21%, a reasonable estimate for the APAC regional market share in 2025 could range from 25% to 35% given the significant population and growth in the region, resulting in a market value between $565 million and $791 million. This estimate accounts for the relatively high growth rates anticipated in the region compared to more mature markets in North America and Europe.
Looking ahead, several key trends will shape the future of the APAC essential oil market. The increasing preference for organic and sustainably sourced products will drive demand for certified organic essential oils. Innovation in product formulation, with a focus on developing unique blends and targeted applications, will also contribute to growth. The expansion of e-commerce platforms provides increased access to essential oil products, especially in less-penetrated regions. However, challenges remain, including maintaining consistent product quality and addressing potential supply chain disruptions due to the reliance on agricultural production. Furthermore, regulatory hurdles and consumer education regarding the proper and safe usage of essential oils remain crucial aspects influencing market expansion. The anticipated CAGR of 8.21% suggests substantial growth through 2033, with the market likely exceeding $1.5 billion based on compound growth projection from the 2025 estimated value.
APAC Essential Oil Industry: A Comprehensive Market Report (2019-2033)
This comprehensive report provides an in-depth analysis of the Asia-Pacific (APAC) essential oil industry, covering market dynamics, key segments, leading players, and future growth prospects from 2019 to 2033. The study period spans 2019-2024 (Historical Period), with 2025 as the base and estimated year. The forecast period is 2025-2033. This report is invaluable for industry stakeholders, investors, and businesses seeking to understand and capitalize on the opportunities within this rapidly expanding market. The total market size is estimated at xx Million in 2025, with a CAGR of xx% projected for the forecast period.
APAC Essential Oil Industry Market Concentration & Dynamics
The APAC essential oil market presents a dynamic landscape, blending multinational corporations with a robust network of smaller, regional players. While market concentration is moderate, with the top five players holding a significant, albeit evolving, market share (precise figures require further analysis and will be updated in the next report), the industry is characterized by considerable dynamism. Innovation is a key driver, spearheaded by both established industry leaders and agile startups focusing on sustainable sourcing practices, cutting-edge extraction techniques, and diversifying product offerings to cater to evolving consumer preferences. The regulatory environment across APAC nations remains diverse, influencing aspects such as product labeling, safety standards, and import/export procedures. This regulatory variation presents both challenges and opportunities for market participants. The market faces competition from synthetic fragrances, but the strong and persistent consumer preference for natural and organic products continues to be a powerful growth catalyst. End-user trends highlight the escalating demand for essential oils across diverse applications, including aromatherapy, the burgeoning cosmetics and personal care sectors, and the expanding food and beverage industries. Mergers and acquisitions (M&A) activity has been notable, with a considerable number of deals recorded in recent years (specific deal counts require further investigation and will be updated in the next report).
- Key Market Dynamics:
- Moderately concentrated market with evolving market share dynamics
- Strong and sustained growth driven by consumer demand for natural and organic products
- Increasing adoption across a wide range of applications, fueling market expansion
- Diverse and evolving regulatory landscapes across APAC nations
- Significant M&A activity reshaping the competitive landscape
APAC Essential Oil Industry Industry Insights & Trends
The APAC essential oil market is experiencing robust growth, driven by increasing consumer awareness of the therapeutic benefits of essential oils and a rise in disposable incomes across the region. Technological advancements in extraction and processing techniques are improving product quality and efficiency. Evolving consumer behaviors, particularly a focus on wellness and self-care, are fueling demand. The market size is projected to reach xx Million by 2033. Technological disruptions are centered around sustainable sourcing, advanced distillation methods, and the development of innovative delivery systems for essential oil products. The market is witnessing the rise of online retail channels and direct-to-consumer sales models, further accelerating growth.

Key Markets & Segments Leading APAC Essential Oil Industry
Within the thriving APAC essential oil market, specific segments and regions are exhibiting exceptional growth. China and India, fueled by their expansive populations and burgeoning middle classes, stand out as leading markets. The aromatherapy and personal care sectors are demonstrating particularly robust growth. Among the most popular essential oils are lavender, tea tree, and eucalyptus oils, owing to their versatility and established market presence. However, other oils are gaining traction, driven by both evolving consumer needs and the innovation described above.
Key Market Drivers:
- Expansion of the middle class and associated increases in disposable income
- Heightened consumer awareness of the health and wellness benefits of essential oils
- Continuously expanding applications across a growing number of industries
- Persistent and strong demand for natural and organic products
- Favorable government policies in select APAC countries supporting the industry's growth, balanced by regulatory complexities elsewhere.
Dominant Segments:
- Product Type: Lavender Oil, Tea Tree Oil, Eucalyptus Oil, and a growing portfolio of other specialty oils.
- Application: Aromatherapy, Cosmetics & Personal Care, Food & Beverage, and other emerging applications.
APAC Essential Oil Industry Product Developments
Recent innovations within the APAC essential oil industry are heavily focused on enhancing convenience, efficacy, and sustainability. Companies are actively developing innovative essential oil blends tailored for specific therapeutic purposes and are continually exploring and introducing essential oils into novel product formats, such as roll-on applicators and technologically advanced diffusers. Sustainable sourcing practices are increasingly prioritized, reflecting both consumer preferences and proactive corporate responsibility. Technological advancements in extraction methods are leading to improvements in both the quality and yield of essential oils, while simultaneously minimizing environmental impact. In this competitive market, the ability to innovate, effectively communicate brand values, and implement successful marketing strategies is becoming increasingly crucial for market success.
Challenges in the APAP Essential Oil Industry Market
The APAC essential oil market faces challenges including fluctuating raw material prices, stringent regulatory requirements in some markets, and intense competition from synthetic fragrance alternatives. Supply chain disruptions, particularly those related to raw material sourcing, can impact profitability. Counterfeit products and lack of standardization also hinder market growth, affecting consumer trust and market integrity. The estimated impact of these challenges on overall market growth is xx%.
Forces Driving APAC Essential Oil Industry Growth
The robust growth of the APAC essential oil industry is driven by a confluence of powerful factors. The rising demand for natural and organic products, fueled by a surge in health and wellness consciousness among consumers, is a key driver. The economic expansion in numerous APAC countries, coupled with a corresponding increase in disposable incomes, is stimulating consumer spending on premium products, including essential oils. Government policies in certain regions that encourage the development of natural and sustainable industries further bolster growth; however, navigating the diverse regulatory landscape remains a crucial aspect of industry success.
Long-Term Growth Catalysts in the APAC Essential Oil Industry Market
Long-term growth in the APAC essential oil industry hinges on continued innovation in product development, strategic partnerships to access new markets, and expansion into untapped segments. Investing in research and development to improve extraction methods, develop novel formulations, and explore new applications will be key. Establishing robust supply chains and collaborating with local producers to ensure sustainable sourcing will also play a crucial role in driving future growth.
Emerging Opportunities in the APAC Essential Oil Industry
Emerging opportunities lie in expanding into niche markets, exploring new applications (e.g., therapeutic uses in healthcare, incorporating essential oils into technologically advanced delivery systems), and catering to evolving consumer preferences for personalized and customized products. Growth in e-commerce and digital marketing can open new avenues for reaching consumers.
Leading Players in the APAC Essential Oil Industry Sector
- doTERRA
- Organic Harvest
- Springfields Australia
- Tilley Aroma Natural
- Bella Vita
- In Essence
- Young Living Essentials
- Auroma
- AT-Aroma Co Ltd
- Ultra International BV
- Aroma Treasures
Key Milestones in APAC Essential Oil Industry Industry
- June 2021: doTERRA expands its portfolio in Thailand, establishing a new corporate office in Bangkok and registering 80 local products.
- September 2022: Blossom Kochhar Aroma Magic launches a Neem and Tea Tree product range, expanding the market for essential oil-infused skincare.
- October 2022: doTERRA introduces new wellness products combining pure essential oils, sustainable sourcing, and research-backed formulations (Helichrysum touch, LaLuz Diffuser, Roam Diffuser, Dawn Aroma Humidifier, Balance Bath Bar, On Guard Toothpaste, and On Guard Hand Wipes).
Strategic Outlook for APAC Essential Oil Industry Market
The APAC essential oil market presents significant growth potential over the next decade. Companies focused on innovation, sustainability, and strong branding will be best positioned to capitalize on this opportunity. Strategic partnerships, market expansion into high-growth regions, and investment in research and development will be crucial factors in determining success in this dynamic market. The potential for market expansion is vast, particularly as consumer awareness of essential oil benefits continues to rise and new applications emerge.
APAC Essential Oil Industry Segmentation
-
1. Product Type
- 1.1. Lavender Oil
- 1.2. Orange Oil
- 1.3. Eucalyptus Oil
- 1.4. Peppermint Oil
- 1.5. Spearmint Oil
- 1.6. Lemon Oil
- 1.7. Rosemary Oil
- 1.8. Geranium Oil
- 1.9. Tea Tree Oil
- 1.10. Others
-
2. Application
- 2.1. Food & Beverages
- 2.2. Aromatherapy
- 2.3. Pharmaceuticals
- 2.4. Cosmetics & Personal Care
- 2.5. Others
-
3. Geography
- 3.1. China
- 3.2. India
- 3.3. Japan
- 3.4. Australia
- 3.5. Rest of Asia-Pacific
APAC Essential Oil Industry Segmentation By Geography
- 1. China
- 2. India
- 3. Japan
- 4. Australia
- 5. Rest of Asia Pacific
APAC Essential Oil Industry REPORT HIGHLIGHTS
| Aspects | Details |
|---|---|
| Study Period | 2019-2033 |
| Base Year | 2024 |
| Estimated Year | 2025 |
| Forecast Period | 2025-2033 |
| Historical Period | 2019-2024 |
| Growth Rate | CAGR of 8.21% from 2019-2033 |
| Segmentation |
|
Table of Contents
- 1. Introduction
- 1.1. Research Scope
- 1.2. Market Segmentation
- 1.3. Research Methodology
- 1.4. Definitions and Assumptions
- 2. Executive Summary
- 2.1. Introduction
- 3. Market Dynamics
- 3.1. Introduction
- 3.2. Market Drivers
- 3.2.1. Increasing awareness towards fitness among consumers; Demand for convenient fortified foods
- 3.3. Market Restrains
- 3.3.1. Increasing vegan culture in the market
- 3.4. Market Trends
- 3.4.1. Increasing Awareness Toward the Health Benefits of Essential Oil
- 4. Market Factor Analysis
- 4.1. Porters Five Forces
- 4.2. Supply/Value Chain
- 4.3. PESTEL analysis
- 4.4. Market Entropy
- 4.5. Patent/Trademark Analysis
- 5. Global APAC Essential Oil Industry Analysis, Insights and Forecast, 2019-2031
- 5.1. Market Analysis, Insights and Forecast - by Product Type
- 5.1.1. Lavender Oil
- 5.1.2. Orange Oil
- 5.1.3. Eucalyptus Oil
- 5.1.4. Peppermint Oil
- 5.1.5. Spearmint Oil
- 5.1.6. Lemon Oil
- 5.1.7. Rosemary Oil
- 5.1.8. Geranium Oil
- 5.1.9. Tea Tree Oil
- 5.1.10. Others
- 5.2. Market Analysis, Insights and Forecast - by Application
- 5.2.1. Food & Beverages
- 5.2.2. Aromatherapy
- 5.2.3. Pharmaceuticals
- 5.2.4. Cosmetics & Personal Care
- 5.2.5. Others
- 5.3. Market Analysis, Insights and Forecast - by Geography
- 5.3.1. China
- 5.3.2. India
- 5.3.3. Japan
- 5.3.4. Australia
- 5.3.5. Rest of Asia-Pacific
- 5.4. Market Analysis, Insights and Forecast - by Region
- 5.4.1. China
- 5.4.2. India
- 5.4.3. Japan
- 5.4.4. Australia
- 5.4.5. Rest of Asia Pacific
- 5.1. Market Analysis, Insights and Forecast - by Product Type
- 6. China APAC Essential Oil Industry Analysis, Insights and Forecast, 2019-2031
- 6.1. Market Analysis, Insights and Forecast - by Product Type
- 6.1.1. Lavender Oil
- 6.1.2. Orange Oil
- 6.1.3. Eucalyptus Oil
- 6.1.4. Peppermint Oil
- 6.1.5. Spearmint Oil
- 6.1.6. Lemon Oil
- 6.1.7. Rosemary Oil
- 6.1.8. Geranium Oil
- 6.1.9. Tea Tree Oil
- 6.1.10. Others
- 6.2. Market Analysis, Insights and Forecast - by Application
- 6.2.1. Food & Beverages
- 6.2.2. Aromatherapy
- 6.2.3. Pharmaceuticals
- 6.2.4. Cosmetics & Personal Care
- 6.2.5. Others
- 6.3. Market Analysis, Insights and Forecast - by Geography
- 6.3.1. China
- 6.3.2. India
- 6.3.3. Japan
- 6.3.4. Australia
- 6.3.5. Rest of Asia-Pacific
- 6.1. Market Analysis, Insights and Forecast - by Product Type
- 7. India APAC Essential Oil Industry Analysis, Insights and Forecast, 2019-2031
- 7.1. Market Analysis, Insights and Forecast - by Product Type
- 7.1.1. Lavender Oil
- 7.1.2. Orange Oil
- 7.1.3. Eucalyptus Oil
- 7.1.4. Peppermint Oil
- 7.1.5. Spearmint Oil
- 7.1.6. Lemon Oil
- 7.1.7. Rosemary Oil
- 7.1.8. Geranium Oil
- 7.1.9. Tea Tree Oil
- 7.1.10. Others
- 7.2. Market Analysis, Insights and Forecast - by Application
- 7.2.1. Food & Beverages
- 7.2.2. Aromatherapy
- 7.2.3. Pharmaceuticals
- 7.2.4. Cosmetics & Personal Care
- 7.2.5. Others
- 7.3. Market Analysis, Insights and Forecast - by Geography
- 7.3.1. China
- 7.3.2. India
- 7.3.3. Japan
- 7.3.4. Australia
- 7.3.5. Rest of Asia-Pacific
- 7.1. Market Analysis, Insights and Forecast - by Product Type
- 8. Japan APAC Essential Oil Industry Analysis, Insights and Forecast, 2019-2031
- 8.1. Market Analysis, Insights and Forecast - by Product Type
- 8.1.1. Lavender Oil
- 8.1.2. Orange Oil
- 8.1.3. Eucalyptus Oil
- 8.1.4. Peppermint Oil
- 8.1.5. Spearmint Oil
- 8.1.6. Lemon Oil
- 8.1.7. Rosemary Oil
- 8.1.8. Geranium Oil
- 8.1.9. Tea Tree Oil
- 8.1.10. Others
- 8.2. Market Analysis, Insights and Forecast - by Application
- 8.2.1. Food & Beverages
- 8.2.2. Aromatherapy
- 8.2.3. Pharmaceuticals
- 8.2.4. Cosmetics & Personal Care
- 8.2.5. Others
- 8.3. Market Analysis, Insights and Forecast - by Geography
- 8.3.1. China
- 8.3.2. India
- 8.3.3. Japan
- 8.3.4. Australia
- 8.3.5. Rest of Asia-Pacific
- 8.1. Market Analysis, Insights and Forecast - by Product Type
- 9. Australia APAC Essential Oil Industry Analysis, Insights and Forecast, 2019-2031
- 9.1. Market Analysis, Insights and Forecast - by Product Type
- 9.1.1. Lavender Oil
- 9.1.2. Orange Oil
- 9.1.3. Eucalyptus Oil
- 9.1.4. Peppermint Oil
- 9.1.5. Spearmint Oil
- 9.1.6. Lemon Oil
- 9.1.7. Rosemary Oil
- 9.1.8. Geranium Oil
- 9.1.9. Tea Tree Oil
- 9.1.10. Others
- 9.2. Market Analysis, Insights and Forecast - by Application
- 9.2.1. Food & Beverages
- 9.2.2. Aromatherapy
- 9.2.3. Pharmaceuticals
- 9.2.4. Cosmetics & Personal Care
- 9.2.5. Others
- 9.3. Market Analysis, Insights and Forecast - by Geography
- 9.3.1. China
- 9.3.2. India
- 9.3.3. Japan
- 9.3.4. Australia
- 9.3.5. Rest of Asia-Pacific
- 9.1. Market Analysis, Insights and Forecast - by Product Type
- 10. Rest of Asia Pacific APAC Essential Oil Industry Analysis, Insights and Forecast, 2019-2031
- 10.1. Market Analysis, Insights and Forecast - by Product Type
- 10.1.1. Lavender Oil
- 10.1.2. Orange Oil
- 10.1.3. Eucalyptus Oil
- 10.1.4. Peppermint Oil
- 10.1.5. Spearmint Oil
- 10.1.6. Lemon Oil
- 10.1.7. Rosemary Oil
- 10.1.8. Geranium Oil
- 10.1.9. Tea Tree Oil
- 10.1.10. Others
- 10.2. Market Analysis, Insights and Forecast - by Application
- 10.2.1. Food & Beverages
- 10.2.2. Aromatherapy
- 10.2.3. Pharmaceuticals
- 10.2.4. Cosmetics & Personal Care
- 10.2.5. Others
- 10.3. Market Analysis, Insights and Forecast - by Geography
- 10.3.1. China
- 10.3.2. India
- 10.3.3. Japan
- 10.3.4. Australia
- 10.3.5. Rest of Asia-Pacific
- 10.1. Market Analysis, Insights and Forecast - by Product Type
- 11. North America APAC Essential Oil Industry Analysis, Insights and Forecast, 2019-2031
- 11.1. Market Analysis, Insights and Forecast - By Country/Sub-region
- 11.1.1 United States
- 11.1.2 Canada
- 11.1.3 Mexico
- 12. Europe APAC Essential Oil Industry Analysis, Insights and Forecast, 2019-2031
- 12.1. Market Analysis, Insights and Forecast - By Country/Sub-region
- 12.1.1 Germany
- 12.1.2 United Kingdom
- 12.1.3 France
- 12.1.4 Spain
- 12.1.5 Italy
- 12.1.6 Spain
- 12.1.7 Belgium
- 12.1.8 Netherland
- 12.1.9 Nordics
- 12.1.10 Rest of Europe
- 13. Asia Pacific APAC Essential Oil Industry Analysis, Insights and Forecast, 2019-2031
- 13.1. Market Analysis, Insights and Forecast - By Country/Sub-region
- 13.1.1 China
- 13.1.2 Japan
- 13.1.3 India
- 13.1.4 South Korea
- 13.1.5 Southeast Asia
- 13.1.6 Australia
- 13.1.7 Indonesia
- 13.1.8 Phillipes
- 13.1.9 Singapore
- 13.1.10 Thailandc
- 13.1.11 Rest of Asia Pacific
- 14. South America APAC Essential Oil Industry Analysis, Insights and Forecast, 2019-2031
- 14.1. Market Analysis, Insights and Forecast - By Country/Sub-region
- 14.1.1 Brazil
- 14.1.2 Argentina
- 14.1.3 Peru
- 14.1.4 Chile
- 14.1.5 Colombia
- 14.1.6 Ecuador
- 14.1.7 Venezuela
- 14.1.8 Rest of South America
- 15. North America APAC Essential Oil Industry Analysis, Insights and Forecast, 2019-2031
- 15.1. Market Analysis, Insights and Forecast - By Country/Sub-region
- 15.1.1 United States
- 15.1.2 Canada
- 15.1.3 Mexico
- 16. MEA APAC Essential Oil Industry Analysis, Insights and Forecast, 2019-2031
- 16.1. Market Analysis, Insights and Forecast - By Country/Sub-region
- 16.1.1 United Arab Emirates
- 16.1.2 Saudi Arabia
- 16.1.3 South Africa
- 16.1.4 Rest of Middle East and Africa
- 17. Competitive Analysis
- 17.1. Global Market Share Analysis 2024
- 17.2. Company Profiles
- 17.2.1 Do Terra
- 17.2.1.1. Overview
- 17.2.1.2. Products
- 17.2.1.3. SWOT Analysis
- 17.2.1.4. Recent Developments
- 17.2.1.5. Financials (Based on Availability)
- 17.2.2 Organic Harvest
- 17.2.2.1. Overview
- 17.2.2.2. Products
- 17.2.2.3. SWOT Analysis
- 17.2.2.4. Recent Developments
- 17.2.2.5. Financials (Based on Availability)
- 17.2.3 Springfields Australia
- 17.2.3.1. Overview
- 17.2.3.2. Products
- 17.2.3.3. SWOT Analysis
- 17.2.3.4. Recent Developments
- 17.2.3.5. Financials (Based on Availability)
- 17.2.4 Tilley Aroma Natural
- 17.2.4.1. Overview
- 17.2.4.2. Products
- 17.2.4.3. SWOT Analysis
- 17.2.4.4. Recent Developments
- 17.2.4.5. Financials (Based on Availability)
- 17.2.5 Bella Vita*List Not Exhaustive
- 17.2.5.1. Overview
- 17.2.5.2. Products
- 17.2.5.3. SWOT Analysis
- 17.2.5.4. Recent Developments
- 17.2.5.5. Financials (Based on Availability)
- 17.2.6 In Essence
- 17.2.6.1. Overview
- 17.2.6.2. Products
- 17.2.6.3. SWOT Analysis
- 17.2.6.4. Recent Developments
- 17.2.6.5. Financials (Based on Availability)
- 17.2.7 Young Living Essentials
- 17.2.7.1. Overview
- 17.2.7.2. Products
- 17.2.7.3. SWOT Analysis
- 17.2.7.4. Recent Developments
- 17.2.7.5. Financials (Based on Availability)
- 17.2.8 Auroma
- 17.2.8.1. Overview
- 17.2.8.2. Products
- 17.2.8.3. SWOT Analysis
- 17.2.8.4. Recent Developments
- 17.2.8.5. Financials (Based on Availability)
- 17.2.9 AT-Aroma Co Ltd
- 17.2.9.1. Overview
- 17.2.9.2. Products
- 17.2.9.3. SWOT Analysis
- 17.2.9.4. Recent Developments
- 17.2.9.5. Financials (Based on Availability)
- 17.2.10 Ultra International BV
- 17.2.10.1. Overview
- 17.2.10.2. Products
- 17.2.10.3. SWOT Analysis
- 17.2.10.4. Recent Developments
- 17.2.10.5. Financials (Based on Availability)
- 17.2.11 Aroma Treasures
- 17.2.11.1. Overview
- 17.2.11.2. Products
- 17.2.11.3. SWOT Analysis
- 17.2.11.4. Recent Developments
- 17.2.11.5. Financials (Based on Availability)
- 17.2.1 Do Terra
List of Figures
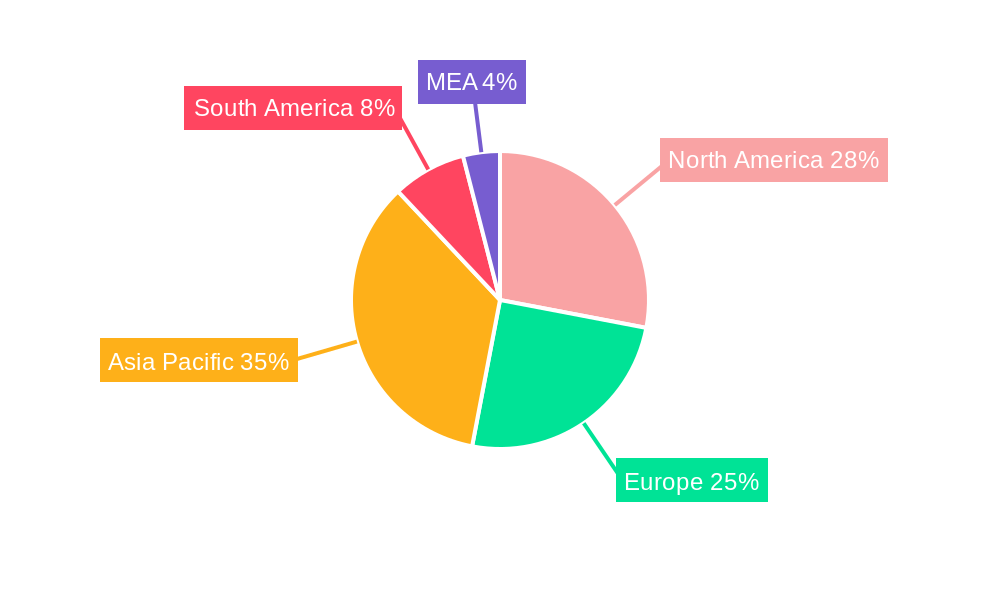
- Figure 1: Global APAC Essential Oil Industry Revenue Breakdown (Million, %) by Region 2024 & 2032
- Figure 2: Global APAC Essential Oil Industry Volume Breakdown (K Tons, %) by Region 2024 & 2032
- Figure 3: North America APAC Essential Oil Industry Revenue (Million), by Country 2024 & 2032
- Figure 4: North America APAC Essential Oil Industry Volume (K Tons), by Country 2024 & 2032
- Figure 5: North America APAC Essential Oil Industry Revenue Share (%), by Country 2024 & 2032
- Figure 6: North America APAC Essential Oil Industry Volume Share (%), by Country 2024 & 2032
- Figure 7: Europe APAC Essential Oil Industry Revenue (Million), by Country 2024 & 2032
- Figure 8: Europe APAC Essential Oil Industry Volume (K Tons), by Country 2024 & 2032
- Figure 9: Europe APAC Essential Oil Industry Revenue Share (%), by Country 2024 & 2032
- Figure 10: Europe APAC Essential Oil Industry Volume Share (%), by Country 2024 & 2032
- Figure 11: Asia Pacific APAC Essential Oil Industry Revenue (Million), by Country 2024 & 2032
- Figure 12: Asia Pacific APAC Essential Oil Industry Volume (K Tons), by Country 2024 & 2032
- Figure 13: Asia Pacific APAC Essential Oil Industry Revenue Share (%), by Country 2024 & 2032
- Figure 14: Asia Pacific APAC Essential Oil Industry Volume Share (%), by Country 2024 & 2032
- Figure 15: South America APAC Essential Oil Industry Revenue (Million), by Country 2024 & 2032
- Figure 16: South America APAC Essential Oil Industry Volume (K Tons), by Country 2024 & 2032
- Figure 17: South America APAC Essential Oil Industry Revenue Share (%), by Country 2024 & 2032
- Figure 18: South America APAC Essential Oil Industry Volume Share (%), by Country 2024 & 2032
- Figure 19: North America APAC Essential Oil Industry Revenue (Million), by Country 2024 & 2032
- Figure 20: North America APAC Essential Oil Industry Volume (K Tons), by Country 2024 & 2032
- Figure 21: North America APAC Essential Oil Industry Revenue Share (%), by Country 2024 & 2032
- Figure 22: North America APAC Essential Oil Industry Volume Share (%), by Country 2024 & 2032
- Figure 23: MEA APAC Essential Oil Industry Revenue (Million), by Country 2024 & 2032
- Figure 24: MEA APAC Essential Oil Industry Volume (K Tons), by Country 2024 & 2032
- Figure 25: MEA APAC Essential Oil Industry Revenue Share (%), by Country 2024 & 2032
- Figure 26: MEA APAC Essential Oil Industry Volume Share (%), by Country 2024 & 2032
- Figure 27: China APAC Essential Oil Industry Revenue (Million), by Product Type 2024 & 2032
- Figure 28: China APAC Essential Oil Industry Volume (K Tons), by Product Type 2024 & 2032
- Figure 29: China APAC Essential Oil Industry Revenue Share (%), by Product Type 2024 & 2032
- Figure 30: China APAC Essential Oil Industry Volume Share (%), by Product Type 2024 & 2032
- Figure 31: China APAC Essential Oil Industry Revenue (Million), by Application 2024 & 2032
- Figure 32: China APAC Essential Oil Industry Volume (K Tons), by Application 2024 & 2032
- Figure 33: China APAC Essential Oil Industry Revenue Share (%), by Application 2024 & 2032
- Figure 34: China APAC Essential Oil Industry Volume Share (%), by Application 2024 & 2032
- Figure 35: China APAC Essential Oil Industry Revenue (Million), by Geography 2024 & 2032
- Figure 36: China APAC Essential Oil Industry Volume (K Tons), by Geography 2024 & 2032
- Figure 37: China APAC Essential Oil Industry Revenue Share (%), by Geography 2024 & 2032
- Figure 38: China APAC Essential Oil Industry Volume Share (%), by Geography 2024 & 2032
- Figure 39: China APAC Essential Oil Industry Revenue (Million), by Country 2024 & 2032
- Figure 40: China APAC Essential Oil Industry Volume (K Tons), by Country 2024 & 2032
- Figure 41: China APAC Essential Oil Industry Revenue Share (%), by Country 2024 & 2032
- Figure 42: China APAC Essential Oil Industry Volume Share (%), by Country 2024 & 2032
- Figure 43: India APAC Essential Oil Industry Revenue (Million), by Product Type 2024 & 2032
- Figure 44: India APAC Essential Oil Industry Volume (K Tons), by Product Type 2024 & 2032
- Figure 45: India APAC Essential Oil Industry Revenue Share (%), by Product Type 2024 & 2032
- Figure 46: India APAC Essential Oil Industry Volume Share (%), by Product Type 2024 & 2032
- Figure 47: India APAC Essential Oil Industry Revenue (Million), by Application 2024 & 2032
- Figure 48: India APAC Essential Oil Industry Volume (K Tons), by Application 2024 & 2032
- Figure 49: India APAC Essential Oil Industry Revenue Share (%), by Application 2024 & 2032
- Figure 50: India APAC Essential Oil Industry Volume Share (%), by Application 2024 & 2032
- Figure 51: India APAC Essential Oil Industry Revenue (Million), by Geography 2024 & 2032
- Figure 52: India APAC Essential Oil Industry Volume (K Tons), by Geography 2024 & 2032
- Figure 53: India APAC Essential Oil Industry Revenue Share (%), by Geography 2024 & 2032
- Figure 54: India APAC Essential Oil Industry Volume Share (%), by Geography 2024 & 2032
- Figure 55: India APAC Essential Oil Industry Revenue (Million), by Country 2024 & 2032
- Figure 56: India APAC Essential Oil Industry Volume (K Tons), by Country 2024 & 2032
- Figure 57: India APAC Essential Oil Industry Revenue Share (%), by Country 2024 & 2032
- Figure 58: India APAC Essential Oil Industry Volume Share (%), by Country 2024 & 2032
- Figure 59: Japan APAC Essential Oil Industry Revenue (Million), by Product Type 2024 & 2032
- Figure 60: Japan APAC Essential Oil Industry Volume (K Tons), by Product Type 2024 & 2032
- Figure 61: Japan APAC Essential Oil Industry Revenue Share (%), by Product Type 2024 & 2032
- Figure 62: Japan APAC Essential Oil Industry Volume Share (%), by Product Type 2024 & 2032
- Figure 63: Japan APAC Essential Oil Industry Revenue (Million), by Application 2024 & 2032
- Figure 64: Japan APAC Essential Oil Industry Volume (K Tons), by Application 2024 & 2032
- Figure 65: Japan APAC Essential Oil Industry Revenue Share (%), by Application 2024 & 2032
- Figure 66: Japan APAC Essential Oil Industry Volume Share (%), by Application 2024 & 2032
- Figure 67: Japan APAC Essential Oil Industry Revenue (Million), by Geography 2024 & 2032
- Figure 68: Japan APAC Essential Oil Industry Volume (K Tons), by Geography 2024 & 2032
- Figure 69: Japan APAC Essential Oil Industry Revenue Share (%), by Geography 2024 & 2032
- Figure 70: Japan APAC Essential Oil Industry Volume Share (%), by Geography 2024 & 2032
- Figure 71: Japan APAC Essential Oil Industry Revenue (Million), by Country 2024 & 2032
- Figure 72: Japan APAC Essential Oil Industry Volume (K Tons), by Country 2024 & 2032
- Figure 73: Japan APAC Essential Oil Industry Revenue Share (%), by Country 2024 & 2032
- Figure 74: Japan APAC Essential Oil Industry Volume Share (%), by Country 2024 & 2032
- Figure 75: Australia APAC Essential Oil Industry Revenue (Million), by Product Type 2024 & 2032
- Figure 76: Australia APAC Essential Oil Industry Volume (K Tons), by Product Type 2024 & 2032
- Figure 77: Australia APAC Essential Oil Industry Revenue Share (%), by Product Type 2024 & 2032
- Figure 78: Australia APAC Essential Oil Industry Volume Share (%), by Product Type 2024 & 2032
- Figure 79: Australia APAC Essential Oil Industry Revenue (Million), by Application 2024 & 2032
- Figure 80: Australia APAC Essential Oil Industry Volume (K Tons), by Application 2024 & 2032
- Figure 81: Australia APAC Essential Oil Industry Revenue Share (%), by Application 2024 & 2032
- Figure 82: Australia APAC Essential Oil Industry Volume Share (%), by Application 2024 & 2032
- Figure 83: Australia APAC Essential Oil Industry Revenue (Million), by Geography 2024 & 2032
- Figure 84: Australia APAC Essential Oil Industry Volume (K Tons), by Geography 2024 & 2032
- Figure 85: Australia APAC Essential Oil Industry Revenue Share (%), by Geography 2024 & 2032
- Figure 86: Australia APAC Essential Oil Industry Volume Share (%), by Geography 2024 & 2032
- Figure 87: Australia APAC Essential Oil Industry Revenue (Million), by Country 2024 & 2032
- Figure 88: Australia APAC Essential Oil Industry Volume (K Tons), by Country 2024 & 2032
- Figure 89: Australia APAC Essential Oil Industry Revenue Share (%), by Country 2024 & 2032
- Figure 90: Australia APAC Essential Oil Industry Volume Share (%), by Country 2024 & 2032
- Figure 91: Rest of Asia Pacific APAC Essential Oil Industry Revenue (Million), by Product Type 2024 & 2032
- Figure 92: Rest of Asia Pacific APAC Essential Oil Industry Volume (K Tons), by Product Type 2024 & 2032
- Figure 93: Rest of Asia Pacific APAC Essential Oil Industry Revenue Share (%), by Product Type 2024 & 2032
- Figure 94: Rest of Asia Pacific APAC Essential Oil Industry Volume Share (%), by Product Type 2024 & 2032
- Figure 95: Rest of Asia Pacific APAC Essential Oil Industry Revenue (Million), by Application 2024 & 2032
- Figure 96: Rest of Asia Pacific APAC Essential Oil Industry Volume (K Tons), by Application 2024 & 2032
- Figure 97: Rest of Asia Pacific APAC Essential Oil Industry Revenue Share (%), by Application 2024 & 2032
- Figure 98: Rest of Asia Pacific APAC Essential Oil Industry Volume Share (%), by Application 2024 & 2032
- Figure 99: Rest of Asia Pacific APAC Essential Oil Industry Revenue (Million), by Geography 2024 & 2032
- Figure 100: Rest of Asia Pacific APAC Essential Oil Industry Volume (K Tons), by Geography 2024 & 2032
- Figure 101: Rest of Asia Pacific APAC Essential Oil Industry Revenue Share (%), by Geography 2024 & 2032
- Figure 102: Rest of Asia Pacific APAC Essential Oil Industry Volume Share (%), by Geography 2024 & 2032
- Figure 103: Rest of Asia Pacific APAC Essential Oil Industry Revenue (Million), by Country 2024 & 2032
- Figure 104: Rest of Asia Pacific APAC Essential Oil Industry Volume (K Tons), by Country 2024 & 2032
- Figure 105: Rest of Asia Pacific APAC Essential Oil Industry Revenue Share (%), by Country 2024 & 2032
- Figure 106: Rest of Asia Pacific APAC Essential Oil Industry Volume Share (%), by Country 2024 & 2032
List of Tables
- Table 1: Global APAC Essential Oil Industry Revenue Million Forecast, by Region 2019 & 2032
- Table 2: Global APAC Essential Oil Industry Volume K Tons Forecast, by Region 2019 & 2032
- Table 3: Global APAC Essential Oil Industry Revenue Million Forecast, by Product Type 2019 & 2032
- Table 4: Global APAC Essential Oil Industry Volume K Tons Forecast, by Product Type 2019 & 2032
- Table 5: Global APAC Essential Oil Industry Revenue Million Forecast, by Application 2019 & 2032
- Table 6: Global APAC Essential Oil Industry Volume K Tons Forecast, by Application 2019 & 2032
- Table 7: Global APAC Essential Oil Industry Revenue Million Forecast, by Geography 2019 & 2032
- Table 8: Global APAC Essential Oil Industry Volume K Tons Forecast, by Geography 2019 & 2032
- Table 9: Global APAC Essential Oil Industry Revenue Million Forecast, by Region 2019 & 2032
- Table 10: Global APAC Essential Oil Industry Volume K Tons Forecast, by Region 2019 & 2032
- Table 11: Global APAC Essential Oil Industry Revenue Million Forecast, by Country 2019 & 2032
- Table 12: Global APAC Essential Oil Industry Volume K Tons Forecast, by Country 2019 & 2032
- Table 13: United States APAC Essential Oil Industry Revenue (Million) Forecast, by Application 2019 & 2032
- Table 14: United States APAC Essential Oil Industry Volume (K Tons) Forecast, by Application 2019 & 2032
- Table 15: Canada APAC Essential Oil Industry Revenue (Million) Forecast, by Application 2019 & 2032
- Table 16: Canada APAC Essential Oil Industry Volume (K Tons) Forecast, by Application 2019 & 2032
- Table 17: Mexico APAC Essential Oil Industry Revenue (Million) Forecast, by Application 2019 & 2032
- Table 18: Mexico APAC Essential Oil Industry Volume (K Tons) Forecast, by Application 2019 & 2032
- Table 19: Global APAC Essential Oil Industry Revenue Million Forecast, by Country 2019 & 2032
- Table 20: Global APAC Essential Oil Industry Volume K Tons Forecast, by Country 2019 & 2032
- Table 21: Germany APAC Essential Oil Industry Revenue (Million) Forecast, by Application 2019 & 2032
- Table 22: Germany APAC Essential Oil Industry Volume (K Tons) Forecast, by Application 2019 & 2032
- Table 23: United Kingdom APAC Essential Oil Industry Revenue (Million) Forecast, by Application 2019 & 2032
- Table 24: United Kingdom APAC Essential Oil Industry Volume (K Tons) Forecast, by Application 2019 & 2032
- Table 25: France APAC Essential Oil Industry Revenue (Million) Forecast, by Application 2019 & 2032
- Table 26: France APAC Essential Oil Industry Volume (K Tons) Forecast, by Application 2019 & 2032
- Table 27: Spain APAC Essential Oil Industry Revenue (Million) Forecast, by Application 2019 & 2032
- Table 28: Spain APAC Essential Oil Industry Volume (K Tons) Forecast, by Application 2019 & 2032
- Table 29: Italy APAC Essential Oil Industry Revenue (Million) Forecast, by Application 2019 & 2032
- Table 30: Italy APAC Essential Oil Industry Volume (K Tons) Forecast, by Application 2019 & 2032
- Table 31: Spain APAC Essential Oil Industry Revenue (Million) Forecast, by Application 2019 & 2032
- Table 32: Spain APAC Essential Oil Industry Volume (K Tons) Forecast, by Application 2019 & 2032
- Table 33: Belgium APAC Essential Oil Industry Revenue (Million) Forecast, by Application 2019 & 2032
- Table 34: Belgium APAC Essential Oil Industry Volume (K Tons) Forecast, by Application 2019 & 2032
- Table 35: Netherland APAC Essential Oil Industry Revenue (Million) Forecast, by Application 2019 & 2032
- Table 36: Netherland APAC Essential Oil Industry Volume (K Tons) Forecast, by Application 2019 & 2032
- Table 37: Nordics APAC Essential Oil Industry Revenue (Million) Forecast, by Application 2019 & 2032
- Table 38: Nordics APAC Essential Oil Industry Volume (K Tons) Forecast, by Application 2019 & 2032
- Table 39: Rest of Europe APAC Essential Oil Industry Revenue (Million) Forecast, by Application 2019 & 2032
- Table 40: Rest of Europe APAC Essential Oil Industry Volume (K Tons) Forecast, by Application 2019 & 2032
- Table 41: Global APAC Essential Oil Industry Revenue Million Forecast, by Country 2019 & 2032
- Table 42: Global APAC Essential Oil Industry Volume K Tons Forecast, by Country 2019 & 2032
- Table 43: China APAC Essential Oil Industry Revenue (Million) Forecast, by Application 2019 & 2032
- Table 44: China APAC Essential Oil Industry Volume (K Tons) Forecast, by Application 2019 & 2032
- Table 45: Japan APAC Essential Oil Industry Revenue (Million) Forecast, by Application 2019 & 2032
- Table 46: Japan APAC Essential Oil Industry Volume (K Tons) Forecast, by Application 2019 & 2032
- Table 47: India APAC Essential Oil Industry Revenue (Million) Forecast, by Application 2019 & 2032
- Table 48: India APAC Essential Oil Industry Volume (K Tons) Forecast, by Application 2019 & 2032
- Table 49: South Korea APAC Essential Oil Industry Revenue (Million) Forecast, by Application 2019 & 2032
- Table 50: South Korea APAC Essential Oil Industry Volume (K Tons) Forecast, by Application 2019 & 2032
- Table 51: Southeast Asia APAC Essential Oil Industry Revenue (Million) Forecast, by Application 2019 & 2032
- Table 52: Southeast Asia APAC Essential Oil Industry Volume (K Tons) Forecast, by Application 2019 & 2032
- Table 53: Australia APAC Essential Oil Industry Revenue (Million) Forecast, by Application 2019 & 2032
- Table 54: Australia APAC Essential Oil Industry Volume (K Tons) Forecast, by Application 2019 & 2032
- Table 55: Indonesia APAC Essential Oil Industry Revenue (Million) Forecast, by Application 2019 & 2032
- Table 56: Indonesia APAC Essential Oil Industry Volume (K Tons) Forecast, by Application 2019 & 2032
- Table 57: Phillipes APAC Essential Oil Industry Revenue (Million) Forecast, by Application 2019 & 2032
- Table 58: Phillipes APAC Essential Oil Industry Volume (K Tons) Forecast, by Application 2019 & 2032
- Table 59: Singapore APAC Essential Oil Industry Revenue (Million) Forecast, by Application 2019 & 2032
- Table 60: Singapore APAC Essential Oil Industry Volume (K Tons) Forecast, by Application 2019 & 2032
- Table 61: Thailandc APAC Essential Oil Industry Revenue (Million) Forecast, by Application 2019 & 2032
- Table 62: Thailandc APAC Essential Oil Industry Volume (K Tons) Forecast, by Application 2019 & 2032
- Table 63: Rest of Asia Pacific APAC Essential Oil Industry Revenue (Million) Forecast, by Application 2019 & 2032
- Table 64: Rest of Asia Pacific APAC Essential Oil Industry Volume (K Tons) Forecast, by Application 2019 & 2032
- Table 65: Global APAC Essential Oil Industry Revenue Million Forecast, by Country 2019 & 2032
- Table 66: Global APAC Essential Oil Industry Volume K Tons Forecast, by Country 2019 & 2032
- Table 67: Brazil APAC Essential Oil Industry Revenue (Million) Forecast, by Application 2019 & 2032
- Table 68: Brazil APAC Essential Oil Industry Volume (K Tons) Forecast, by Application 2019 & 2032
- Table 69: Argentina APAC Essential Oil Industry Revenue (Million) Forecast, by Application 2019 & 2032
- Table 70: Argentina APAC Essential Oil Industry Volume (K Tons) Forecast, by Application 2019 & 2032
- Table 71: Peru APAC Essential Oil Industry Revenue (Million) Forecast, by Application 2019 & 2032
- Table 72: Peru APAC Essential Oil Industry Volume (K Tons) Forecast, by Application 2019 & 2032
- Table 73: Chile APAC Essential Oil Industry Revenue (Million) Forecast, by Application 2019 & 2032
- Table 74: Chile APAC Essential Oil Industry Volume (K Tons) Forecast, by Application 2019 & 2032
- Table 75: Colombia APAC Essential Oil Industry Revenue (Million) Forecast, by Application 2019 & 2032
- Table 76: Colombia APAC Essential Oil Industry Volume (K Tons) Forecast, by Application 2019 & 2032
- Table 77: Ecuador APAC Essential Oil Industry Revenue (Million) Forecast, by Application 2019 & 2032
- Table 78: Ecuador APAC Essential Oil Industry Volume (K Tons) Forecast, by Application 2019 & 2032
- Table 79: Venezuela APAC Essential Oil Industry Revenue (Million) Forecast, by Application 2019 & 2032
- Table 80: Venezuela APAC Essential Oil Industry Volume (K Tons) Forecast, by Application 2019 & 2032
- Table 81: Rest of South America APAC Essential Oil Industry Revenue (Million) Forecast, by Application 2019 & 2032
- Table 82: Rest of South America APAC Essential Oil Industry Volume (K Tons) Forecast, by Application 2019 & 2032
- Table 83: Global APAC Essential Oil Industry Revenue Million Forecast, by Country 2019 & 2032
- Table 84: Global APAC Essential Oil Industry Volume K Tons Forecast, by Country 2019 & 2032
- Table 85: United States APAC Essential Oil Industry Revenue (Million) Forecast, by Application 2019 & 2032
- Table 86: United States APAC Essential Oil Industry Volume (K Tons) Forecast, by Application 2019 & 2032
- Table 87: Canada APAC Essential Oil Industry Revenue (Million) Forecast, by Application 2019 & 2032
- Table 88: Canada APAC Essential Oil Industry Volume (K Tons) Forecast, by Application 2019 & 2032
- Table 89: Mexico APAC Essential Oil Industry Revenue (Million) Forecast, by Application 2019 & 2032
- Table 90: Mexico APAC Essential Oil Industry Volume (K Tons) Forecast, by Application 2019 & 2032
- Table 91: Global APAC Essential Oil Industry Revenue Million Forecast, by Country 2019 & 2032
- Table 92: Global APAC Essential Oil Industry Volume K Tons Forecast, by Country 2019 & 2032
- Table 93: United Arab Emirates APAC Essential Oil Industry Revenue (Million) Forecast, by Application 2019 & 2032
- Table 94: United Arab Emirates APAC Essential Oil Industry Volume (K Tons) Forecast, by Application 2019 & 2032
- Table 95: Saudi Arabia APAC Essential Oil Industry Revenue (Million) Forecast, by Application 2019 & 2032
- Table 96: Saudi Arabia APAC Essential Oil Industry Volume (K Tons) Forecast, by Application 2019 & 2032
- Table 97: South Africa APAC Essential Oil Industry Revenue (Million) Forecast, by Application 2019 & 2032
- Table 98: South Africa APAC Essential Oil Industry Volume (K Tons) Forecast, by Application 2019 & 2032
- Table 99: Rest of Middle East and Africa APAC Essential Oil Industry Revenue (Million) Forecast, by Application 2019 & 2032
- Table 100: Rest of Middle East and Africa APAC Essential Oil Industry Volume (K Tons) Forecast, by Application 2019 & 2032
- Table 101: Global APAC Essential Oil Industry Revenue Million Forecast, by Product Type 2019 & 2032
- Table 102: Global APAC Essential Oil Industry Volume K Tons Forecast, by Product Type 2019 & 2032
- Table 103: Global APAC Essential Oil Industry Revenue Million Forecast, by Application 2019 & 2032
- Table 104: Global APAC Essential Oil Industry Volume K Tons Forecast, by Application 2019 & 2032
- Table 105: Global APAC Essential Oil Industry Revenue Million Forecast, by Geography 2019 & 2032
- Table 106: Global APAC Essential Oil Industry Volume K Tons Forecast, by Geography 2019 & 2032
- Table 107: Global APAC Essential Oil Industry Revenue Million Forecast, by Country 2019 & 2032
- Table 108: Global APAC Essential Oil Industry Volume K Tons Forecast, by Country 2019 & 2032
- Table 109: Global APAC Essential Oil Industry Revenue Million Forecast, by Product Type 2019 & 2032
- Table 110: Global APAC Essential Oil Industry Volume K Tons Forecast, by Product Type 2019 & 2032
- Table 111: Global APAC Essential Oil Industry Revenue Million Forecast, by Application 2019 & 2032
- Table 112: Global APAC Essential Oil Industry Volume K Tons Forecast, by Application 2019 & 2032
- Table 113: Global APAC Essential Oil Industry Revenue Million Forecast, by Geography 2019 & 2032
- Table 114: Global APAC Essential Oil Industry Volume K Tons Forecast, by Geography 2019 & 2032
- Table 115: Global APAC Essential Oil Industry Revenue Million Forecast, by Country 2019 & 2032
- Table 116: Global APAC Essential Oil Industry Volume K Tons Forecast, by Country 2019 & 2032
- Table 117: Global APAC Essential Oil Industry Revenue Million Forecast, by Product Type 2019 & 2032
- Table 118: Global APAC Essential Oil Industry Volume K Tons Forecast, by Product Type 2019 & 2032
- Table 119: Global APAC Essential Oil Industry Revenue Million Forecast, by Application 2019 & 2032
- Table 120: Global APAC Essential Oil Industry Volume K Tons Forecast, by Application 2019 & 2032
- Table 121: Global APAC Essential Oil Industry Revenue Million Forecast, by Geography 2019 & 2032
- Table 122: Global APAC Essential Oil Industry Volume K Tons Forecast, by Geography 2019 & 2032
- Table 123: Global APAC Essential Oil Industry Revenue Million Forecast, by Country 2019 & 2032
- Table 124: Global APAC Essential Oil Industry Volume K Tons Forecast, by Country 2019 & 2032
- Table 125: Global APAC Essential Oil Industry Revenue Million Forecast, by Product Type 2019 & 2032
- Table 126: Global APAC Essential Oil Industry Volume K Tons Forecast, by Product Type 2019 & 2032
- Table 127: Global APAC Essential Oil Industry Revenue Million Forecast, by Application 2019 & 2032
- Table 128: Global APAC Essential Oil Industry Volume K Tons Forecast, by Application 2019 & 2032
- Table 129: Global APAC Essential Oil Industry Revenue Million Forecast, by Geography 2019 & 2032
- Table 130: Global APAC Essential Oil Industry Volume K Tons Forecast, by Geography 2019 & 2032
- Table 131: Global APAC Essential Oil Industry Revenue Million Forecast, by Country 2019 & 2032
- Table 132: Global APAC Essential Oil Industry Volume K Tons Forecast, by Country 2019 & 2032
- Table 133: Global APAC Essential Oil Industry Revenue Million Forecast, by Product Type 2019 & 2032
- Table 134: Global APAC Essential Oil Industry Volume K Tons Forecast, by Product Type 2019 & 2032
- Table 135: Global APAC Essential Oil Industry Revenue Million Forecast, by Application 2019 & 2032
- Table 136: Global APAC Essential Oil Industry Volume K Tons Forecast, by Application 2019 & 2032
- Table 137: Global APAC Essential Oil Industry Revenue Million Forecast, by Geography 2019 & 2032
- Table 138: Global APAC Essential Oil Industry Volume K Tons Forecast, by Geography 2019 & 2032
- Table 139: Global APAC Essential Oil Industry Revenue Million Forecast, by Country 2019 & 2032
- Table 140: Global APAC Essential Oil Industry Volume K Tons Forecast, by Country 2019 & 2032
Frequently Asked Questions
1. What is the projected Compound Annual Growth Rate (CAGR) of the APAC Essential Oil Industry?
The projected CAGR is approximately 8.21%.
2. Which companies are prominent players in the APAC Essential Oil Industry?
Key companies in the market include Do Terra, Organic Harvest, Springfields Australia, Tilley Aroma Natural, Bella Vita*List Not Exhaustive, In Essence, Young Living Essentials, Auroma, AT-Aroma Co Ltd, Ultra International BV, Aroma Treasures.
3. What are the main segments of the APAC Essential Oil Industry?
The market segments include Product Type, Application, Geography.
4. Can you provide details about the market size?
The market size is estimated to be USD 2.26 Million as of 2022.
5. What are some drivers contributing to market growth?
Increasing awareness towards fitness among consumers; Demand for convenient fortified foods.
6. What are the notable trends driving market growth?
Increasing Awareness Toward the Health Benefits of Essential Oil.
7. Are there any restraints impacting market growth?
Increasing vegan culture in the market.
8. Can you provide examples of recent developments in the market?
October 2022: doTERRA introduced a new wellness product that combines pure essential oils, sustainable sourcing, and evidence-based research. Helichrysum touch, LaLuz Diffuser, Roam Diffuser, Dawn Aroma Humidifier, Balance Bath Bar, On Guard Toothpaste, and On Guard Hand Wipes are among the new products.
9. What pricing options are available for accessing the report?
Pricing options include single-user, multi-user, and enterprise licenses priced at USD 4750, USD 5250, and USD 8750 respectively.
10. Is the market size provided in terms of value or volume?
The market size is provided in terms of value, measured in Million and volume, measured in K Tons.
11. Are there any specific market keywords associated with the report?
Yes, the market keyword associated with the report is "APAC Essential Oil Industry," which aids in identifying and referencing the specific market segment covered.
12. How do I determine which pricing option suits my needs best?
The pricing options vary based on user requirements and access needs. Individual users may opt for single-user licenses, while businesses requiring broader access may choose multi-user or enterprise licenses for cost-effective access to the report.
13. Are there any additional resources or data provided in the APAC Essential Oil Industry report?
While the report offers comprehensive insights, it's advisable to review the specific contents or supplementary materials provided to ascertain if additional resources or data are available.
14. How can I stay updated on further developments or reports in the APAC Essential Oil Industry?
To stay informed about further developments, trends, and reports in the APAC Essential Oil Industry, consider subscribing to industry newsletters, following relevant companies and organizations, or regularly checking reputable industry news sources and publications.
Methodology
Step 1 - Identification of Relevant Samples Size from Population Database


Step 2 - Approaches for Defining Global Market Size (Value, Volume* & Price*)

Note*: In applicable scenarios
Step 3 - Data Sources
Primary Research
- Web Analytics
- Survey Reports
- Research Institute
- Latest Research Reports
- Opinion Leaders
Secondary Research
- Annual Reports
- White Paper
- Latest Press Release
- Industry Association
- Paid Database
- Investor Presentations

Step 4 - Data Triangulation
Involves using different sources of information in order to increase the validity of a study
These sources are likely to be stakeholders in a program - participants, other researchers, program staff, other community members, and so on.
Then we put all data in single framework & apply various statistical tools to find out the dynamic on the market.
During the analysis stage, feedback from the stakeholder groups would be compared to determine areas of agreement as well as areas of divergence
