

Key Insights
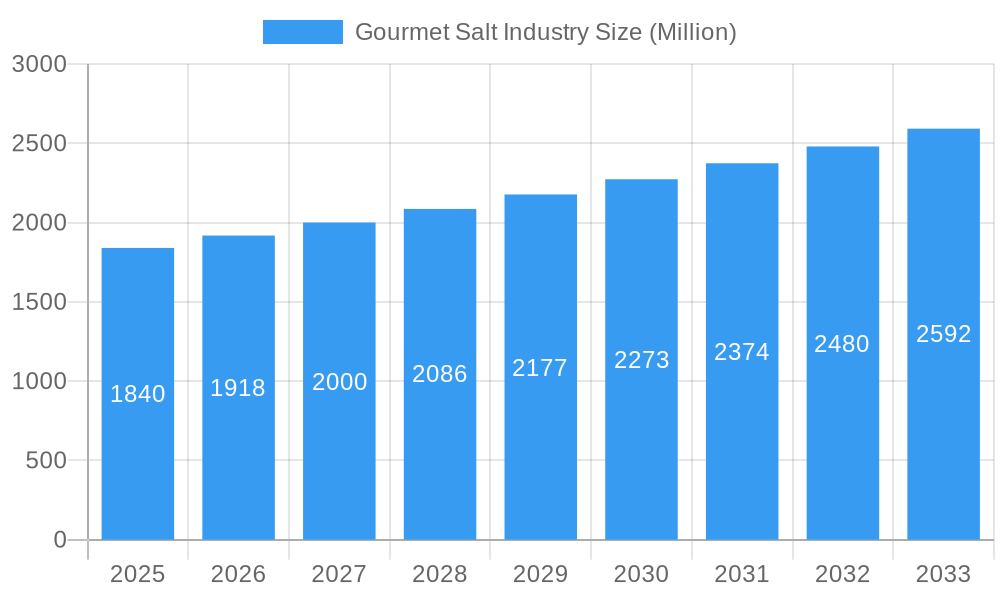
The gourmet salt market, valued at $1.84 billion in 2025, is projected to experience steady growth, driven by rising consumer demand for premium culinary experiences and health-conscious choices. A Compound Annual Growth Rate (CAGR) of 4.20% from 2025 to 2033 indicates a significant expansion, reaching an estimated market size of approximately $2.7 billion by 2033. This growth is fueled by several key factors. The increasing popularity of gourmet cooking, both at home and in restaurants, is a significant driver, with consumers seeking out unique flavors and textures provided by specialty salts like Himalayan pink salt, fleur de sel, and Sel Gris. Furthermore, the health and wellness trend contributes to the market's expansion, as consumers associate certain gourmet salts with potential health benefits like improved mineral intake. The market segmentation reveals a strong preference for specific types, with Himalayan salt, fleur de sel, and Sel Gris likely leading the market share due to their unique properties and perceived value. Application-wise, confectionery, bakery, and meat and poultry industries are likely major consumers, reflecting gourmet salt's ability to enhance both flavor and visual appeal in diverse culinary applications.
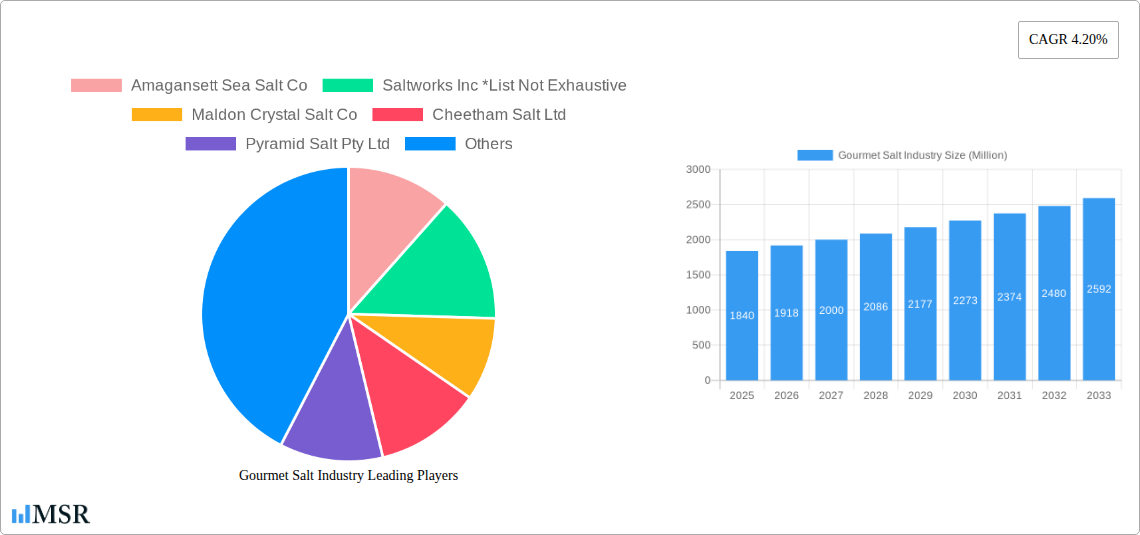
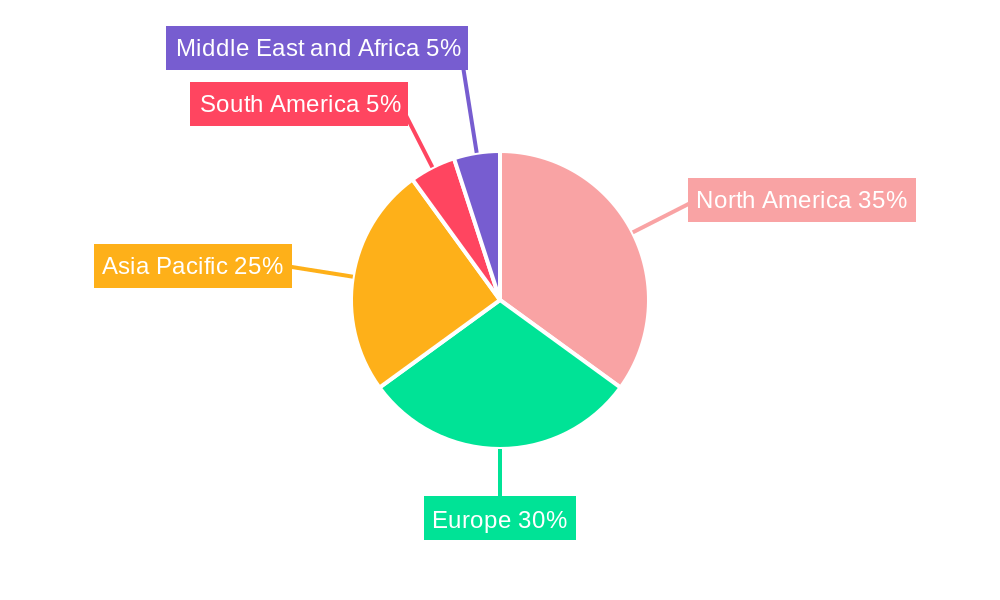
Gourmet Salt Industry Market Size (In Billion)
However, the market also faces certain restraints. Fluctuations in raw material prices and supply chain disruptions could impact profitability. Competition from established players like Cargill and Morton Salt, alongside smaller, artisanal producers, creates a dynamic market environment that requires strategic pricing and product differentiation. The increasing consumer interest in sustainable and ethically sourced products represents both a challenge and an opportunity for market participants. Companies will need to adopt sustainable harvesting and packaging practices to meet growing consumer demands for environmentally friendly options and transparency in their supply chains. Regional variations in consumer preferences and purchasing power will also play a crucial role in determining market penetration and profitability. North America and Europe are expected to maintain significant market shares due to higher per capita consumption and strong demand for premium food products. However, emerging economies in Asia Pacific are anticipated to show considerable growth potential, driven by rising disposable incomes and evolving culinary trends.
Gourmet Salt Industry Company Market Share
Gourmet Salt Industry: A Comprehensive Market Report (2019-2033)
This comprehensive report provides an in-depth analysis of the global Gourmet Salt industry, projecting a market size of $XX Million by 2033. The study period covers 2019-2033, with 2025 as the base and estimated year. It offers actionable insights for industry stakeholders, including manufacturers, distributors, and investors. Key players analyzed include Amagansett Sea Salt Co, Saltworks Inc, Maldon Crystal Salt Co, Cheetham Salt Ltd, Pyramid Salt Pty Ltd, Alaska Pure Sea Salt Co, Murray River Salt, Cargill Inc, Morton Salt Inc, and Kalahari Pristine Salt Worx, though the list is not exhaustive. The report segments the market by type (Sel Gris, Flakey Salt, Himalayan Salt, Fleur de sel, Specialty Salt, Other Types) and application (Confectionary, Bakery, Meat and Poultry, Seafood, Sauces and Savories, Other Applications).
Gourmet Salt Industry Market Concentration & Dynamics
The gourmet salt market exhibits moderate concentration, with several major players holding significant market share, but also allowing for smaller, specialized producers to thrive. The market is dynamic, influenced by factors including:
- Market Share: Cargill and Morton Salt likely hold the largest market shares globally, followed by regional players such as Maldon Crystal Salt and Saltworks. Exact figures require proprietary data analysis but are estimated at xx%.
- Innovation Ecosystem: Continuous innovation in product types (e.g., flavored salts, infused salts) and packaging drives market growth.
- Regulatory Frameworks: Food safety regulations and labeling requirements impact market operations. Variations across regions present both challenges and opportunities.
- Substitute Products: Regular table salt remains a primary substitute, though the premium nature and perceived health benefits of gourmet salts create strong differentiation.
- End-User Trends: Growing health consciousness and the increasing popularity of gourmet cooking fuel demand for premium salts.
- M&A Activities: The number of M&A deals in this sector has remained relatively low, however xx major transactions are predicted by 2033, mainly driven by larger companies seeking to expand their product portfolios and geographic reach.
Gourmet Salt Industry Insights & Trends
The gourmet salt market is experiencing robust growth, driven by several key factors. The global market size was valued at $XX Million in 2024 and is projected to reach $XX Million by 2033, exhibiting a CAGR of xx%. Key drivers include:
- Rising Disposable Incomes: Increased purchasing power in developing economies is boosting demand for premium food products, including gourmet salts.
- Health and Wellness Trends: Consumer interest in natural and minimally processed foods is driving the popularity of gourmet salts, which are often perceived as healthier alternatives to refined table salt.
- Gourmet Food Culture: The expansion of the gourmet food industry and the growing popularity of culinary arts are significant drivers of demand.
- Technological Advancements: Innovations in salt harvesting, processing, and packaging techniques contribute to improved product quality and efficiency.
- Evolving Consumer Behavior: Consumers are increasingly seeking unique and high-quality ingredients to enhance their culinary experiences.
Key Markets & Segments Leading Gourmet Salt Industry
The gourmet salt market shows strong regional variations. While precise market share data needs deeper analysis, North America and Europe are expected to remain dominant regions throughout the forecast period due to higher consumer spending and established gourmet food markets. Within these segments:
- Dominant Regions: North America and Europe are expected to be dominant, with xx% market share in 2033. Asia-Pacific is also projected for significant growth.
- Dominant Types: Himalayan pink salt and Fleur de sel have experienced high growth, driven by their unique characteristics and perceived health benefits.
- Dominant Applications: The culinary sector (Confectionary, Bakery, Meat and Poultry, Seafood, Sauces and Savories) is the main driver, followed by other applications as demand for niche specialties increase.
Drivers for Key Regions and Segments:
- Economic Growth: High GDP growth in key regions directly correlates to increased gourmet food consumption.
- Infrastructure Development: Improved infrastructure facilitates the efficient distribution of gourmet salts.
- Culinary Trends: Growing popularity of specific cuisines influences demand for certain salt types.
Gourmet Salt Industry Product Developments
Recent years have witnessed significant product innovations, including the launch of purified sea salt flour by Cargill (2021) targeting specific applications requiring fine-sized salt. Saltworks' (2020) investment in B2B e-commerce also represents a noteworthy development, enhancing market reach and customer experience. Morton Salt's (2019) introduction of All-Natural Himalayan Pink Salt expanded its product line and tapped into the growing health-conscious consumer base. These developments highlight the industry's focus on meeting diverse consumer demands with innovative products and improved market access.
Challenges in the Gourmet Salt Industry Market
The gourmet salt industry faces several challenges:
- Regulatory Hurdles: Compliance with food safety regulations across different regions imposes operational complexities and costs.
- Supply Chain Issues: Variability in salt sourcing and fluctuating commodity prices pose risks to profitability.
- Competitive Pressures: The presence of established players and the emergence of new entrants create intense competition. The impact of this is estimated to affect profit margins by approximately xx% by 2033.
Forces Driving Gourmet Salt Industry Growth
Key growth drivers include technological advancements in processing and packaging leading to higher quality and reduced costs, rising disposable incomes in developing economies increasing consumer spending on premium products, and changing consumer preferences towards natural and healthier alternatives.
Long-Term Growth Catalysts in the Gourmet Salt Industry
Long-term growth will be driven by strategic partnerships and market expansion into emerging economies. The development of new product lines such as infused and flavored salts and investment in sustainable and ethical sourcing methods will also play a significant role.
Emerging Opportunities in Gourmet Salt Industry
Emerging opportunities include expansion into niche markets, like specialized culinary applications, and the development of functional gourmet salts with added health benefits. Exploring sustainable and ethically sourced salt options will also open new avenues for growth.
Leading Players in the Gourmet Salt Industry Sector
- Amagansett Sea Salt Co
- Saltworks Inc
- Maldon Crystal Salt Co
- Cheetham Salt Ltd
- Pyramid Salt Pty Ltd
- Alaska Pure Sea Salt Co
- Murray River Salt
- Cargill Inc
- Morton Salt Inc
- Kalahari Pristine Salt Worx
Key Milestones in Gourmet Salt Industry
- September 2019: Morton Salt launched All-Natural Himalayan Pink Salt, expanding its product line.
- April 2020: SaltWorks implemented new B2B eCommerce tools, enhancing customer experience and sales.
- January 2021: Cargill launched purified sea salt flour, targeting specific food applications.
Strategic Outlook for Gourmet Salt Industry Market
The gourmet salt market presents significant growth potential, particularly in emerging markets. Strategic opportunities exist in product diversification, sustainable sourcing, and innovative marketing strategies to capture growing consumer demand for premium and specialized salts. The market's future depends on addressing supply chain challenges and embracing innovation to meet the evolving needs of health-conscious consumers.
Gourmet Salt Industry Segmentation
-
1. Type
- 1.1. Sel Gris
- 1.2. Flakey Salt
- 1.3. Himalayan Salt
- 1.4. Fleur de sel
- 1.5. Specialty Salt
- 1.6. Other Types
-
2. Application
- 2.1. Confectionary
- 2.2. Bakery
- 2.3. Meat and Poultry
- 2.4. Sea Food
- 2.5. Sauces and Savories
- 2.6. Other Applications
Gourmet Salt Industry Segmentation By Geography
-
1. North America
- 1.1. United States
- 1.2. Canada
- 1.3. Mexico
- 1.4. Rest of North America
-
2. Europe
- 2.1. United Kingdom
- 2.2. Germany
- 2.3. France
- 2.4. Russia
- 2.5. Italy
- 2.6. Spain
- 2.7. Rest of Europe
-
3. Asia Pacific
- 3.1. India
- 3.2. China
- 3.3. Japan
- 3.4. Australia
- 3.5. Rest of Asia Pacific
-
4. South America
- 4.1. Brazil
- 4.2. Argentina
- 4.3. Rest of South America
-
5. Middle East and Africa
- 5.1. South Africa
- 5.2. United Arab Emirates
- 5.3. Rest of Middle East and Africa
Gourmet Salt Industry Regional Market Share
Geographic Coverage of Gourmet Salt Industry
Gourmet Salt Industry REPORT HIGHLIGHTS
| Aspects | Details |
|---|---|
| Study Period | 2020-2034 |
| Base Year | 2025 |
| Estimated Year | 2026 |
| Forecast Period | 2026-2034 |
| Historical Period | 2020-2025 |
| Growth Rate | CAGR of 4.20% from 2020-2034 |
| Segmentation |
|
Table of Contents
- 1. Introduction
- 1.1. Research Scope
- 1.2. Market Segmentation
- 1.3. Research Methodology
- 1.4. Definitions and Assumptions
- 2. Executive Summary
- 2.1. Introduction
- 3. Market Dynamics
- 3.1. Introduction
- 3.2. Market Drivers
- 3.2.1. Escalating Demand for Processed Poultry Products; Favorable Government Initiatives to Boost Production
- 3.3. Market Restrains
- 3.3.1. Rising Vegan Trend among Young Consumers; Deeper Penetration of Red Meat Across Saudi Arabia
- 3.4. Market Trends
- 3.4.1. Growing Demand from the Food Service Industry
- 4. Market Factor Analysis
- 4.1. Porters Five Forces
- 4.2. Supply/Value Chain
- 4.3. PESTEL analysis
- 4.4. Market Entropy
- 4.5. Patent/Trademark Analysis
- 5. Global Gourmet Salt Industry Analysis, Insights and Forecast, 2020-2032
- 5.1. Market Analysis, Insights and Forecast - by Type
- 5.1.1. Sel Gris
- 5.1.2. Flakey Salt
- 5.1.3. Himalayan Salt
- 5.1.4. Fleur de sel
- 5.1.5. Specialty Salt
- 5.1.6. Other Types
- 5.2. Market Analysis, Insights and Forecast - by Application
- 5.2.1. Confectionary
- 5.2.2. Bakery
- 5.2.3. Meat and Poultry
- 5.2.4. Sea Food
- 5.2.5. Sauces and Savories
- 5.2.6. Other Applications
- 5.3. Market Analysis, Insights and Forecast - by Region
- 5.3.1. North America
- 5.3.2. Europe
- 5.3.3. Asia Pacific
- 5.3.4. South America
- 5.3.5. Middle East and Africa
- 5.1. Market Analysis, Insights and Forecast - by Type
- 6. North America Gourmet Salt Industry Analysis, Insights and Forecast, 2020-2032
- 6.1. Market Analysis, Insights and Forecast - by Type
- 6.1.1. Sel Gris
- 6.1.2. Flakey Salt
- 6.1.3. Himalayan Salt
- 6.1.4. Fleur de sel
- 6.1.5. Specialty Salt
- 6.1.6. Other Types
- 6.2. Market Analysis, Insights and Forecast - by Application
- 6.2.1. Confectionary
- 6.2.2. Bakery
- 6.2.3. Meat and Poultry
- 6.2.4. Sea Food
- 6.2.5. Sauces and Savories
- 6.2.6. Other Applications
- 6.1. Market Analysis, Insights and Forecast - by Type
- 7. Europe Gourmet Salt Industry Analysis, Insights and Forecast, 2020-2032
- 7.1. Market Analysis, Insights and Forecast - by Type
- 7.1.1. Sel Gris
- 7.1.2. Flakey Salt
- 7.1.3. Himalayan Salt
- 7.1.4. Fleur de sel
- 7.1.5. Specialty Salt
- 7.1.6. Other Types
- 7.2. Market Analysis, Insights and Forecast - by Application
- 7.2.1. Confectionary
- 7.2.2. Bakery
- 7.2.3. Meat and Poultry
- 7.2.4. Sea Food
- 7.2.5. Sauces and Savories
- 7.2.6. Other Applications
- 7.1. Market Analysis, Insights and Forecast - by Type
- 8. Asia Pacific Gourmet Salt Industry Analysis, Insights and Forecast, 2020-2032
- 8.1. Market Analysis, Insights and Forecast - by Type
- 8.1.1. Sel Gris
- 8.1.2. Flakey Salt
- 8.1.3. Himalayan Salt
- 8.1.4. Fleur de sel
- 8.1.5. Specialty Salt
- 8.1.6. Other Types
- 8.2. Market Analysis, Insights and Forecast - by Application
- 8.2.1. Confectionary
- 8.2.2. Bakery
- 8.2.3. Meat and Poultry
- 8.2.4. Sea Food
- 8.2.5. Sauces and Savories
- 8.2.6. Other Applications
- 8.1. Market Analysis, Insights and Forecast - by Type
- 9. South America Gourmet Salt Industry Analysis, Insights and Forecast, 2020-2032
- 9.1. Market Analysis, Insights and Forecast - by Type
- 9.1.1. Sel Gris
- 9.1.2. Flakey Salt
- 9.1.3. Himalayan Salt
- 9.1.4. Fleur de sel
- 9.1.5. Specialty Salt
- 9.1.6. Other Types
- 9.2. Market Analysis, Insights and Forecast - by Application
- 9.2.1. Confectionary
- 9.2.2. Bakery
- 9.2.3. Meat and Poultry
- 9.2.4. Sea Food
- 9.2.5. Sauces and Savories
- 9.2.6. Other Applications
- 9.1. Market Analysis, Insights and Forecast - by Type
- 10. Middle East and Africa Gourmet Salt Industry Analysis, Insights and Forecast, 2020-2032
- 10.1. Market Analysis, Insights and Forecast - by Type
- 10.1.1. Sel Gris
- 10.1.2. Flakey Salt
- 10.1.3. Himalayan Salt
- 10.1.4. Fleur de sel
- 10.1.5. Specialty Salt
- 10.1.6. Other Types
- 10.2. Market Analysis, Insights and Forecast - by Application
- 10.2.1. Confectionary
- 10.2.2. Bakery
- 10.2.3. Meat and Poultry
- 10.2.4. Sea Food
- 10.2.5. Sauces and Savories
- 10.2.6. Other Applications
- 10.1. Market Analysis, Insights and Forecast - by Type
- 11. Competitive Analysis
- 11.1. Global Market Share Analysis 2025
- 11.2. Company Profiles
- 11.2.1 Amagansett Sea Salt Co
- 11.2.1.1. Overview
- 11.2.1.2. Products
- 11.2.1.3. SWOT Analysis
- 11.2.1.4. Recent Developments
- 11.2.1.5. Financials (Based on Availability)
- 11.2.2 Saltworks Inc *List Not Exhaustive
- 11.2.2.1. Overview
- 11.2.2.2. Products
- 11.2.2.3. SWOT Analysis
- 11.2.2.4. Recent Developments
- 11.2.2.5. Financials (Based on Availability)
- 11.2.3 Maldon Crystal Salt Co
- 11.2.3.1. Overview
- 11.2.3.2. Products
- 11.2.3.3. SWOT Analysis
- 11.2.3.4. Recent Developments
- 11.2.3.5. Financials (Based on Availability)
- 11.2.4 Cheetham Salt Ltd
- 11.2.4.1. Overview
- 11.2.4.2. Products
- 11.2.4.3. SWOT Analysis
- 11.2.4.4. Recent Developments
- 11.2.4.5. Financials (Based on Availability)
- 11.2.5 Pyramid Salt Pty Ltd
- 11.2.5.1. Overview
- 11.2.5.2. Products
- 11.2.5.3. SWOT Analysis
- 11.2.5.4. Recent Developments
- 11.2.5.5. Financials (Based on Availability)
- 11.2.6 Alaska Pure Sea Salt Co
- 11.2.6.1. Overview
- 11.2.6.2. Products
- 11.2.6.3. SWOT Analysis
- 11.2.6.4. Recent Developments
- 11.2.6.5. Financials (Based on Availability)
- 11.2.7 Murray River Salt
- 11.2.7.1. Overview
- 11.2.7.2. Products
- 11.2.7.3. SWOT Analysis
- 11.2.7.4. Recent Developments
- 11.2.7.5. Financials (Based on Availability)
- 11.2.8 Cargill Inc
- 11.2.8.1. Overview
- 11.2.8.2. Products
- 11.2.8.3. SWOT Analysis
- 11.2.8.4. Recent Developments
- 11.2.8.5. Financials (Based on Availability)
- 11.2.9 Morton Salt Inc
- 11.2.9.1. Overview
- 11.2.9.2. Products
- 11.2.9.3. SWOT Analysis
- 11.2.9.4. Recent Developments
- 11.2.9.5. Financials (Based on Availability)
- 11.2.10 Kalahari Pristine Salt Worx
- 11.2.10.1. Overview
- 11.2.10.2. Products
- 11.2.10.3. SWOT Analysis
- 11.2.10.4. Recent Developments
- 11.2.10.5. Financials (Based on Availability)
- 11.2.1 Amagansett Sea Salt Co
List of Figures
- Figure 1: Global Gourmet Salt Industry Revenue Breakdown (Million, %) by Region 2025 & 2033
- Figure 2: North America Gourmet Salt Industry Revenue (Million), by Type 2025 & 2033
- Figure 3: North America Gourmet Salt Industry Revenue Share (%), by Type 2025 & 2033
- Figure 4: North America Gourmet Salt Industry Revenue (Million), by Application 2025 & 2033
- Figure 5: North America Gourmet Salt Industry Revenue Share (%), by Application 2025 & 2033
- Figure 6: North America Gourmet Salt Industry Revenue (Million), by Country 2025 & 2033
- Figure 7: North America Gourmet Salt Industry Revenue Share (%), by Country 2025 & 2033
- Figure 8: Europe Gourmet Salt Industry Revenue (Million), by Type 2025 & 2033
- Figure 9: Europe Gourmet Salt Industry Revenue Share (%), by Type 2025 & 2033
- Figure 10: Europe Gourmet Salt Industry Revenue (Million), by Application 2025 & 2033
- Figure 11: Europe Gourmet Salt Industry Revenue Share (%), by Application 2025 & 2033
- Figure 12: Europe Gourmet Salt Industry Revenue (Million), by Country 2025 & 2033
- Figure 13: Europe Gourmet Salt Industry Revenue Share (%), by Country 2025 & 2033
- Figure 14: Asia Pacific Gourmet Salt Industry Revenue (Million), by Type 2025 & 2033
- Figure 15: Asia Pacific Gourmet Salt Industry Revenue Share (%), by Type 2025 & 2033
- Figure 16: Asia Pacific Gourmet Salt Industry Revenue (Million), by Application 2025 & 2033
- Figure 17: Asia Pacific Gourmet Salt Industry Revenue Share (%), by Application 2025 & 2033
- Figure 18: Asia Pacific Gourmet Salt Industry Revenue (Million), by Country 2025 & 2033
- Figure 19: Asia Pacific Gourmet Salt Industry Revenue Share (%), by Country 2025 & 2033
- Figure 20: South America Gourmet Salt Industry Revenue (Million), by Type 2025 & 2033
- Figure 21: South America Gourmet Salt Industry Revenue Share (%), by Type 2025 & 2033
- Figure 22: South America Gourmet Salt Industry Revenue (Million), by Application 2025 & 2033
- Figure 23: South America Gourmet Salt Industry Revenue Share (%), by Application 2025 & 2033
- Figure 24: South America Gourmet Salt Industry Revenue (Million), by Country 2025 & 2033
- Figure 25: South America Gourmet Salt Industry Revenue Share (%), by Country 2025 & 2033
- Figure 26: Middle East and Africa Gourmet Salt Industry Revenue (Million), by Type 2025 & 2033
- Figure 27: Middle East and Africa Gourmet Salt Industry Revenue Share (%), by Type 2025 & 2033
- Figure 28: Middle East and Africa Gourmet Salt Industry Revenue (Million), by Application 2025 & 2033
- Figure 29: Middle East and Africa Gourmet Salt Industry Revenue Share (%), by Application 2025 & 2033
- Figure 30: Middle East and Africa Gourmet Salt Industry Revenue (Million), by Country 2025 & 2033
- Figure 31: Middle East and Africa Gourmet Salt Industry Revenue Share (%), by Country 2025 & 2033
List of Tables
- Table 1: Global Gourmet Salt Industry Revenue Million Forecast, by Type 2020 & 2033
- Table 2: Global Gourmet Salt Industry Revenue Million Forecast, by Application 2020 & 2033
- Table 3: Global Gourmet Salt Industry Revenue Million Forecast, by Region 2020 & 2033
- Table 4: Global Gourmet Salt Industry Revenue Million Forecast, by Type 2020 & 2033
- Table 5: Global Gourmet Salt Industry Revenue Million Forecast, by Application 2020 & 2033
- Table 6: Global Gourmet Salt Industry Revenue Million Forecast, by Country 2020 & 2033
- Table 7: United States Gourmet Salt Industry Revenue (Million) Forecast, by Application 2020 & 2033
- Table 8: Canada Gourmet Salt Industry Revenue (Million) Forecast, by Application 2020 & 2033
- Table 9: Mexico Gourmet Salt Industry Revenue (Million) Forecast, by Application 2020 & 2033
- Table 10: Rest of North America Gourmet Salt Industry Revenue (Million) Forecast, by Application 2020 & 2033
- Table 11: Global Gourmet Salt Industry Revenue Million Forecast, by Type 2020 & 2033
- Table 12: Global Gourmet Salt Industry Revenue Million Forecast, by Application 2020 & 2033
- Table 13: Global Gourmet Salt Industry Revenue Million Forecast, by Country 2020 & 2033
- Table 14: United Kingdom Gourmet Salt Industry Revenue (Million) Forecast, by Application 2020 & 2033
- Table 15: Germany Gourmet Salt Industry Revenue (Million) Forecast, by Application 2020 & 2033
- Table 16: France Gourmet Salt Industry Revenue (Million) Forecast, by Application 2020 & 2033
- Table 17: Russia Gourmet Salt Industry Revenue (Million) Forecast, by Application 2020 & 2033
- Table 18: Italy Gourmet Salt Industry Revenue (Million) Forecast, by Application 2020 & 2033
- Table 19: Spain Gourmet Salt Industry Revenue (Million) Forecast, by Application 2020 & 2033
- Table 20: Rest of Europe Gourmet Salt Industry Revenue (Million) Forecast, by Application 2020 & 2033
- Table 21: Global Gourmet Salt Industry Revenue Million Forecast, by Type 2020 & 2033
- Table 22: Global Gourmet Salt Industry Revenue Million Forecast, by Application 2020 & 2033
- Table 23: Global Gourmet Salt Industry Revenue Million Forecast, by Country 2020 & 2033
- Table 24: India Gourmet Salt Industry Revenue (Million) Forecast, by Application 2020 & 2033
- Table 25: China Gourmet Salt Industry Revenue (Million) Forecast, by Application 2020 & 2033
- Table 26: Japan Gourmet Salt Industry Revenue (Million) Forecast, by Application 2020 & 2033
- Table 27: Australia Gourmet Salt Industry Revenue (Million) Forecast, by Application 2020 & 2033
- Table 28: Rest of Asia Pacific Gourmet Salt Industry Revenue (Million) Forecast, by Application 2020 & 2033
- Table 29: Global Gourmet Salt Industry Revenue Million Forecast, by Type 2020 & 2033
- Table 30: Global Gourmet Salt Industry Revenue Million Forecast, by Application 2020 & 2033
- Table 31: Global Gourmet Salt Industry Revenue Million Forecast, by Country 2020 & 2033
- Table 32: Brazil Gourmet Salt Industry Revenue (Million) Forecast, by Application 2020 & 2033
- Table 33: Argentina Gourmet Salt Industry Revenue (Million) Forecast, by Application 2020 & 2033
- Table 34: Rest of South America Gourmet Salt Industry Revenue (Million) Forecast, by Application 2020 & 2033
- Table 35: Global Gourmet Salt Industry Revenue Million Forecast, by Type 2020 & 2033
- Table 36: Global Gourmet Salt Industry Revenue Million Forecast, by Application 2020 & 2033
- Table 37: Global Gourmet Salt Industry Revenue Million Forecast, by Country 2020 & 2033
- Table 38: South Africa Gourmet Salt Industry Revenue (Million) Forecast, by Application 2020 & 2033
- Table 39: United Arab Emirates Gourmet Salt Industry Revenue (Million) Forecast, by Application 2020 & 2033
- Table 40: Rest of Middle East and Africa Gourmet Salt Industry Revenue (Million) Forecast, by Application 2020 & 2033
Frequently Asked Questions
1. What is the projected Compound Annual Growth Rate (CAGR) of the Gourmet Salt Industry?
The projected CAGR is approximately 4.20%.
2. Which companies are prominent players in the Gourmet Salt Industry?
Key companies in the market include Amagansett Sea Salt Co, Saltworks Inc *List Not Exhaustive, Maldon Crystal Salt Co, Cheetham Salt Ltd, Pyramid Salt Pty Ltd, Alaska Pure Sea Salt Co, Murray River Salt, Cargill Inc, Morton Salt Inc, Kalahari Pristine Salt Worx.
3. What are the main segments of the Gourmet Salt Industry?
The market segments include Type, Application.
4. Can you provide details about the market size?
The market size is estimated to be USD 1.84 Million as of 2022.
5. What are some drivers contributing to market growth?
Escalating Demand for Processed Poultry Products; Favorable Government Initiatives to Boost Production.
6. What are the notable trends driving market growth?
Growing Demand from the Food Service Industry.
7. Are there any restraints impacting market growth?
Rising Vegan Trend among Young Consumers; Deeper Penetration of Red Meat Across Saudi Arabia.
8. Can you provide examples of recent developments in the market?
In January 2021, Cargill Salt launched a new purified sea salt flour. The ingredient is a unique type of ultra-fine cut, powder-like sodium chloride. It is suitable for applications that require extremely fine sizing for blending, including dry soup, cereal, flour, and spice mixes, as well as for topping snack foods.
9. What pricing options are available for accessing the report?
Pricing options include single-user, multi-user, and enterprise licenses priced at USD 4750, USD 5250, and USD 8750 respectively.
10. Is the market size provided in terms of value or volume?
The market size is provided in terms of value, measured in Million.
11. Are there any specific market keywords associated with the report?
Yes, the market keyword associated with the report is "Gourmet Salt Industry," which aids in identifying and referencing the specific market segment covered.
12. How do I determine which pricing option suits my needs best?
The pricing options vary based on user requirements and access needs. Individual users may opt for single-user licenses, while businesses requiring broader access may choose multi-user or enterprise licenses for cost-effective access to the report.
13. Are there any additional resources or data provided in the Gourmet Salt Industry report?
While the report offers comprehensive insights, it's advisable to review the specific contents or supplementary materials provided to ascertain if additional resources or data are available.
14. How can I stay updated on further developments or reports in the Gourmet Salt Industry?
To stay informed about further developments, trends, and reports in the Gourmet Salt Industry, consider subscribing to industry newsletters, following relevant companies and organizations, or regularly checking reputable industry news sources and publications.
Methodology
Step 1 - Identification of Relevant Samples Size from Population Database


Step 2 - Approaches for Defining Global Market Size (Value, Volume* & Price*)

Note*: In applicable scenarios
Step 3 - Data Sources
Primary Research
- Web Analytics
- Survey Reports
- Research Institute
- Latest Research Reports
- Opinion Leaders
Secondary Research
- Annual Reports
- White Paper
- Latest Press Release
- Industry Association
- Paid Database
- Investor Presentations

Step 4 - Data Triangulation
Involves using different sources of information in order to increase the validity of a study
These sources are likely to be stakeholders in a program - participants, other researchers, program staff, other community members, and so on.
Then we put all data in single framework & apply various statistical tools to find out the dynamic on the market.
During the analysis stage, feedback from the stakeholder groups would be compared to determine areas of agreement as well as areas of divergence