

Key Insights
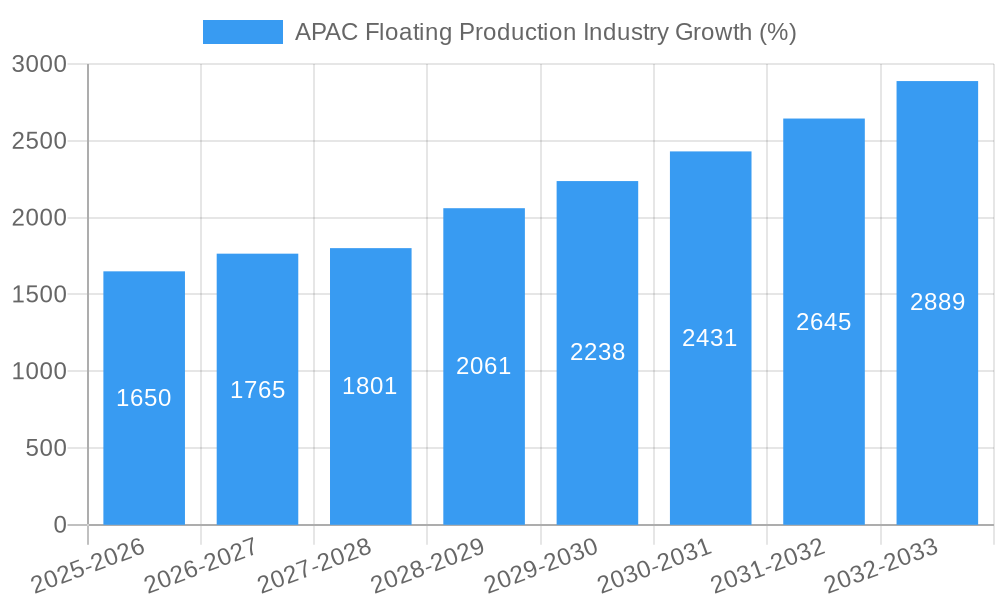
The Asia-Pacific (APAC) floating production industry is experiencing robust growth, driven by increasing offshore oil and gas exploration and production activities in deepwater regions. The region's substantial reserves, coupled with technological advancements in floating production systems (FPSOs, TLPs, SPARs, etc.), are major catalysts. Specifically, countries like China, India, and Australia are witnessing significant investments in offshore projects, fueling demand for various floating production solutions. The shallow water segments currently dominate the market, but deepwater and ultra-deepwater projects are rapidly gaining traction, leading to higher demand for advanced FPSOs capable of operating in challenging environments. This shift is reflected in the market's Compound Annual Growth Rate (CAGR) exceeding 10%, indicating a sustained period of expansion. While the high initial investment costs and regulatory complexities pose challenges, the strategic importance of securing energy resources is overriding these restraints. Moreover, the ongoing focus on environmentally friendly production methods and the development of more efficient floating platforms are further shaping the industry's trajectory.
The APAC market's segmentation reveals that FPSOs hold the largest share, owing to their versatility and adaptability to various water depths and reservoir characteristics. However, the demand for other platforms like TLPs and SPARs is expected to increase as exploration expands into deeper waters. Major players like MODEC, Keppel Offshore & Marine, and Samsung Heavy Industries are actively engaged in this market, securing significant contracts and driving technological innovation. Given the region's vast offshore potential and sustained government support for energy infrastructure development, the APAC floating production industry is projected to maintain its strong growth trajectory throughout the forecast period (2025-2033), potentially exceeding initial growth projections due to the rapid technological advancements and increasing energy demand. The increasing focus on sustainability will require innovative solutions, which will attract more technological advancements.
APAC Floating Production Industry: A Comprehensive Market Report (2019-2033)
This in-depth report provides a comprehensive analysis of the Asia-Pacific (APAC) floating production industry, offering crucial insights for stakeholders, investors, and industry professionals. Covering the period 2019-2033, with a base year of 2025, this report meticulously examines market dynamics, key players, technological advancements, and future growth prospects. The report leverages extensive data analysis to forecast market trends and identify lucrative opportunities within the APAC region. The total market size in 2025 is estimated at $XX Million, with a projected CAGR of XX% from 2025 to 2033.
APAC Floating Production Industry Market Concentration & Dynamics
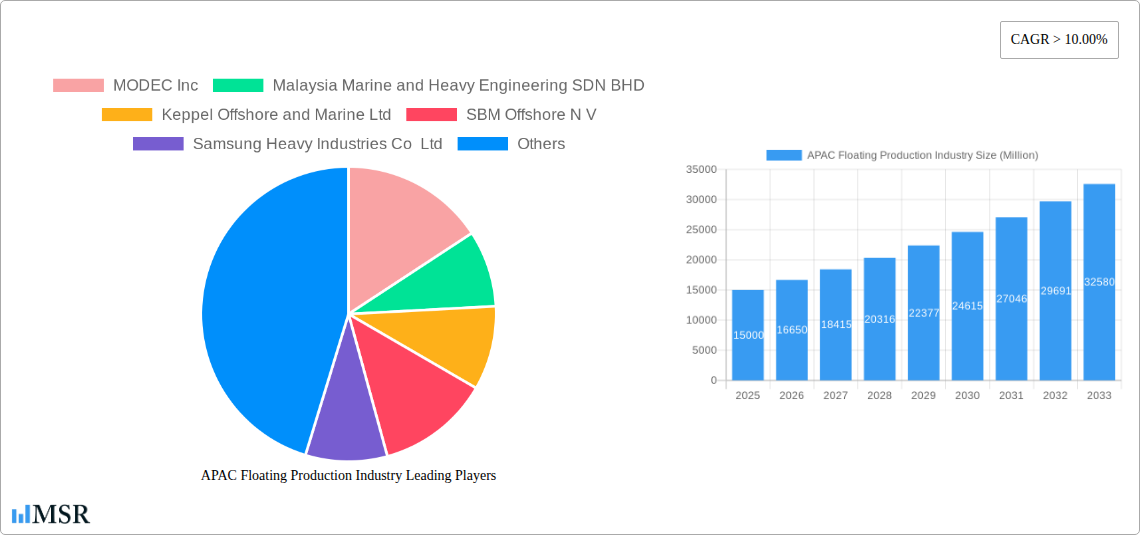
The APAC floating production industry exhibits a moderately concentrated market structure, with several major players holding significant market share. Key companies such as MODEC Inc, Malaysia Marine and Heavy Engineering SDN BHD, Keppel Offshore and Marine Ltd, SBM Offshore N V, Samsung Heavy Industries Co Ltd, Teekay Corporation, Hyundai Heavy Industries Co Ltd, TechnipFMC PLC, Bumi Armada Berhad, and Mitsubishi Heavy Industries Ltd dominate the landscape. Market share analysis reveals that MODEC Inc. and SBM Offshore N V collectively account for approximately xx% of the market, indicating a significant presence.
The industry is characterized by a dynamic innovation ecosystem, fostering the development of advanced technologies like improved FPSO designs and automation systems. Regulatory frameworks, varying across APAC nations, influence investment decisions and operational practices. Substitute products, such as onshore processing facilities, pose competitive challenges, though the unique advantages of floating production in deepwater environments limit their impact. End-user trends favor increased efficiency and environmental sustainability, pushing companies to adopt cleaner technologies. Mergers and acquisitions (M&A) activities have been relatively frequent in recent years, with an estimated xx M&A deals occurring between 2019 and 2024, primarily driven by strategic expansion and technology acquisition.
APAC Floating Production Industry Industry Insights & Trends
The APAC floating production industry is experiencing robust growth, fueled by several key factors. The increasing demand for energy resources in the region, coupled with the exploration of challenging deepwater fields, is a primary growth driver. Technological advancements, including improved subsea technologies and advanced processing systems, are enabling the cost-effective development of previously inaccessible reserves. The rising adoption of automation and digitalization technologies for operational efficiency and safety enhancement also propels market growth.
The market size in 2024 is estimated at $XX Million, demonstrating significant growth compared to previous years. The industry is expected to witness sustained growth due to significant investments in offshore exploration and production activities in countries like Australia, Indonesia, Vietnam, and Malaysia. While the COVID-19 pandemic caused temporary disruptions, the industry has shown resilience, with the long-term growth outlook remaining optimistic. Consumer behavior shifts towards a preference for renewable energy sources present a challenge, although the continued need for hydrocarbons ensures a sustained market in the short to medium term. The market size is projected to reach $XX Million by 2025, with a CAGR of XX% from 2025 to 2033, driven by the factors above.
Key Markets & Segments Leading APAC Floating Production Industry
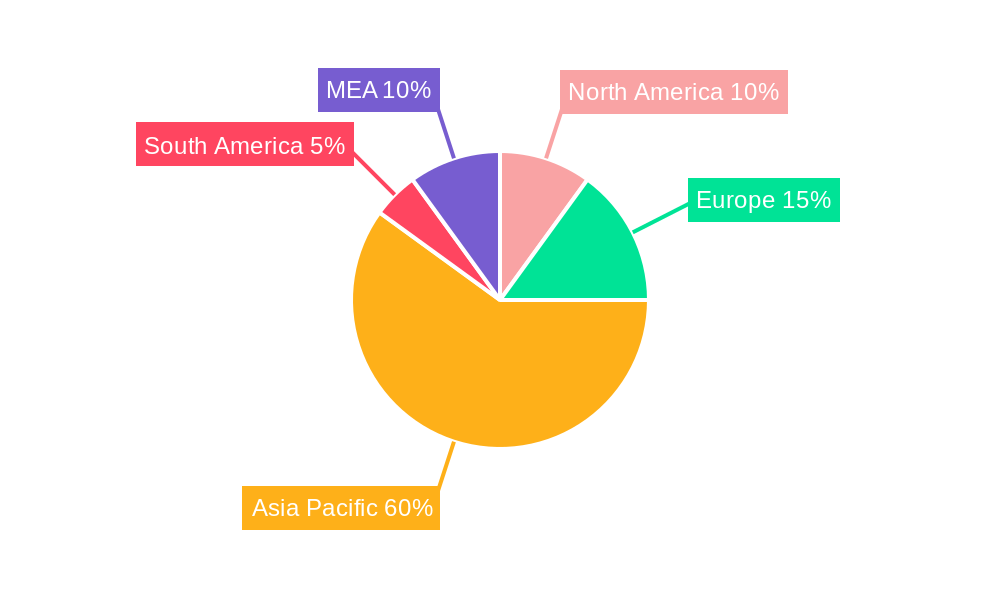
- Dominant Regions & Countries: Australia, Indonesia, and Vietnam are leading the APAC floating production market due to their substantial offshore oil and gas reserves and supportive government policies. Malaysia also plays a significant role due to its established infrastructure and expertise.
- Dominant Segments:
- Type: FPSOs (Floating Production Storage and Offloading units) represent the most dominant segment, owing to their versatility and capability to handle diverse oil and gas production scenarios in various water depths.
- Water Depth: Deepwater and ultra-deepwater segments are experiencing the fastest growth due to the exploration of increasingly challenging offshore fields.
Drivers for Dominant Segments:
- Economic Growth: The robust economic growth in several APAC countries fuels demand for energy, driving investment in offshore oil and gas projects.
- Infrastructure Development: Significant investments in port infrastructure and related services support the floating production industry's operations.
- Technological Advancements: The development of advanced technologies facilitates efficient and cost-effective operations in deepwater environments.
The dominance of FPSOs and deepwater segments is mainly due to the high capital expenditure required for deepwater projects, and the capability of FPSOs to handle complex production scenarios efficiently. The growing number of deepwater discoveries and supportive government regulations further solidify this trend.
APAC Floating Production Industry Product Developments
Significant product innovations are reshaping the APAC floating production industry. Advancements in subsea processing technology, along with improved FPSO designs for enhanced efficiency and environmental compliance, are key drivers. The integration of advanced automation and digitalization technologies is enhancing operational efficiency and safety, optimizing production, and minimizing environmental impact. These innovations contribute to improved cost-effectiveness and competitiveness within the market, opening up new opportunities in challenging deepwater environments.
Challenges in the APAC Floating Production Industry Market
The APAC floating production industry faces several challenges. Regulatory uncertainties and inconsistencies across different countries can hinder investments and project approvals. Supply chain disruptions and the availability of skilled labor also pose significant concerns, impacting project timelines and costs. Intense competition among established players and the entry of new entrants create pressure on pricing and profitability. The global shift toward renewable energy sources introduces long-term competitive pressures that are increasingly difficult to ignore. For example, a delay in project approvals due to regulatory hurdles could lead to a $xx Million loss in potential revenue annually.
Forces Driving APAC Floating Production Industry Growth
Technological advancements, specifically in subsea processing and automation, are major drivers of industry growth. The economic growth in many APAC nations fuels demand for energy, prompting increased investment in offshore exploration and production. Supportive government policies and regulatory frameworks in several countries, incentivizing offshore development, further contribute to industry expansion. Specific examples include the expansion of infrastructure in several countries to facilitate deep-water projects and government tax incentives to encourage offshore energy exploration.
Challenges in the APAC Floating Production Industry Market
Long-term growth hinges on continued innovation, strategic partnerships, and market expansion into new geographical areas. Developing sustainable and environmentally friendly solutions will be crucial to ensure long-term viability. Strategic alliances between major players and smaller technology firms can accelerate the development and deployment of innovative technologies. Expansion into new, less explored regions with substantial oil and gas potential promises significant future growth.
Emerging Opportunities in APAP Floating Production Industry
Emerging opportunities lie in the development of advanced technologies, such as autonomous and remotely operated systems for enhanced operational efficiency and safety. The exploration of new fields in deeper waters presents significant potential, demanding innovative solutions for efficient production in such challenging environments. Growing focus on environmental sustainability opens opportunities for the development and adoption of cleaner and more eco-friendly technologies. Furthermore, collaborations with technology companies outside the traditional oil and gas sector can accelerate innovation.
Leading Players in the APAC Floating Production Industry Sector
- MODEC Inc
- Malaysia Marine and Heavy Engineering SDN BHD
- Keppel Offshore and Marine Ltd
- SBM Offshore N V
- Samsung Heavy Industries Co Ltd
- Teekay Corporation
- Hyundai Heavy Industries Co Ltd
- TechnipFMC PLC
- Bumi Armada Berhad
- Mitsubishi Heavy Industries Ltd
Key Milestones in APAC Floating Production Industry Industry
- 2020: Successful deployment of a new generation FPSO with enhanced automation capabilities in the Indonesian waters.
- 2022: Announced strategic partnership between MODEC Inc. and a leading technology company for the development of a new subsea processing system.
- 2023: Completion of a major M&A deal involving two significant players, leading to increased market consolidation.
- 2024: Launch of a new environmental sustainability initiative by a major industry player, promoting the adoption of cleaner technologies.
Strategic Outlook for APAC Floating Production Industry Market
The APAC floating production industry is poised for significant growth, driven by increasing energy demand and technological advancements. Strategic investments in innovative technologies, strategic partnerships, and expansion into new markets will be crucial for success. Addressing the challenges of regulatory uncertainty, supply chain complexities, and environmental concerns will be critical for long-term sustainability and profitability. The continued exploration and development of offshore resources, coupled with a focus on efficiency and sustainability, present substantial opportunities for industry players.
APAC Floating Production Industry Segmentation
-
1. Type
- 1.1. FPSO
- 1.2. Tension Leg Platform
- 1.3. SPAR
- 1.4. Barge
-
2. Water Depth
- 2.1. Shallow Water
- 2.2. Deepwater and Ultra-Deepwater
-
3. Geography
- 3.1. China
- 3.2. Australia
- 3.3. India
- 3.4. Malaysia
- 3.5. Rest of Asia-Pacific
APAC Floating Production Industry Segmentation By Geography
- 1. China
- 2. Australia
- 3. India
- 4. Malaysia
- 5. Rest of Asia Pacific
APAC Floating Production Industry REPORT HIGHLIGHTS
| Aspects | Details |
|---|---|
| Study Period | 2019-2033 |
| Base Year | 2024 |
| Estimated Year | 2025 |
| Forecast Period | 2025-2033 |
| Historical Period | 2019-2024 |
| Growth Rate | CAGR of > 10.00% from 2019-2033 |
| Segmentation |
|
Table of Contents
- 1. Introduction
- 1.1. Research Scope
- 1.2. Market Segmentation
- 1.3. Research Methodology
- 1.4. Definitions and Assumptions
- 2. Executive Summary
- 2.1. Introduction
- 3. Market Dynamics
- 3.1. Introduction
- 3.2. Market Drivers
- 3.2.1. 4.; An Increase in the Use of LNG as an Energy Source
- 3.3. Market Restrains
- 3.3.1. 4.; Increasing Adoption of Solar and Wind Energy
- 3.4. Market Trends
- 3.4.1 Floating Production
- 3.4.2 Storage and Offloading (FPSO) to Dominate the Market
- 4. Market Factor Analysis
- 4.1. Porters Five Forces
- 4.2. Supply/Value Chain
- 4.3. PESTEL analysis
- 4.4. Market Entropy
- 4.5. Patent/Trademark Analysis
- 5. Global APAC Floating Production Industry Analysis, Insights and Forecast, 2019-2031
- 5.1. Market Analysis, Insights and Forecast - by Type
- 5.1.1. FPSO
- 5.1.2. Tension Leg Platform
- 5.1.3. SPAR
- 5.1.4. Barge
- 5.2. Market Analysis, Insights and Forecast - by Water Depth
- 5.2.1. Shallow Water
- 5.2.2. Deepwater and Ultra-Deepwater
- 5.3. Market Analysis, Insights and Forecast - by Geography
- 5.3.1. China
- 5.3.2. Australia
- 5.3.3. India
- 5.3.4. Malaysia
- 5.3.5. Rest of Asia-Pacific
- 5.4. Market Analysis, Insights and Forecast - by Region
- 5.4.1. China
- 5.4.2. Australia
- 5.4.3. India
- 5.4.4. Malaysia
- 5.4.5. Rest of Asia Pacific
- 5.1. Market Analysis, Insights and Forecast - by Type
- 6. China APAC Floating Production Industry Analysis, Insights and Forecast, 2019-2031
- 6.1. Market Analysis, Insights and Forecast - by Type
- 6.1.1. FPSO
- 6.1.2. Tension Leg Platform
- 6.1.3. SPAR
- 6.1.4. Barge
- 6.2. Market Analysis, Insights and Forecast - by Water Depth
- 6.2.1. Shallow Water
- 6.2.2. Deepwater and Ultra-Deepwater
- 6.3. Market Analysis, Insights and Forecast - by Geography
- 6.3.1. China
- 6.3.2. Australia
- 6.3.3. India
- 6.3.4. Malaysia
- 6.3.5. Rest of Asia-Pacific
- 6.1. Market Analysis, Insights and Forecast - by Type
- 7. Australia APAC Floating Production Industry Analysis, Insights and Forecast, 2019-2031
- 7.1. Market Analysis, Insights and Forecast - by Type
- 7.1.1. FPSO
- 7.1.2. Tension Leg Platform
- 7.1.3. SPAR
- 7.1.4. Barge
- 7.2. Market Analysis, Insights and Forecast - by Water Depth
- 7.2.1. Shallow Water
- 7.2.2. Deepwater and Ultra-Deepwater
- 7.3. Market Analysis, Insights and Forecast - by Geography
- 7.3.1. China
- 7.3.2. Australia
- 7.3.3. India
- 7.3.4. Malaysia
- 7.3.5. Rest of Asia-Pacific
- 7.1. Market Analysis, Insights and Forecast - by Type
- 8. India APAC Floating Production Industry Analysis, Insights and Forecast, 2019-2031
- 8.1. Market Analysis, Insights and Forecast - by Type
- 8.1.1. FPSO
- 8.1.2. Tension Leg Platform
- 8.1.3. SPAR
- 8.1.4. Barge
- 8.2. Market Analysis, Insights and Forecast - by Water Depth
- 8.2.1. Shallow Water
- 8.2.2. Deepwater and Ultra-Deepwater
- 8.3. Market Analysis, Insights and Forecast - by Geography
- 8.3.1. China
- 8.3.2. Australia
- 8.3.3. India
- 8.3.4. Malaysia
- 8.3.5. Rest of Asia-Pacific
- 8.1. Market Analysis, Insights and Forecast - by Type
- 9. Malaysia APAC Floating Production Industry Analysis, Insights and Forecast, 2019-2031
- 9.1. Market Analysis, Insights and Forecast - by Type
- 9.1.1. FPSO
- 9.1.2. Tension Leg Platform
- 9.1.3. SPAR
- 9.1.4. Barge
- 9.2. Market Analysis, Insights and Forecast - by Water Depth
- 9.2.1. Shallow Water
- 9.2.2. Deepwater and Ultra-Deepwater
- 9.3. Market Analysis, Insights and Forecast - by Geography
- 9.3.1. China
- 9.3.2. Australia
- 9.3.3. India
- 9.3.4. Malaysia
- 9.3.5. Rest of Asia-Pacific
- 9.1. Market Analysis, Insights and Forecast - by Type
- 10. Rest of Asia Pacific APAC Floating Production Industry Analysis, Insights and Forecast, 2019-2031
- 10.1. Market Analysis, Insights and Forecast - by Type
- 10.1.1. FPSO
- 10.1.2. Tension Leg Platform
- 10.1.3. SPAR
- 10.1.4. Barge
- 10.2. Market Analysis, Insights and Forecast - by Water Depth
- 10.2.1. Shallow Water
- 10.2.2. Deepwater and Ultra-Deepwater
- 10.3. Market Analysis, Insights and Forecast - by Geography
- 10.3.1. China
- 10.3.2. Australia
- 10.3.3. India
- 10.3.4. Malaysia
- 10.3.5. Rest of Asia-Pacific
- 10.1. Market Analysis, Insights and Forecast - by Type
- 11. North America APAC Floating Production Industry Analysis, Insights and Forecast, 2019-2031
- 11.1. Market Analysis, Insights and Forecast - By Country/Sub-region
- 11.1.1 United States
- 11.1.2 Canada
- 11.1.3 Mexico
- 12. Europe APAC Floating Production Industry Analysis, Insights and Forecast, 2019-2031
- 12.1. Market Analysis, Insights and Forecast - By Country/Sub-region
- 12.1.1 Germany
- 12.1.2 United Kingdom
- 12.1.3 France
- 12.1.4 Spain
- 12.1.5 Italy
- 12.1.6 Spain
- 12.1.7 Belgium
- 12.1.8 Netherland
- 12.1.9 Nordics
- 12.1.10 Rest of Europe
- 13. Asia Pacific APAC Floating Production Industry Analysis, Insights and Forecast, 2019-2031
- 13.1. Market Analysis, Insights and Forecast - By Country/Sub-region
- 13.1.1 China
- 13.1.2 Japan
- 13.1.3 India
- 13.1.4 South Korea
- 13.1.5 Southeast Asia
- 13.1.6 Australia
- 13.1.7 Indonesia
- 13.1.8 Phillipes
- 13.1.9 Singapore
- 13.1.10 Thailandc
- 13.1.11 Rest of Asia Pacific
- 14. South America APAC Floating Production Industry Analysis, Insights and Forecast, 2019-2031
- 14.1. Market Analysis, Insights and Forecast - By Country/Sub-region
- 14.1.1 Brazil
- 14.1.2 Argentina
- 14.1.3 Peru
- 14.1.4 Chile
- 14.1.5 Colombia
- 14.1.6 Ecuador
- 14.1.7 Venezuela
- 14.1.8 Rest of South America
- 15. MEA APAC Floating Production Industry Analysis, Insights and Forecast, 2019-2031
- 15.1. Market Analysis, Insights and Forecast - By Country/Sub-region
- 15.1.1 United Arab Emirates
- 15.1.2 Saudi Arabia
- 15.1.3 South Africa
- 15.1.4 Rest of Middle East and Africa
- 16. Competitive Analysis
- 16.1. Global Market Share Analysis 2024
- 16.2. Company Profiles
- 16.2.1 MODEC Inc
- 16.2.1.1. Overview
- 16.2.1.2. Products
- 16.2.1.3. SWOT Analysis
- 16.2.1.4. Recent Developments
- 16.2.1.5. Financials (Based on Availability)
- 16.2.2 Malaysia Marine and Heavy Engineering SDN BHD
- 16.2.2.1. Overview
- 16.2.2.2. Products
- 16.2.2.3. SWOT Analysis
- 16.2.2.4. Recent Developments
- 16.2.2.5. Financials (Based on Availability)
- 16.2.3 Keppel Offshore and Marine Ltd
- 16.2.3.1. Overview
- 16.2.3.2. Products
- 16.2.3.3. SWOT Analysis
- 16.2.3.4. Recent Developments
- 16.2.3.5. Financials (Based on Availability)
- 16.2.4 SBM Offshore N V
- 16.2.4.1. Overview
- 16.2.4.2. Products
- 16.2.4.3. SWOT Analysis
- 16.2.4.4. Recent Developments
- 16.2.4.5. Financials (Based on Availability)
- 16.2.5 Samsung Heavy Industries Co Ltd
- 16.2.5.1. Overview
- 16.2.5.2. Products
- 16.2.5.3. SWOT Analysis
- 16.2.5.4. Recent Developments
- 16.2.5.5. Financials (Based on Availability)
- 16.2.6 Teekay Corporation
- 16.2.6.1. Overview
- 16.2.6.2. Products
- 16.2.6.3. SWOT Analysis
- 16.2.6.4. Recent Developments
- 16.2.6.5. Financials (Based on Availability)
- 16.2.7 Hyundai Heavy Industries Co Ltd
- 16.2.7.1. Overview
- 16.2.7.2. Products
- 16.2.7.3. SWOT Analysis
- 16.2.7.4. Recent Developments
- 16.2.7.5. Financials (Based on Availability)
- 16.2.8 TechnipFMC PLC
- 16.2.8.1. Overview
- 16.2.8.2. Products
- 16.2.8.3. SWOT Analysis
- 16.2.8.4. Recent Developments
- 16.2.8.5. Financials (Based on Availability)
- 16.2.9 Bumi Armada Berhad
- 16.2.9.1. Overview
- 16.2.9.2. Products
- 16.2.9.3. SWOT Analysis
- 16.2.9.4. Recent Developments
- 16.2.9.5. Financials (Based on Availability)
- 16.2.10 Mitsubishi Heavy Industries Ltd
- 16.2.10.1. Overview
- 16.2.10.2. Products
- 16.2.10.3. SWOT Analysis
- 16.2.10.4. Recent Developments
- 16.2.10.5. Financials (Based on Availability)
- 16.2.1 MODEC Inc
List of Figures
- Figure 1: Global APAC Floating Production Industry Revenue Breakdown (Million, %) by Region 2024 & 2032
- Figure 2: North America APAC Floating Production Industry Revenue (Million), by Country 2024 & 2032
- Figure 3: North America APAC Floating Production Industry Revenue Share (%), by Country 2024 & 2032
- Figure 4: Europe APAC Floating Production Industry Revenue (Million), by Country 2024 & 2032
- Figure 5: Europe APAC Floating Production Industry Revenue Share (%), by Country 2024 & 2032
- Figure 6: Asia Pacific APAC Floating Production Industry Revenue (Million), by Country 2024 & 2032
- Figure 7: Asia Pacific APAC Floating Production Industry Revenue Share (%), by Country 2024 & 2032
- Figure 8: South America APAC Floating Production Industry Revenue (Million), by Country 2024 & 2032
- Figure 9: South America APAC Floating Production Industry Revenue Share (%), by Country 2024 & 2032
- Figure 10: MEA APAC Floating Production Industry Revenue (Million), by Country 2024 & 2032
- Figure 11: MEA APAC Floating Production Industry Revenue Share (%), by Country 2024 & 2032
- Figure 12: China APAC Floating Production Industry Revenue (Million), by Type 2024 & 2032
- Figure 13: China APAC Floating Production Industry Revenue Share (%), by Type 2024 & 2032
- Figure 14: China APAC Floating Production Industry Revenue (Million), by Water Depth 2024 & 2032
- Figure 15: China APAC Floating Production Industry Revenue Share (%), by Water Depth 2024 & 2032
- Figure 16: China APAC Floating Production Industry Revenue (Million), by Geography 2024 & 2032
- Figure 17: China APAC Floating Production Industry Revenue Share (%), by Geography 2024 & 2032
- Figure 18: China APAC Floating Production Industry Revenue (Million), by Country 2024 & 2032
- Figure 19: China APAC Floating Production Industry Revenue Share (%), by Country 2024 & 2032
- Figure 20: Australia APAC Floating Production Industry Revenue (Million), by Type 2024 & 2032
- Figure 21: Australia APAC Floating Production Industry Revenue Share (%), by Type 2024 & 2032
- Figure 22: Australia APAC Floating Production Industry Revenue (Million), by Water Depth 2024 & 2032
- Figure 23: Australia APAC Floating Production Industry Revenue Share (%), by Water Depth 2024 & 2032
- Figure 24: Australia APAC Floating Production Industry Revenue (Million), by Geography 2024 & 2032
- Figure 25: Australia APAC Floating Production Industry Revenue Share (%), by Geography 2024 & 2032
- Figure 26: Australia APAC Floating Production Industry Revenue (Million), by Country 2024 & 2032
- Figure 27: Australia APAC Floating Production Industry Revenue Share (%), by Country 2024 & 2032
- Figure 28: India APAC Floating Production Industry Revenue (Million), by Type 2024 & 2032
- Figure 29: India APAC Floating Production Industry Revenue Share (%), by Type 2024 & 2032
- Figure 30: India APAC Floating Production Industry Revenue (Million), by Water Depth 2024 & 2032
- Figure 31: India APAC Floating Production Industry Revenue Share (%), by Water Depth 2024 & 2032
- Figure 32: India APAC Floating Production Industry Revenue (Million), by Geography 2024 & 2032
- Figure 33: India APAC Floating Production Industry Revenue Share (%), by Geography 2024 & 2032
- Figure 34: India APAC Floating Production Industry Revenue (Million), by Country 2024 & 2032
- Figure 35: India APAC Floating Production Industry Revenue Share (%), by Country 2024 & 2032
- Figure 36: Malaysia APAC Floating Production Industry Revenue (Million), by Type 2024 & 2032
- Figure 37: Malaysia APAC Floating Production Industry Revenue Share (%), by Type 2024 & 2032
- Figure 38: Malaysia APAC Floating Production Industry Revenue (Million), by Water Depth 2024 & 2032
- Figure 39: Malaysia APAC Floating Production Industry Revenue Share (%), by Water Depth 2024 & 2032
- Figure 40: Malaysia APAC Floating Production Industry Revenue (Million), by Geography 2024 & 2032
- Figure 41: Malaysia APAC Floating Production Industry Revenue Share (%), by Geography 2024 & 2032
- Figure 42: Malaysia APAC Floating Production Industry Revenue (Million), by Country 2024 & 2032
- Figure 43: Malaysia APAC Floating Production Industry Revenue Share (%), by Country 2024 & 2032
- Figure 44: Rest of Asia Pacific APAC Floating Production Industry Revenue (Million), by Type 2024 & 2032
- Figure 45: Rest of Asia Pacific APAC Floating Production Industry Revenue Share (%), by Type 2024 & 2032
- Figure 46: Rest of Asia Pacific APAC Floating Production Industry Revenue (Million), by Water Depth 2024 & 2032
- Figure 47: Rest of Asia Pacific APAC Floating Production Industry Revenue Share (%), by Water Depth 2024 & 2032
- Figure 48: Rest of Asia Pacific APAC Floating Production Industry Revenue (Million), by Geography 2024 & 2032
- Figure 49: Rest of Asia Pacific APAC Floating Production Industry Revenue Share (%), by Geography 2024 & 2032
- Figure 50: Rest of Asia Pacific APAC Floating Production Industry Revenue (Million), by Country 2024 & 2032
- Figure 51: Rest of Asia Pacific APAC Floating Production Industry Revenue Share (%), by Country 2024 & 2032
List of Tables
- Table 1: Global APAC Floating Production Industry Revenue Million Forecast, by Region 2019 & 2032
- Table 2: Global APAC Floating Production Industry Revenue Million Forecast, by Type 2019 & 2032
- Table 3: Global APAC Floating Production Industry Revenue Million Forecast, by Water Depth 2019 & 2032
- Table 4: Global APAC Floating Production Industry Revenue Million Forecast, by Geography 2019 & 2032
- Table 5: Global APAC Floating Production Industry Revenue Million Forecast, by Region 2019 & 2032
- Table 6: Global APAC Floating Production Industry Revenue Million Forecast, by Country 2019 & 2032
- Table 7: United States APAC Floating Production Industry Revenue (Million) Forecast, by Application 2019 & 2032
- Table 8: Canada APAC Floating Production Industry Revenue (Million) Forecast, by Application 2019 & 2032
- Table 9: Mexico APAC Floating Production Industry Revenue (Million) Forecast, by Application 2019 & 2032
- Table 10: Global APAC Floating Production Industry Revenue Million Forecast, by Country 2019 & 2032
- Table 11: Germany APAC Floating Production Industry Revenue (Million) Forecast, by Application 2019 & 2032
- Table 12: United Kingdom APAC Floating Production Industry Revenue (Million) Forecast, by Application 2019 & 2032
- Table 13: France APAC Floating Production Industry Revenue (Million) Forecast, by Application 2019 & 2032
- Table 14: Spain APAC Floating Production Industry Revenue (Million) Forecast, by Application 2019 & 2032
- Table 15: Italy APAC Floating Production Industry Revenue (Million) Forecast, by Application 2019 & 2032
- Table 16: Spain APAC Floating Production Industry Revenue (Million) Forecast, by Application 2019 & 2032
- Table 17: Belgium APAC Floating Production Industry Revenue (Million) Forecast, by Application 2019 & 2032
- Table 18: Netherland APAC Floating Production Industry Revenue (Million) Forecast, by Application 2019 & 2032
- Table 19: Nordics APAC Floating Production Industry Revenue (Million) Forecast, by Application 2019 & 2032
- Table 20: Rest of Europe APAC Floating Production Industry Revenue (Million) Forecast, by Application 2019 & 2032
- Table 21: Global APAC Floating Production Industry Revenue Million Forecast, by Country 2019 & 2032
- Table 22: China APAC Floating Production Industry Revenue (Million) Forecast, by Application 2019 & 2032
- Table 23: Japan APAC Floating Production Industry Revenue (Million) Forecast, by Application 2019 & 2032
- Table 24: India APAC Floating Production Industry Revenue (Million) Forecast, by Application 2019 & 2032
- Table 25: South Korea APAC Floating Production Industry Revenue (Million) Forecast, by Application 2019 & 2032
- Table 26: Southeast Asia APAC Floating Production Industry Revenue (Million) Forecast, by Application 2019 & 2032
- Table 27: Australia APAC Floating Production Industry Revenue (Million) Forecast, by Application 2019 & 2032
- Table 28: Indonesia APAC Floating Production Industry Revenue (Million) Forecast, by Application 2019 & 2032
- Table 29: Phillipes APAC Floating Production Industry Revenue (Million) Forecast, by Application 2019 & 2032
- Table 30: Singapore APAC Floating Production Industry Revenue (Million) Forecast, by Application 2019 & 2032
- Table 31: Thailandc APAC Floating Production Industry Revenue (Million) Forecast, by Application 2019 & 2032
- Table 32: Rest of Asia Pacific APAC Floating Production Industry Revenue (Million) Forecast, by Application 2019 & 2032
- Table 33: Global APAC Floating Production Industry Revenue Million Forecast, by Country 2019 & 2032
- Table 34: Brazil APAC Floating Production Industry Revenue (Million) Forecast, by Application 2019 & 2032
- Table 35: Argentina APAC Floating Production Industry Revenue (Million) Forecast, by Application 2019 & 2032
- Table 36: Peru APAC Floating Production Industry Revenue (Million) Forecast, by Application 2019 & 2032
- Table 37: Chile APAC Floating Production Industry Revenue (Million) Forecast, by Application 2019 & 2032
- Table 38: Colombia APAC Floating Production Industry Revenue (Million) Forecast, by Application 2019 & 2032
- Table 39: Ecuador APAC Floating Production Industry Revenue (Million) Forecast, by Application 2019 & 2032
- Table 40: Venezuela APAC Floating Production Industry Revenue (Million) Forecast, by Application 2019 & 2032
- Table 41: Rest of South America APAC Floating Production Industry Revenue (Million) Forecast, by Application 2019 & 2032
- Table 42: Global APAC Floating Production Industry Revenue Million Forecast, by Country 2019 & 2032
- Table 43: United Arab Emirates APAC Floating Production Industry Revenue (Million) Forecast, by Application 2019 & 2032
- Table 44: Saudi Arabia APAC Floating Production Industry Revenue (Million) Forecast, by Application 2019 & 2032
- Table 45: South Africa APAC Floating Production Industry Revenue (Million) Forecast, by Application 2019 & 2032
- Table 46: Rest of Middle East and Africa APAC Floating Production Industry Revenue (Million) Forecast, by Application 2019 & 2032
- Table 47: Global APAC Floating Production Industry Revenue Million Forecast, by Type 2019 & 2032
- Table 48: Global APAC Floating Production Industry Revenue Million Forecast, by Water Depth 2019 & 2032
- Table 49: Global APAC Floating Production Industry Revenue Million Forecast, by Geography 2019 & 2032
- Table 50: Global APAC Floating Production Industry Revenue Million Forecast, by Country 2019 & 2032
- Table 51: Global APAC Floating Production Industry Revenue Million Forecast, by Type 2019 & 2032
- Table 52: Global APAC Floating Production Industry Revenue Million Forecast, by Water Depth 2019 & 2032
- Table 53: Global APAC Floating Production Industry Revenue Million Forecast, by Geography 2019 & 2032
- Table 54: Global APAC Floating Production Industry Revenue Million Forecast, by Country 2019 & 2032
- Table 55: Global APAC Floating Production Industry Revenue Million Forecast, by Type 2019 & 2032
- Table 56: Global APAC Floating Production Industry Revenue Million Forecast, by Water Depth 2019 & 2032
- Table 57: Global APAC Floating Production Industry Revenue Million Forecast, by Geography 2019 & 2032
- Table 58: Global APAC Floating Production Industry Revenue Million Forecast, by Country 2019 & 2032
- Table 59: Global APAC Floating Production Industry Revenue Million Forecast, by Type 2019 & 2032
- Table 60: Global APAC Floating Production Industry Revenue Million Forecast, by Water Depth 2019 & 2032
- Table 61: Global APAC Floating Production Industry Revenue Million Forecast, by Geography 2019 & 2032
- Table 62: Global APAC Floating Production Industry Revenue Million Forecast, by Country 2019 & 2032
- Table 63: Global APAC Floating Production Industry Revenue Million Forecast, by Type 2019 & 2032
- Table 64: Global APAC Floating Production Industry Revenue Million Forecast, by Water Depth 2019 & 2032
- Table 65: Global APAC Floating Production Industry Revenue Million Forecast, by Geography 2019 & 2032
- Table 66: Global APAC Floating Production Industry Revenue Million Forecast, by Country 2019 & 2032
Frequently Asked Questions
1. What is the projected Compound Annual Growth Rate (CAGR) of the APAC Floating Production Industry?
The projected CAGR is approximately > 10.00%.
2. Which companies are prominent players in the APAC Floating Production Industry?
Key companies in the market include MODEC Inc, Malaysia Marine and Heavy Engineering SDN BHD, Keppel Offshore and Marine Ltd, SBM Offshore N V, Samsung Heavy Industries Co Ltd, Teekay Corporation, Hyundai Heavy Industries Co Ltd, TechnipFMC PLC, Bumi Armada Berhad, Mitsubishi Heavy Industries Ltd.
3. What are the main segments of the APAC Floating Production Industry?
The market segments include Type, Water Depth, Geography.
4. Can you provide details about the market size?
The market size is estimated to be USD XX Million as of 2022.
5. What are some drivers contributing to market growth?
4.; An Increase in the Use of LNG as an Energy Source.
6. What are the notable trends driving market growth?
Floating Production. Storage and Offloading (FPSO) to Dominate the Market.
7. Are there any restraints impacting market growth?
4.; Increasing Adoption of Solar and Wind Energy.
8. Can you provide examples of recent developments in the market?
N/A
9. What pricing options are available for accessing the report?
Pricing options include single-user, multi-user, and enterprise licenses priced at USD 4750, USD 5250, and USD 8750 respectively.
10. Is the market size provided in terms of value or volume?
The market size is provided in terms of value, measured in Million.
11. Are there any specific market keywords associated with the report?
Yes, the market keyword associated with the report is "APAC Floating Production Industry," which aids in identifying and referencing the specific market segment covered.
12. How do I determine which pricing option suits my needs best?
The pricing options vary based on user requirements and access needs. Individual users may opt for single-user licenses, while businesses requiring broader access may choose multi-user or enterprise licenses for cost-effective access to the report.
13. Are there any additional resources or data provided in the APAC Floating Production Industry report?
While the report offers comprehensive insights, it's advisable to review the specific contents or supplementary materials provided to ascertain if additional resources or data are available.
14. How can I stay updated on further developments or reports in the APAC Floating Production Industry?
To stay informed about further developments, trends, and reports in the APAC Floating Production Industry, consider subscribing to industry newsletters, following relevant companies and organizations, or regularly checking reputable industry news sources and publications.
Methodology
Step 1 - Identification of Relevant Samples Size from Population Database


Step 2 - Approaches for Defining Global Market Size (Value, Volume* & Price*)

Note*: In applicable scenarios
Step 3 - Data Sources
Primary Research
- Web Analytics
- Survey Reports
- Research Institute
- Latest Research Reports
- Opinion Leaders
Secondary Research
- Annual Reports
- White Paper
- Latest Press Release
- Industry Association
- Paid Database
- Investor Presentations

Step 4 - Data Triangulation
Involves using different sources of information in order to increase the validity of a study
These sources are likely to be stakeholders in a program - participants, other researchers, program staff, other community members, and so on.
Then we put all data in single framework & apply various statistical tools to find out the dynamic on the market.
During the analysis stage, feedback from the stakeholder groups would be compared to determine areas of agreement as well as areas of divergence
