

Key Insights
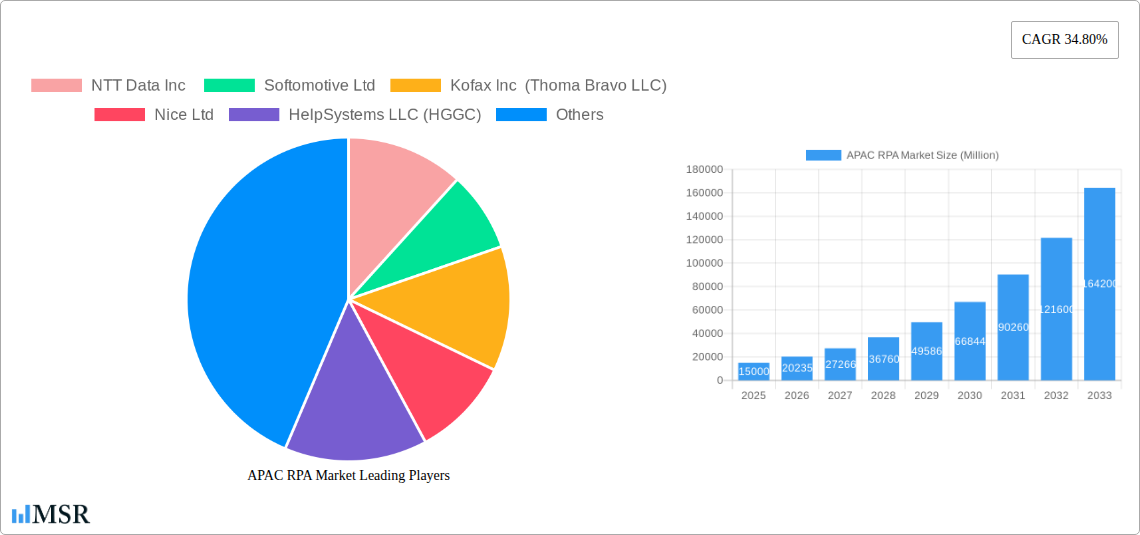
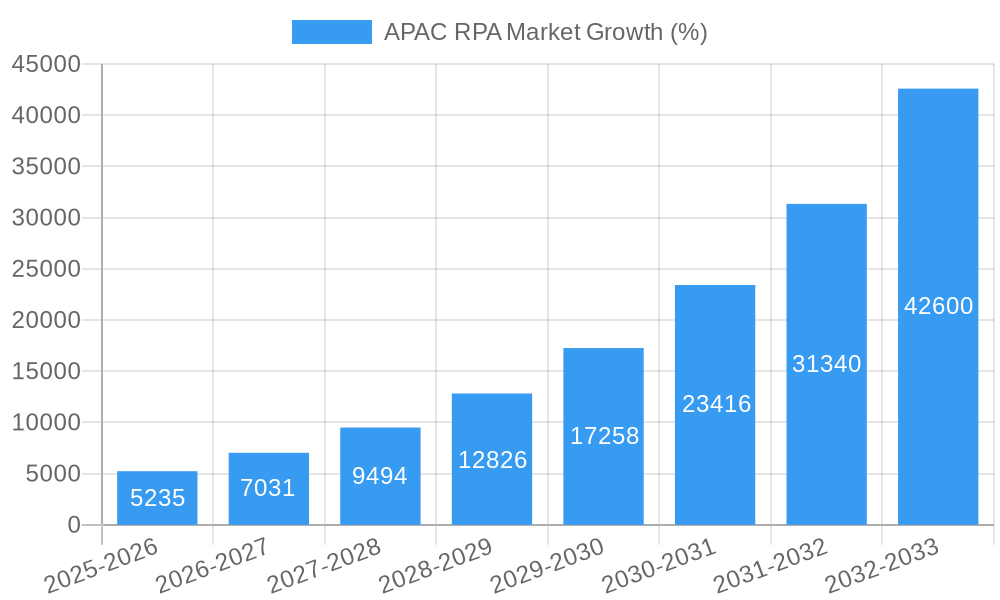
The Asia-Pacific (APAC) Robotic Process Automation (RPA) market is experiencing explosive growth, fueled by the region's rapid digital transformation and increasing adoption of automation technologies across diverse sectors. A 34.80% Compound Annual Growth Rate (CAGR) indicates a significant market expansion, projecting substantial revenue generation throughout the forecast period (2025-2033). Key drivers include the rising need for improved operational efficiency, reduced labor costs, enhanced accuracy, and the increasing availability of cost-effective RPA solutions tailored for specific industry needs. The market is segmented by solution (software and services), enterprise size (SMEs and large enterprises), and end-user industry (IT & Telecom, BFSI, Healthcare, Retail, Manufacturing, Mining, and others). While data specifics for each segment are not provided, the strong overall CAGR suggests robust growth across all segments. The large and diverse economies within APAC, particularly China, Japan, India, and South Korea, contribute significantly to this market expansion. However, challenges like the need for skilled RPA professionals, initial implementation costs, and data security concerns represent potential restraints to wider adoption. Despite these challenges, the overall positive trajectory suggests a continued upward trend for the APAC RPA market in the coming years. The presence of numerous established and emerging players, such as UiPath, Automation Anywhere, and Blue Prism, indicates a competitive yet dynamic market landscape with ample opportunities for innovation and growth. The market's future will depend heavily on continued technological advancements, government support for digitalization initiatives, and the evolving business needs of companies across various sectors.
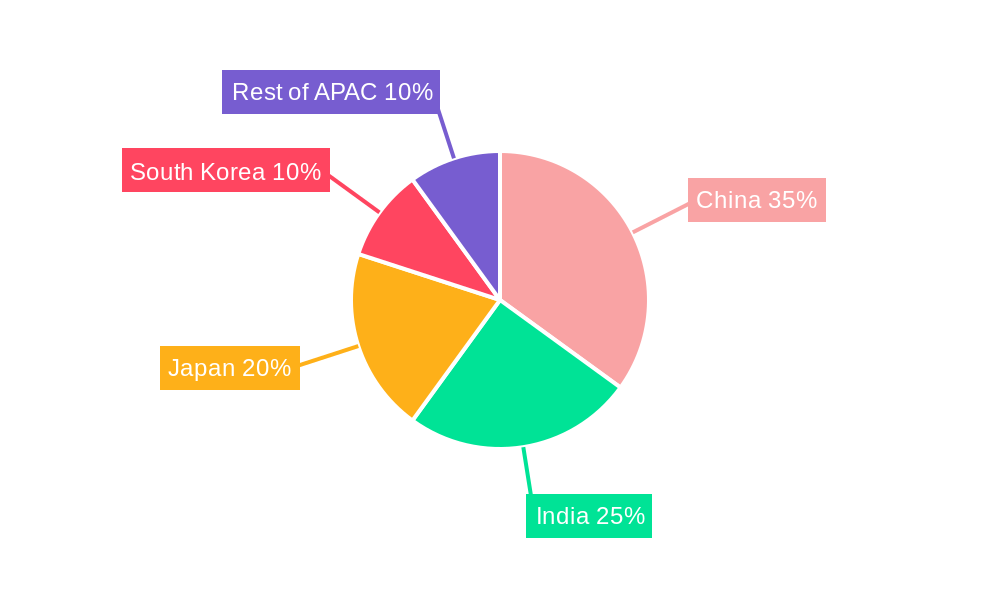
The robust growth of the APAC RPA market is driven by factors including increased business process complexity, the need for improved customer experience, and the desire to optimize operational costs. The software segment is likely to hold a larger market share compared to services, reflecting the ease of deployment and scalability offered by RPA software. Large enterprises, with their greater resources and complex operational requirements, are expected to drive a significant portion of market demand. Amongst the end-user industries, IT & Telecom, BFSI, and Healthcare are anticipated to be leading adopters due to their high reliance on automated processes. Further, government initiatives focusing on digital transformation across the region are creating a favorable environment for the growth of the RPA sector. The geographical distribution of market share is likely to be influenced by the varying levels of digital maturity and economic development within different APAC countries. China, India, and Japan are likely to dominate the regional market share due to their sizable economies and considerable investments in technological advancements. Nevertheless, the continued expansion into other APAC nations remains a significant opportunity for RPA vendors.
APAC RPA Market Report: 2019-2033 Forecast
This comprehensive report provides a detailed analysis of the Asia-Pacific (APAC) Robotic Process Automation (RPA) market, offering invaluable insights for stakeholders across the industry. Covering the period 2019-2033, with a base year of 2025 and a forecast period of 2025-2033, this report meticulously examines market dynamics, growth drivers, key players, and emerging opportunities. The APAC region, encompassing major economies like China, Japan, India, and South Korea, presents a dynamic landscape for RPA adoption, and this report provides a granular understanding of its intricacies. The market is segmented by solution (Software, Service), enterprise size (Small and Medium Enterprises, Large Enterprises), end-user industry (IT and Telecom, BFSI, Healthcare, Retail, Manufacturing, Mining, Other End-user Industries), and country.
APAC RPA Market Market Concentration & Dynamics
The APAC RPA market exhibits a moderately concentrated landscape, with a few major players holding significant market share. However, the presence of numerous smaller, specialized vendors fosters innovation and competition. Market concentration is expected to evolve as new players enter and existing players consolidate through mergers and acquisitions (M&A). The regulatory environment varies across APAC nations, influencing adoption rates and data privacy considerations. Substitute products, such as Business Process Management (BPM) suites with automation capabilities, pose a competitive threat. End-user trends towards digital transformation and automation are key drivers of market growth.
- Market Share (2024 Estimated): Top 5 players hold approximately xx% of the market.
- M&A Activity (2019-2024): xx deals, reflecting increasing consolidation and strategic investments.
- Innovation Ecosystems: Strong presence of technology incubators and research institutions supporting RPA development.
- Regulatory Frameworks: Varying data privacy regulations across countries impact RPA implementation.
APAC RPA Market Industry Insights & Trends
The APAC RPA market is experiencing robust growth, driven by factors such as increasing digitalization, rising labor costs, and the need for improved operational efficiency. The market size in 2024 is estimated at $xx Million, projected to reach $xx Million by 2033, exhibiting a Compound Annual Growth Rate (CAGR) of xx% during the forecast period. Technological advancements, such as the integration of Artificial Intelligence (AI) and Machine Learning (ML), are revolutionizing RPA capabilities, enabling intelligent automation solutions. Evolving consumer expectations for faster and more personalized services are also driving RPA adoption across various industries.
Key Markets & Segments Leading APAC RPA Market
China holds the largest market share within APAC, followed by Japan and India. The large enterprise segment dominates, owing to higher investment capacity and complex operational requirements. The IT and Telecom, BFSI, and Healthcare sectors are key adopters of RPA due to their high transaction volumes and need for process optimization.
- Dominant Region: China
- Dominant Segment (Size of Enterprise): Large Enterprises
- Dominant Segment (End-user Industry): IT and Telecom
- Drivers for China: Rapid economic growth, increasing digitalization initiatives, and government support for technological advancements.
- Drivers for India: Growing IT outsourcing sector, large pool of skilled workforce, and cost-effectiveness.
- Drivers for Japan: Emphasis on efficiency improvement in mature industries, advanced technological infrastructure.
APAC RPA Market Product Developments
Significant advancements in RPA technology include the integration of AI/ML for intelligent automation, enhanced process intelligence capabilities for improved decision-making, and the emergence of low-code/no-code platforms for easier deployment. These developments cater to a wider range of businesses, accelerating market expansion and fostering increased competition among vendors through improved efficiency, scalability, and ease of use.
Challenges in the APAP RPA Market
The APAC RPA market faces challenges such as high implementation costs, the need for skilled professionals, and concerns around job displacement. Integration complexities with legacy systems and varying regulatory landscapes also pose obstacles. These factors can limit adoption, particularly among small and medium enterprises (SMEs). The lack of standardization also contributes to higher integration costs and implementation delays.
Forces Driving APAC RPA Market Growth
Technological advancements, including AI, ML, and cloud computing, are key growth catalysts. Government initiatives promoting digitalization and automation across various sectors further bolster market growth. Rising labor costs and the need for improved operational efficiency within industries are further compelling factors.
Long-Term Growth Catalysts in APAC RPA Market
Long-term growth will be fueled by continued innovation in intelligent automation, expansion into new industry verticals, and strategic partnerships between RPA vendors and system integrators. The increasing focus on hyperautomation and the development of more user-friendly RPA solutions will also drive market expansion.
Emerging Opportunities in APAC RPA Market
Emerging opportunities lie in the increasing adoption of RPA in new industry segments, such as logistics and energy. The expansion into smaller enterprises and the development of niche RPA solutions addressing specific industry challenges presents significant potential.
Leading Players in the APAC RPA Market Sector
- NTT Data Inc
- Softomotive Ltd
- Kofax Inc (Thoma Bravo LLC)
- Nice Ltd
- HelpSystems LLC (HGGC)
- WorFusion Inc
- UIPath Inc
- Datamatics Global Services Limited
- Automation Anywhere Inc
- Pegasystems Inc
- AutomationEdge Technologies Inc
- Blue Prism Group PLC
- AntWorks Pte Ltd
- Kryon System Ltd
Key Milestones in APAC RPA Market Industry
- October 2022: Blue Prism Group PLC and SS&C combined RPA, BPM, AI, and no-code offerings, creating a comprehensive intelligent automation suite. This significantly expanded the capabilities offered to businesses and increased competition.
- May 2022: Pegasystems Inc. acquired Everflow, enhancing its process mining capabilities within Pega process AI. This improved analytics capabilities for clients, providing deeper insights into operational processes and further solidifying Pega's position in the market.
Strategic Outlook for APAC RPA Market
The APAC RPA market holds immense potential for growth, driven by sustained technological advancements and increasing industry adoption. Strategic partnerships, investments in research and development, and expansion into new markets will be crucial for achieving sustained success in this rapidly evolving landscape. Focusing on hyperautomation strategies and addressing the skills gap in the workforce will be vital for long-term growth.
APAC RPA Market Segmentation
-
1. Solution
- 1.1. Software
- 1.2. Service
-
2. Size of Enterprise
- 2.1. Small and Medium Enterprises
- 2.2. Large Enterprises
-
3. End-user Industry
- 3.1. IT and Telecom
- 3.2. BFSI
- 3.3. Healthcare
- 3.4. Retail
- 3.5. Manufacturing
- 3.6. Mining
- 3.7. Other End-user Industries
APAC RPA Market Segmentation By Geography
-
1. North America
- 1.1. United States
- 1.2. Canada
- 1.3. Mexico
-
2. South America
- 2.1. Brazil
- 2.2. Argentina
- 2.3. Rest of South America
-
3. Europe
- 3.1. United Kingdom
- 3.2. Germany
- 3.3. France
- 3.4. Italy
- 3.5. Spain
- 3.6. Russia
- 3.7. Benelux
- 3.8. Nordics
- 3.9. Rest of Europe
-
4. Middle East & Africa
- 4.1. Turkey
- 4.2. Israel
- 4.3. GCC
- 4.4. North Africa
- 4.5. South Africa
- 4.6. Rest of Middle East & Africa
-
5. Asia Pacific
- 5.1. China
- 5.2. India
- 5.3. Japan
- 5.4. South Korea
- 5.5. ASEAN
- 5.6. Oceania
- 5.7. Rest of Asia Pacific
APAC RPA Market REPORT HIGHLIGHTS
| Aspects | Details |
|---|---|
| Study Period | 2019-2033 |
| Base Year | 2024 |
| Estimated Year | 2025 |
| Forecast Period | 2025-2033 |
| Historical Period | 2019-2024 |
| Growth Rate | CAGR of 34.80% from 2019-2033 |
| Segmentation |
|
Table of Contents
- 1. Introduction
- 1.1. Research Scope
- 1.2. Market Segmentation
- 1.3. Research Methodology
- 1.4. Definitions and Assumptions
- 2. Executive Summary
- 2.1. Introduction
- 3. Market Dynamics
- 3.1. Introduction
- 3.2. Market Drivers
- 3.2.1 Reforms by Government and Localization of Documents
- 3.2.2 Support Systems
- 3.2.3 and Interfaces of various RPA Vendors; Increasing Need to Streamline Business Processes and Technological Advancements
- 3.3. Market Restrains
- 3.3.1. Lack of Awareness About Workforce Analytics
- 3.4. Market Trends
- 3.4.1. Mining Sector will Drive the Market Growth
- 4. Market Factor Analysis
- 4.1. Porters Five Forces
- 4.2. Supply/Value Chain
- 4.3. PESTEL analysis
- 4.4. Market Entropy
- 4.5. Patent/Trademark Analysis
- 5. Global APAC RPA Market Analysis, Insights and Forecast, 2019-2031
- 5.1. Market Analysis, Insights and Forecast - by Solution
- 5.1.1. Software
- 5.1.2. Service
- 5.2. Market Analysis, Insights and Forecast - by Size of Enterprise
- 5.2.1. Small and Medium Enterprises
- 5.2.2. Large Enterprises
- 5.3. Market Analysis, Insights and Forecast - by End-user Industry
- 5.3.1. IT and Telecom
- 5.3.2. BFSI
- 5.3.3. Healthcare
- 5.3.4. Retail
- 5.3.5. Manufacturing
- 5.3.6. Mining
- 5.3.7. Other End-user Industries
- 5.4. Market Analysis, Insights and Forecast - by Region
- 5.4.1. North America
- 5.4.2. South America
- 5.4.3. Europe
- 5.4.4. Middle East & Africa
- 5.4.5. Asia Pacific
- 5.1. Market Analysis, Insights and Forecast - by Solution
- 6. North America APAC RPA Market Analysis, Insights and Forecast, 2019-2031
- 6.1. Market Analysis, Insights and Forecast - by Solution
- 6.1.1. Software
- 6.1.2. Service
- 6.2. Market Analysis, Insights and Forecast - by Size of Enterprise
- 6.2.1. Small and Medium Enterprises
- 6.2.2. Large Enterprises
- 6.3. Market Analysis, Insights and Forecast - by End-user Industry
- 6.3.1. IT and Telecom
- 6.3.2. BFSI
- 6.3.3. Healthcare
- 6.3.4. Retail
- 6.3.5. Manufacturing
- 6.3.6. Mining
- 6.3.7. Other End-user Industries
- 6.1. Market Analysis, Insights and Forecast - by Solution
- 7. South America APAC RPA Market Analysis, Insights and Forecast, 2019-2031
- 7.1. Market Analysis, Insights and Forecast - by Solution
- 7.1.1. Software
- 7.1.2. Service
- 7.2. Market Analysis, Insights and Forecast - by Size of Enterprise
- 7.2.1. Small and Medium Enterprises
- 7.2.2. Large Enterprises
- 7.3. Market Analysis, Insights and Forecast - by End-user Industry
- 7.3.1. IT and Telecom
- 7.3.2. BFSI
- 7.3.3. Healthcare
- 7.3.4. Retail
- 7.3.5. Manufacturing
- 7.3.6. Mining
- 7.3.7. Other End-user Industries
- 7.1. Market Analysis, Insights and Forecast - by Solution
- 8. Europe APAC RPA Market Analysis, Insights and Forecast, 2019-2031
- 8.1. Market Analysis, Insights and Forecast - by Solution
- 8.1.1. Software
- 8.1.2. Service
- 8.2. Market Analysis, Insights and Forecast - by Size of Enterprise
- 8.2.1. Small and Medium Enterprises
- 8.2.2. Large Enterprises
- 8.3. Market Analysis, Insights and Forecast - by End-user Industry
- 8.3.1. IT and Telecom
- 8.3.2. BFSI
- 8.3.3. Healthcare
- 8.3.4. Retail
- 8.3.5. Manufacturing
- 8.3.6. Mining
- 8.3.7. Other End-user Industries
- 8.1. Market Analysis, Insights and Forecast - by Solution
- 9. Middle East & Africa APAC RPA Market Analysis, Insights and Forecast, 2019-2031
- 9.1. Market Analysis, Insights and Forecast - by Solution
- 9.1.1. Software
- 9.1.2. Service
- 9.2. Market Analysis, Insights and Forecast - by Size of Enterprise
- 9.2.1. Small and Medium Enterprises
- 9.2.2. Large Enterprises
- 9.3. Market Analysis, Insights and Forecast - by End-user Industry
- 9.3.1. IT and Telecom
- 9.3.2. BFSI
- 9.3.3. Healthcare
- 9.3.4. Retail
- 9.3.5. Manufacturing
- 9.3.6. Mining
- 9.3.7. Other End-user Industries
- 9.1. Market Analysis, Insights and Forecast - by Solution
- 10. Asia Pacific APAC RPA Market Analysis, Insights and Forecast, 2019-2031
- 10.1. Market Analysis, Insights and Forecast - by Solution
- 10.1.1. Software
- 10.1.2. Service
- 10.2. Market Analysis, Insights and Forecast - by Size of Enterprise
- 10.2.1. Small and Medium Enterprises
- 10.2.2. Large Enterprises
- 10.3. Market Analysis, Insights and Forecast - by End-user Industry
- 10.3.1. IT and Telecom
- 10.3.2. BFSI
- 10.3.3. Healthcare
- 10.3.4. Retail
- 10.3.5. Manufacturing
- 10.3.6. Mining
- 10.3.7. Other End-user Industries
- 10.1. Market Analysis, Insights and Forecast - by Solution
- 11. Competitive Analysis
- 11.1. Global Market Share Analysis 2024
- 11.2. Company Profiles
- 11.2.1 NTT Data Inc
- 11.2.1.1. Overview
- 11.2.1.2. Products
- 11.2.1.3. SWOT Analysis
- 11.2.1.4. Recent Developments
- 11.2.1.5. Financials (Based on Availability)
- 11.2.2 Softomotive Ltd
- 11.2.2.1. Overview
- 11.2.2.2. Products
- 11.2.2.3. SWOT Analysis
- 11.2.2.4. Recent Developments
- 11.2.2.5. Financials (Based on Availability)
- 11.2.3 Kofax Inc (Thoma Bravo LLC)
- 11.2.3.1. Overview
- 11.2.3.2. Products
- 11.2.3.3. SWOT Analysis
- 11.2.3.4. Recent Developments
- 11.2.3.5. Financials (Based on Availability)
- 11.2.4 Nice Ltd
- 11.2.4.1. Overview
- 11.2.4.2. Products
- 11.2.4.3. SWOT Analysis
- 11.2.4.4. Recent Developments
- 11.2.4.5. Financials (Based on Availability)
- 11.2.5 HelpSystems LLC (HGGC)
- 11.2.5.1. Overview
- 11.2.5.2. Products
- 11.2.5.3. SWOT Analysis
- 11.2.5.4. Recent Developments
- 11.2.5.5. Financials (Based on Availability)
- 11.2.6 WorFusion Inc
- 11.2.6.1. Overview
- 11.2.6.2. Products
- 11.2.6.3. SWOT Analysis
- 11.2.6.4. Recent Developments
- 11.2.6.5. Financials (Based on Availability)
- 11.2.7 UIPath Inc
- 11.2.7.1. Overview
- 11.2.7.2. Products
- 11.2.7.3. SWOT Analysis
- 11.2.7.4. Recent Developments
- 11.2.7.5. Financials (Based on Availability)
- 11.2.8 Datamatics Global Services Limited
- 11.2.8.1. Overview
- 11.2.8.2. Products
- 11.2.8.3. SWOT Analysis
- 11.2.8.4. Recent Developments
- 11.2.8.5. Financials (Based on Availability)
- 11.2.9 Automation Anywhere Inc
- 11.2.9.1. Overview
- 11.2.9.2. Products
- 11.2.9.3. SWOT Analysis
- 11.2.9.4. Recent Developments
- 11.2.9.5. Financials (Based on Availability)
- 11.2.10 Pegasystems Inc
- 11.2.10.1. Overview
- 11.2.10.2. Products
- 11.2.10.3. SWOT Analysis
- 11.2.10.4. Recent Developments
- 11.2.10.5. Financials (Based on Availability)
- 11.2.11 AutomationEdge Technologies Inc
- 11.2.11.1. Overview
- 11.2.11.2. Products
- 11.2.11.3. SWOT Analysis
- 11.2.11.4. Recent Developments
- 11.2.11.5. Financials (Based on Availability)
- 11.2.12 Blue Prism Group PLC
- 11.2.12.1. Overview
- 11.2.12.2. Products
- 11.2.12.3. SWOT Analysis
- 11.2.12.4. Recent Developments
- 11.2.12.5. Financials (Based on Availability)
- 11.2.13 AntWorks Pte Ltd
- 11.2.13.1. Overview
- 11.2.13.2. Products
- 11.2.13.3. SWOT Analysis
- 11.2.13.4. Recent Developments
- 11.2.13.5. Financials (Based on Availability)
- 11.2.14 Kryon System Ltd
- 11.2.14.1. Overview
- 11.2.14.2. Products
- 11.2.14.3. SWOT Analysis
- 11.2.14.4. Recent Developments
- 11.2.14.5. Financials (Based on Availability)
- 11.2.1 NTT Data Inc
List of Figures
- Figure 1: Global APAC RPA Market Revenue Breakdown (Million, %) by Region 2024 & 2032
- Figure 2: North America APAC RPA Market Revenue (Million), by Solution 2024 & 2032
- Figure 3: North America APAC RPA Market Revenue Share (%), by Solution 2024 & 2032
- Figure 4: North America APAC RPA Market Revenue (Million), by Size of Enterprise 2024 & 2032
- Figure 5: North America APAC RPA Market Revenue Share (%), by Size of Enterprise 2024 & 2032
- Figure 6: North America APAC RPA Market Revenue (Million), by End-user Industry 2024 & 2032
- Figure 7: North America APAC RPA Market Revenue Share (%), by End-user Industry 2024 & 2032
- Figure 8: North America APAC RPA Market Revenue (Million), by Country 2024 & 2032
- Figure 9: North America APAC RPA Market Revenue Share (%), by Country 2024 & 2032
- Figure 10: South America APAC RPA Market Revenue (Million), by Solution 2024 & 2032
- Figure 11: South America APAC RPA Market Revenue Share (%), by Solution 2024 & 2032
- Figure 12: South America APAC RPA Market Revenue (Million), by Size of Enterprise 2024 & 2032
- Figure 13: South America APAC RPA Market Revenue Share (%), by Size of Enterprise 2024 & 2032
- Figure 14: South America APAC RPA Market Revenue (Million), by End-user Industry 2024 & 2032
- Figure 15: South America APAC RPA Market Revenue Share (%), by End-user Industry 2024 & 2032
- Figure 16: South America APAC RPA Market Revenue (Million), by Country 2024 & 2032
- Figure 17: South America APAC RPA Market Revenue Share (%), by Country 2024 & 2032
- Figure 18: Europe APAC RPA Market Revenue (Million), by Solution 2024 & 2032
- Figure 19: Europe APAC RPA Market Revenue Share (%), by Solution 2024 & 2032
- Figure 20: Europe APAC RPA Market Revenue (Million), by Size of Enterprise 2024 & 2032
- Figure 21: Europe APAC RPA Market Revenue Share (%), by Size of Enterprise 2024 & 2032
- Figure 22: Europe APAC RPA Market Revenue (Million), by End-user Industry 2024 & 2032
- Figure 23: Europe APAC RPA Market Revenue Share (%), by End-user Industry 2024 & 2032
- Figure 24: Europe APAC RPA Market Revenue (Million), by Country 2024 & 2032
- Figure 25: Europe APAC RPA Market Revenue Share (%), by Country 2024 & 2032
- Figure 26: Middle East & Africa APAC RPA Market Revenue (Million), by Solution 2024 & 2032
- Figure 27: Middle East & Africa APAC RPA Market Revenue Share (%), by Solution 2024 & 2032
- Figure 28: Middle East & Africa APAC RPA Market Revenue (Million), by Size of Enterprise 2024 & 2032
- Figure 29: Middle East & Africa APAC RPA Market Revenue Share (%), by Size of Enterprise 2024 & 2032
- Figure 30: Middle East & Africa APAC RPA Market Revenue (Million), by End-user Industry 2024 & 2032
- Figure 31: Middle East & Africa APAC RPA Market Revenue Share (%), by End-user Industry 2024 & 2032
- Figure 32: Middle East & Africa APAC RPA Market Revenue (Million), by Country 2024 & 2032
- Figure 33: Middle East & Africa APAC RPA Market Revenue Share (%), by Country 2024 & 2032
- Figure 34: Asia Pacific APAC RPA Market Revenue (Million), by Solution 2024 & 2032
- Figure 35: Asia Pacific APAC RPA Market Revenue Share (%), by Solution 2024 & 2032
- Figure 36: Asia Pacific APAC RPA Market Revenue (Million), by Size of Enterprise 2024 & 2032
- Figure 37: Asia Pacific APAC RPA Market Revenue Share (%), by Size of Enterprise 2024 & 2032
- Figure 38: Asia Pacific APAC RPA Market Revenue (Million), by End-user Industry 2024 & 2032
- Figure 39: Asia Pacific APAC RPA Market Revenue Share (%), by End-user Industry 2024 & 2032
- Figure 40: Asia Pacific APAC RPA Market Revenue (Million), by Country 2024 & 2032
- Figure 41: Asia Pacific APAC RPA Market Revenue Share (%), by Country 2024 & 2032
List of Tables
- Table 1: Global APAC RPA Market Revenue Million Forecast, by Region 2019 & 2032
- Table 2: Global APAC RPA Market Revenue Million Forecast, by Solution 2019 & 2032
- Table 3: Global APAC RPA Market Revenue Million Forecast, by Size of Enterprise 2019 & 2032
- Table 4: Global APAC RPA Market Revenue Million Forecast, by End-user Industry 2019 & 2032
- Table 5: Global APAC RPA Market Revenue Million Forecast, by Region 2019 & 2032
- Table 6: Global APAC RPA Market Revenue Million Forecast, by Solution 2019 & 2032
- Table 7: Global APAC RPA Market Revenue Million Forecast, by Size of Enterprise 2019 & 2032
- Table 8: Global APAC RPA Market Revenue Million Forecast, by End-user Industry 2019 & 2032
- Table 9: Global APAC RPA Market Revenue Million Forecast, by Country 2019 & 2032
- Table 10: United States APAC RPA Market Revenue (Million) Forecast, by Application 2019 & 2032
- Table 11: Canada APAC RPA Market Revenue (Million) Forecast, by Application 2019 & 2032
- Table 12: Mexico APAC RPA Market Revenue (Million) Forecast, by Application 2019 & 2032
- Table 13: Global APAC RPA Market Revenue Million Forecast, by Solution 2019 & 2032
- Table 14: Global APAC RPA Market Revenue Million Forecast, by Size of Enterprise 2019 & 2032
- Table 15: Global APAC RPA Market Revenue Million Forecast, by End-user Industry 2019 & 2032
- Table 16: Global APAC RPA Market Revenue Million Forecast, by Country 2019 & 2032
- Table 17: Brazil APAC RPA Market Revenue (Million) Forecast, by Application 2019 & 2032
- Table 18: Argentina APAC RPA Market Revenue (Million) Forecast, by Application 2019 & 2032
- Table 19: Rest of South America APAC RPA Market Revenue (Million) Forecast, by Application 2019 & 2032
- Table 20: Global APAC RPA Market Revenue Million Forecast, by Solution 2019 & 2032
- Table 21: Global APAC RPA Market Revenue Million Forecast, by Size of Enterprise 2019 & 2032
- Table 22: Global APAC RPA Market Revenue Million Forecast, by End-user Industry 2019 & 2032
- Table 23: Global APAC RPA Market Revenue Million Forecast, by Country 2019 & 2032
- Table 24: United Kingdom APAC RPA Market Revenue (Million) Forecast, by Application 2019 & 2032
- Table 25: Germany APAC RPA Market Revenue (Million) Forecast, by Application 2019 & 2032
- Table 26: France APAC RPA Market Revenue (Million) Forecast, by Application 2019 & 2032
- Table 27: Italy APAC RPA Market Revenue (Million) Forecast, by Application 2019 & 2032
- Table 28: Spain APAC RPA Market Revenue (Million) Forecast, by Application 2019 & 2032
- Table 29: Russia APAC RPA Market Revenue (Million) Forecast, by Application 2019 & 2032
- Table 30: Benelux APAC RPA Market Revenue (Million) Forecast, by Application 2019 & 2032
- Table 31: Nordics APAC RPA Market Revenue (Million) Forecast, by Application 2019 & 2032
- Table 32: Rest of Europe APAC RPA Market Revenue (Million) Forecast, by Application 2019 & 2032
- Table 33: Global APAC RPA Market Revenue Million Forecast, by Solution 2019 & 2032
- Table 34: Global APAC RPA Market Revenue Million Forecast, by Size of Enterprise 2019 & 2032
- Table 35: Global APAC RPA Market Revenue Million Forecast, by End-user Industry 2019 & 2032
- Table 36: Global APAC RPA Market Revenue Million Forecast, by Country 2019 & 2032
- Table 37: Turkey APAC RPA Market Revenue (Million) Forecast, by Application 2019 & 2032
- Table 38: Israel APAC RPA Market Revenue (Million) Forecast, by Application 2019 & 2032
- Table 39: GCC APAC RPA Market Revenue (Million) Forecast, by Application 2019 & 2032
- Table 40: North Africa APAC RPA Market Revenue (Million) Forecast, by Application 2019 & 2032
- Table 41: South Africa APAC RPA Market Revenue (Million) Forecast, by Application 2019 & 2032
- Table 42: Rest of Middle East & Africa APAC RPA Market Revenue (Million) Forecast, by Application 2019 & 2032
- Table 43: Global APAC RPA Market Revenue Million Forecast, by Solution 2019 & 2032
- Table 44: Global APAC RPA Market Revenue Million Forecast, by Size of Enterprise 2019 & 2032
- Table 45: Global APAC RPA Market Revenue Million Forecast, by End-user Industry 2019 & 2032
- Table 46: Global APAC RPA Market Revenue Million Forecast, by Country 2019 & 2032
- Table 47: China APAC RPA Market Revenue (Million) Forecast, by Application 2019 & 2032
- Table 48: India APAC RPA Market Revenue (Million) Forecast, by Application 2019 & 2032
- Table 49: Japan APAC RPA Market Revenue (Million) Forecast, by Application 2019 & 2032
- Table 50: South Korea APAC RPA Market Revenue (Million) Forecast, by Application 2019 & 2032
- Table 51: ASEAN APAC RPA Market Revenue (Million) Forecast, by Application 2019 & 2032
- Table 52: Oceania APAC RPA Market Revenue (Million) Forecast, by Application 2019 & 2032
- Table 53: Rest of Asia Pacific APAC RPA Market Revenue (Million) Forecast, by Application 2019 & 2032
Frequently Asked Questions
1. What is the projected Compound Annual Growth Rate (CAGR) of the APAC RPA Market?
The projected CAGR is approximately 34.80%.
2. Which companies are prominent players in the APAC RPA Market?
Key companies in the market include NTT Data Inc , Softomotive Ltd, Kofax Inc (Thoma Bravo LLC), Nice Ltd, HelpSystems LLC (HGGC), WorFusion Inc, UIPath Inc, Datamatics Global Services Limited, Automation Anywhere Inc, Pegasystems Inc, AutomationEdge Technologies Inc, Blue Prism Group PLC, AntWorks Pte Ltd, Kryon System Ltd.
3. What are the main segments of the APAC RPA Market?
The market segments include Solution, Size of Enterprise, End-user Industry.
4. Can you provide details about the market size?
The market size is estimated to be USD XX Million as of 2022.
5. What are some drivers contributing to market growth?
Reforms by Government and Localization of Documents. Support Systems. and Interfaces of various RPA Vendors; Increasing Need to Streamline Business Processes and Technological Advancements.
6. What are the notable trends driving market growth?
Mining Sector will Drive the Market Growth.
7. Are there any restraints impacting market growth?
Lack of Awareness About Workforce Analytics.
8. Can you provide examples of recent developments in the market?
October 2022: Blue Prism Group PLC and SS&C combined robotic process automation (RPA), business process management (BPM), AI, and No-code offerings to deliver a comprehensive intelligent automation suite, whereas supported by technologies such as Process Intelligence, AI/ML, and Intelligent Document Processing, the portfolio enables businesses to unify the workforce, transform customer, employee and user journeys and scale enterprise-wide.
9. What pricing options are available for accessing the report?
Pricing options include single-user, multi-user, and enterprise licenses priced at USD 4750, USD 4950, and USD 6800 respectively.
10. Is the market size provided in terms of value or volume?
The market size is provided in terms of value, measured in Million.
11. Are there any specific market keywords associated with the report?
Yes, the market keyword associated with the report is "APAC RPA Market," which aids in identifying and referencing the specific market segment covered.
12. How do I determine which pricing option suits my needs best?
The pricing options vary based on user requirements and access needs. Individual users may opt for single-user licenses, while businesses requiring broader access may choose multi-user or enterprise licenses for cost-effective access to the report.
13. Are there any additional resources or data provided in the APAC RPA Market report?
While the report offers comprehensive insights, it's advisable to review the specific contents or supplementary materials provided to ascertain if additional resources or data are available.
14. How can I stay updated on further developments or reports in the APAC RPA Market?
To stay informed about further developments, trends, and reports in the APAC RPA Market, consider subscribing to industry newsletters, following relevant companies and organizations, or regularly checking reputable industry news sources and publications.
Methodology
Step 1 - Identification of Relevant Samples Size from Population Database


Step 2 - Approaches for Defining Global Market Size (Value, Volume* & Price*)

Note*: In applicable scenarios
Step 3 - Data Sources
Primary Research
- Web Analytics
- Survey Reports
- Research Institute
- Latest Research Reports
- Opinion Leaders
Secondary Research
- Annual Reports
- White Paper
- Latest Press Release
- Industry Association
- Paid Database
- Investor Presentations

Step 4 - Data Triangulation
Involves using different sources of information in order to increase the validity of a study
These sources are likely to be stakeholders in a program - participants, other researchers, program staff, other community members, and so on.
Then we put all data in single framework & apply various statistical tools to find out the dynamic on the market.
During the analysis stage, feedback from the stakeholder groups would be compared to determine areas of agreement as well as areas of divergence
