

Key Insights
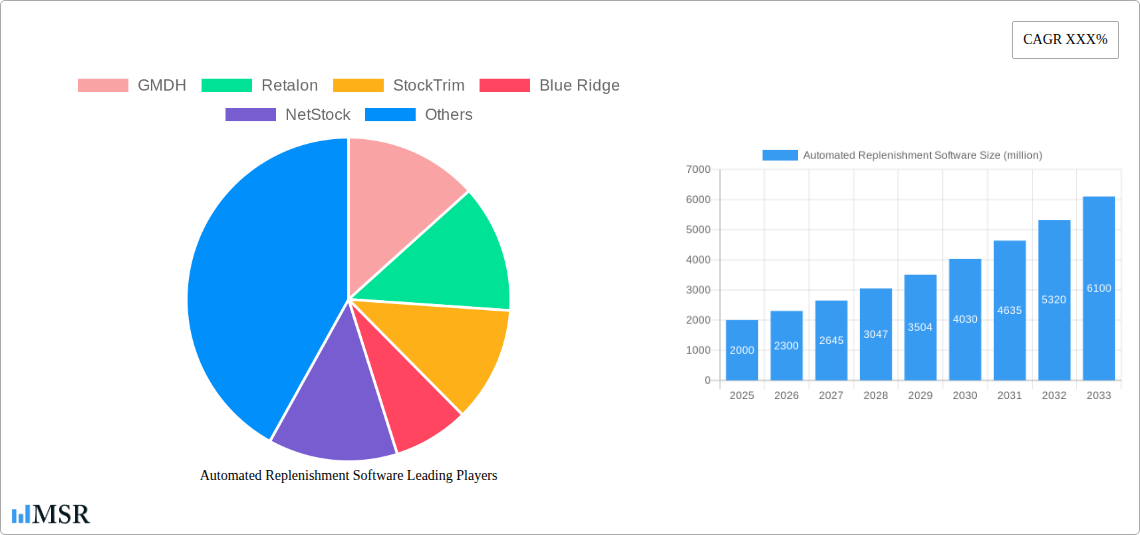
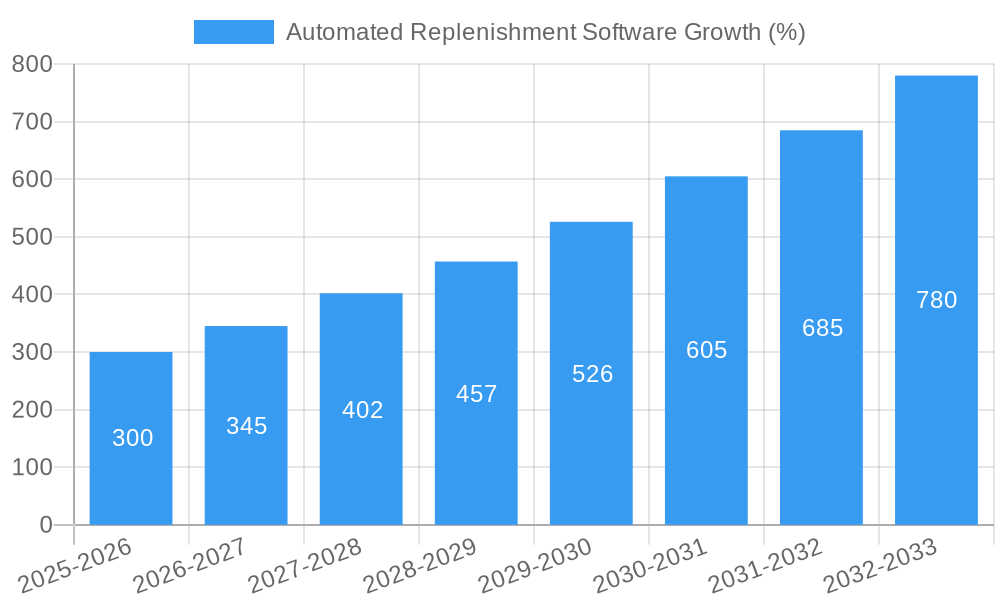
The automated replenishment software market is experiencing robust growth, driven by the increasing need for efficient inventory management and supply chain optimization across various industries. The market's expansion is fueled by several key factors, including the rising adoption of e-commerce, the growing demand for real-time inventory visibility, and the increasing pressure on businesses to reduce operational costs and improve customer satisfaction. Businesses are increasingly turning to automated replenishment solutions to optimize stock levels, minimize stockouts and overstocking, and improve forecasting accuracy. This allows for more efficient resource allocation, reduced warehousing costs, and streamlined order fulfillment processes. The competitive landscape is characterized by a mix of established players and emerging startups offering a range of solutions catering to different business sizes and needs, from sophisticated AI-driven systems to more basic inventory management tools. We estimate the market size in 2025 to be approximately $2 billion, growing at a compound annual growth rate (CAGR) of 15% from 2025-2033, reaching a projected $6 billion by 2033.
This significant market expansion is driven by the escalating demand for advanced analytics and predictive capabilities within automated replenishment systems. Companies are increasingly integrating these systems with other enterprise resource planning (ERP) and supply chain management (SCM) tools for seamless data flow and improved decision-making. Furthermore, the growing adoption of cloud-based solutions offers scalability and accessibility, attracting a broader range of businesses. However, challenges such as high initial investment costs, integration complexities, and the need for skilled personnel to manage and maintain these systems can act as potential restraints. The market is segmented by deployment model (cloud, on-premise), business size (small, medium, large enterprises), and industry vertical (retail, manufacturing, healthcare, etc.), each demonstrating unique growth trajectories. The leading vendors are continuously innovating to offer more comprehensive and user-friendly solutions to maintain their competitive edge in this rapidly evolving market.
Automated Replenishment Software Market Report: A Comprehensive Analysis (2019-2033)
This in-depth report provides a comprehensive analysis of the Automated Replenishment Software market, projecting a market value of $XX million by 2033. It examines market dynamics, leading players, technological advancements, and future growth opportunities, offering invaluable insights for industry stakeholders. The study period covers 2019-2033, with 2025 serving as both the base and estimated year. The forecast period spans 2025-2033, while the historical period encompasses 2019-2024. This report is crucial for businesses seeking to navigate this rapidly evolving market and capitalize on its immense potential.
Automated Replenishment Software Market Concentration & Dynamics
The Automated Replenishment Software market exhibits a moderately concentrated landscape, with a few key players holding significant market share. In 2025, the top 5 players – Blue Ridge, Oracle, RELEX, ToolsGroup, and NetStock – are estimated to collectively hold approximately 40% of the market. However, the market is witnessing increased competition from smaller, specialized vendors offering niche solutions.
Market Dynamics:
- Innovation Ecosystem: Significant investments in AI, machine learning, and cloud-based solutions are driving innovation.
- Regulatory Frameworks: Compliance with data privacy regulations (GDPR, CCPA) is influencing software development and data handling practices.
- Substitute Products: Manual inventory management systems and basic ERP functionalities act as substitutes, but their inefficiencies are driving adoption of automated solutions.
- End-User Trends: The increasing focus on supply chain optimization, inventory reduction, and improved customer satisfaction is bolstering market growth.
- M&A Activities: The number of mergers and acquisitions in the sector has increased in recent years, with approximately xx M&A deals recorded between 2019 and 2024, signaling market consolidation.
Automated Replenishment Software Industry Insights & Trends
The global Automated Replenishment Software market is experiencing robust growth, driven by several key factors. The market size reached an estimated $XX million in 2025 and is projected to reach $XX million by 2033, exhibiting a CAGR of xx%. Several factors contribute to this expansion:
- Technological Disruptions: The integration of AI and machine learning algorithms has significantly improved the accuracy and efficiency of automated replenishment systems. Cloud-based solutions offer scalability and accessibility, further driving adoption.
- Evolving Consumer Behaviors: The rise of e-commerce and omnichannel retailing has increased demand for efficient inventory management and timely fulfillment, boosting the demand for automated solutions.
- Market Growth Drivers: Increased focus on supply chain resilience, rising labor costs, and the need to reduce inventory holding costs are key market drivers. Businesses are recognizing the significant ROI associated with implementing automated replenishment software.
Key Markets & Segments Leading Automated Replenishment Software
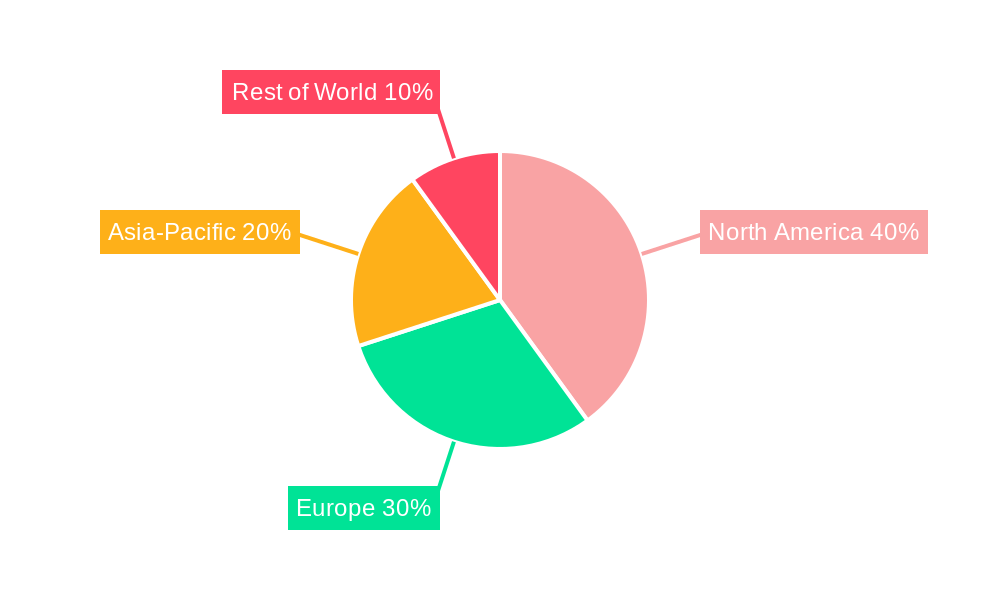
The North American region currently dominates the Automated Replenishment Software market, accounting for approximately xx% of the global market share in 2025. This dominance is attributed to several factors:
- Drivers:
- Strong economic growth and a mature retail landscape.
- Advanced technological infrastructure supporting software adoption.
- High awareness and adoption of advanced supply chain management practices.
- Dominance Analysis: North America's early adoption of advanced technologies, coupled with a higher concentration of large retail and manufacturing companies, has propelled its market leadership. The region's robust technology ecosystem and supportive regulatory environment also play a significant role. However, the Asia-Pacific region is expected to witness the fastest growth in the forecast period, driven by rapid e-commerce expansion and increasing industrialization.
Automated Replenishment Software Product Developments
Recent product innovations focus on enhanced AI capabilities for demand forecasting, improved integration with existing ERP and supply chain management systems, and the development of user-friendly interfaces. These advancements offer businesses greater accuracy in demand prediction, reduced operational costs, and improved supply chain visibility. The competitive edge lies in providing customized solutions tailored to specific industry requirements, offering superior analytics and reporting functionalities.
Challenges in the Automated Replenishment Software Market
Several challenges hinder market growth. These include the high initial investment costs associated with implementing the software, the need for skilled personnel to manage and maintain the systems, and concerns regarding data security and integration complexities. Furthermore, resistance to change within organizations and the lack of awareness about the benefits of automation in certain regions remain barriers. These factors, cumulatively, may represent a xx% impact on market growth during the forecast period.
Forces Driving Automated Replenishment Software Growth
Several factors are driving market growth:
- Technological Advancements: The integration of AI/ML and advanced analytics capabilities is enhancing the accuracy and efficiency of replenishment processes.
- Economic Factors: The increasing pressure to reduce costs and improve operational efficiency is driving adoption.
- Regulatory Pressures: Compliance requirements and industry standards are pushing businesses to adopt better inventory management practices.
Long-Term Growth Catalysts in the Automated Replenishment Software Market
Long-term growth is fueled by continued innovation in AI and machine learning, strategic partnerships between software vendors and supply chain solution providers, and expansion into new markets, particularly in developing economies with rapidly growing e-commerce sectors. The emergence of specialized solutions for specific industry verticals will also contribute to long-term growth.
Emerging Opportunities in Automated Replenishment Software
Emerging opportunities include the integration of automated replenishment software with IoT devices for real-time inventory tracking, the development of solutions tailored for the needs of small and medium-sized enterprises (SMEs), and expansion into emerging markets with high growth potential. The integration with blockchain technology for enhanced supply chain traceability also presents a lucrative opportunity.
Leading Players in the Automated Replenishment Software Sector
- GMDH
- Retalon
- StockTrim
- Blue Ridge
- NetStock
- Cogsy
- Lokad
- Flieber
- Solvoyo
- ThroughPut
- NTS Retail
- REMIRA
- EazyStock
- RELEX
- ToolsGroup
- Oracle
- Logility
- Megaventory
- LEAFIO
- Blue Yonder
- o9 Solutions
- eTurns
- Cadre
- Canary7
- Fountain9
- Advatix
Key Milestones in Automated Replenishment Software Industry
- 2020: Increased adoption of cloud-based solutions.
- 2021: Significant investments in AI and machine learning capabilities by major players.
- 2022: Launch of several new, specialized software solutions for specific industries (e.g., retail, manufacturing).
- 2023: Several key mergers and acquisitions consolidating the market.
- 2024: Growing focus on data security and compliance with data privacy regulations.
Strategic Outlook for Automated Replenishment Software Market
The Automated Replenishment Software market is poised for significant growth over the next decade. The continued integration of advanced technologies, strategic partnerships, and the expansion into new markets will create abundant opportunities for industry players. Companies that focus on innovation, customer-centric solutions, and robust data security will be best positioned to capitalize on the market's long-term potential.
Automated Replenishment Software Segmentation
-
1. Application
- 1.1. Retail
- 1.2. Manufacturing
- 1.3. E-commerce
- 1.4. Distribution and Logistics
- 1.5. Others
-
2. Type
- 2.1. On-premises
- 2.2. Cloud Based
Automated Replenishment Software Segmentation By Geography
-
1. North America
- 1.1. United States
- 1.2. Canada
- 1.3. Mexico
-
2. South America
- 2.1. Brazil
- 2.2. Argentina
- 2.3. Rest of South America
-
3. Europe
- 3.1. United Kingdom
- 3.2. Germany
- 3.3. France
- 3.4. Italy
- 3.5. Spain
- 3.6. Russia
- 3.7. Benelux
- 3.8. Nordics
- 3.9. Rest of Europe
-
4. Middle East & Africa
- 4.1. Turkey
- 4.2. Israel
- 4.3. GCC
- 4.4. North Africa
- 4.5. South Africa
- 4.6. Rest of Middle East & Africa
-
5. Asia Pacific
- 5.1. China
- 5.2. India
- 5.3. Japan
- 5.4. South Korea
- 5.5. ASEAN
- 5.6. Oceania
- 5.7. Rest of Asia Pacific
Automated Replenishment Software REPORT HIGHLIGHTS
| Aspects | Details |
|---|---|
| Study Period | 2019-2033 |
| Base Year | 2024 |
| Estimated Year | 2025 |
| Forecast Period | 2025-2033 |
| Historical Period | 2019-2024 |
| Growth Rate | CAGR of XXX% from 2019-2033 |
| Segmentation |
|
Table of Contents
- 1. Introduction
- 1.1. Research Scope
- 1.2. Market Segmentation
- 1.3. Research Methodology
- 1.4. Definitions and Assumptions
- 2. Executive Summary
- 2.1. Introduction
- 3. Market Dynamics
- 3.1. Introduction
- 3.2. Market Drivers
- 3.3. Market Restrains
- 3.4. Market Trends
- 4. Market Factor Analysis
- 4.1. Porters Five Forces
- 4.2. Supply/Value Chain
- 4.3. PESTEL analysis
- 4.4. Market Entropy
- 4.5. Patent/Trademark Analysis
- 5. Global Automated Replenishment Software Analysis, Insights and Forecast, 2019-2031
- 5.1. Market Analysis, Insights and Forecast - by Application
- 5.1.1. Retail
- 5.1.2. Manufacturing
- 5.1.3. E-commerce
- 5.1.4. Distribution and Logistics
- 5.1.5. Others
- 5.2. Market Analysis, Insights and Forecast - by Type
- 5.2.1. On-premises
- 5.2.2. Cloud Based
- 5.3. Market Analysis, Insights and Forecast - by Region
- 5.3.1. North America
- 5.3.2. South America
- 5.3.3. Europe
- 5.3.4. Middle East & Africa
- 5.3.5. Asia Pacific
- 5.1. Market Analysis, Insights and Forecast - by Application
- 6. North America Automated Replenishment Software Analysis, Insights and Forecast, 2019-2031
- 6.1. Market Analysis, Insights and Forecast - by Application
- 6.1.1. Retail
- 6.1.2. Manufacturing
- 6.1.3. E-commerce
- 6.1.4. Distribution and Logistics
- 6.1.5. Others
- 6.2. Market Analysis, Insights and Forecast - by Type
- 6.2.1. On-premises
- 6.2.2. Cloud Based
- 6.1. Market Analysis, Insights and Forecast - by Application
- 7. South America Automated Replenishment Software Analysis, Insights and Forecast, 2019-2031
- 7.1. Market Analysis, Insights and Forecast - by Application
- 7.1.1. Retail
- 7.1.2. Manufacturing
- 7.1.3. E-commerce
- 7.1.4. Distribution and Logistics
- 7.1.5. Others
- 7.2. Market Analysis, Insights and Forecast - by Type
- 7.2.1. On-premises
- 7.2.2. Cloud Based
- 7.1. Market Analysis, Insights and Forecast - by Application
- 8. Europe Automated Replenishment Software Analysis, Insights and Forecast, 2019-2031
- 8.1. Market Analysis, Insights and Forecast - by Application
- 8.1.1. Retail
- 8.1.2. Manufacturing
- 8.1.3. E-commerce
- 8.1.4. Distribution and Logistics
- 8.1.5. Others
- 8.2. Market Analysis, Insights and Forecast - by Type
- 8.2.1. On-premises
- 8.2.2. Cloud Based
- 8.1. Market Analysis, Insights and Forecast - by Application
- 9. Middle East & Africa Automated Replenishment Software Analysis, Insights and Forecast, 2019-2031
- 9.1. Market Analysis, Insights and Forecast - by Application
- 9.1.1. Retail
- 9.1.2. Manufacturing
- 9.1.3. E-commerce
- 9.1.4. Distribution and Logistics
- 9.1.5. Others
- 9.2. Market Analysis, Insights and Forecast - by Type
- 9.2.1. On-premises
- 9.2.2. Cloud Based
- 9.1. Market Analysis, Insights and Forecast - by Application
- 10. Asia Pacific Automated Replenishment Software Analysis, Insights and Forecast, 2019-2031
- 10.1. Market Analysis, Insights and Forecast - by Application
- 10.1.1. Retail
- 10.1.2. Manufacturing
- 10.1.3. E-commerce
- 10.1.4. Distribution and Logistics
- 10.1.5. Others
- 10.2. Market Analysis, Insights and Forecast - by Type
- 10.2.1. On-premises
- 10.2.2. Cloud Based
- 10.1. Market Analysis, Insights and Forecast - by Application
- 11. Competitive Analysis
- 11.1. Global Market Share Analysis 2024
- 11.2. Company Profiles
- 11.2.1 GMDH
- 11.2.1.1. Overview
- 11.2.1.2. Products
- 11.2.1.3. SWOT Analysis
- 11.2.1.4. Recent Developments
- 11.2.1.5. Financials (Based on Availability)
- 11.2.2 Retalon
- 11.2.2.1. Overview
- 11.2.2.2. Products
- 11.2.2.3. SWOT Analysis
- 11.2.2.4. Recent Developments
- 11.2.2.5. Financials (Based on Availability)
- 11.2.3 StockTrim
- 11.2.3.1. Overview
- 11.2.3.2. Products
- 11.2.3.3. SWOT Analysis
- 11.2.3.4. Recent Developments
- 11.2.3.5. Financials (Based on Availability)
- 11.2.4 Blue Ridge
- 11.2.4.1. Overview
- 11.2.4.2. Products
- 11.2.4.3. SWOT Analysis
- 11.2.4.4. Recent Developments
- 11.2.4.5. Financials (Based on Availability)
- 11.2.5 NetStock
- 11.2.5.1. Overview
- 11.2.5.2. Products
- 11.2.5.3. SWOT Analysis
- 11.2.5.4. Recent Developments
- 11.2.5.5. Financials (Based on Availability)
- 11.2.6 Cogsy
- 11.2.6.1. Overview
- 11.2.6.2. Products
- 11.2.6.3. SWOT Analysis
- 11.2.6.4. Recent Developments
- 11.2.6.5. Financials (Based on Availability)
- 11.2.7 Lokad
- 11.2.7.1. Overview
- 11.2.7.2. Products
- 11.2.7.3. SWOT Analysis
- 11.2.7.4. Recent Developments
- 11.2.7.5. Financials (Based on Availability)
- 11.2.8 Flieber
- 11.2.8.1. Overview
- 11.2.8.2. Products
- 11.2.8.3. SWOT Analysis
- 11.2.8.4. Recent Developments
- 11.2.8.5. Financials (Based on Availability)
- 11.2.9 Solvoyo
- 11.2.9.1. Overview
- 11.2.9.2. Products
- 11.2.9.3. SWOT Analysis
- 11.2.9.4. Recent Developments
- 11.2.9.5. Financials (Based on Availability)
- 11.2.10 ThroughPut
- 11.2.10.1. Overview
- 11.2.10.2. Products
- 11.2.10.3. SWOT Analysis
- 11.2.10.4. Recent Developments
- 11.2.10.5. Financials (Based on Availability)
- 11.2.11 NTS Retail
- 11.2.11.1. Overview
- 11.2.11.2. Products
- 11.2.11.3. SWOT Analysis
- 11.2.11.4. Recent Developments
- 11.2.11.5. Financials (Based on Availability)
- 11.2.12 REMIRA
- 11.2.12.1. Overview
- 11.2.12.2. Products
- 11.2.12.3. SWOT Analysis
- 11.2.12.4. Recent Developments
- 11.2.12.5. Financials (Based on Availability)
- 11.2.13 EazyStock
- 11.2.13.1. Overview
- 11.2.13.2. Products
- 11.2.13.3. SWOT Analysis
- 11.2.13.4. Recent Developments
- 11.2.13.5. Financials (Based on Availability)
- 11.2.14 RELEX
- 11.2.14.1. Overview
- 11.2.14.2. Products
- 11.2.14.3. SWOT Analysis
- 11.2.14.4. Recent Developments
- 11.2.14.5. Financials (Based on Availability)
- 11.2.15 ToolsGroup
- 11.2.15.1. Overview
- 11.2.15.2. Products
- 11.2.15.3. SWOT Analysis
- 11.2.15.4. Recent Developments
- 11.2.15.5. Financials (Based on Availability)
- 11.2.16 Oracle
- 11.2.16.1. Overview
- 11.2.16.2. Products
- 11.2.16.3. SWOT Analysis
- 11.2.16.4. Recent Developments
- 11.2.16.5. Financials (Based on Availability)
- 11.2.17 Logility
- 11.2.17.1. Overview
- 11.2.17.2. Products
- 11.2.17.3. SWOT Analysis
- 11.2.17.4. Recent Developments
- 11.2.17.5. Financials (Based on Availability)
- 11.2.18 Megaventory
- 11.2.18.1. Overview
- 11.2.18.2. Products
- 11.2.18.3. SWOT Analysis
- 11.2.18.4. Recent Developments
- 11.2.18.5. Financials (Based on Availability)
- 11.2.19 LEAFIO
- 11.2.19.1. Overview
- 11.2.19.2. Products
- 11.2.19.3. SWOT Analysis
- 11.2.19.4. Recent Developments
- 11.2.19.5. Financials (Based on Availability)
- 11.2.20 Blue Yonder
- 11.2.20.1. Overview
- 11.2.20.2. Products
- 11.2.20.3. SWOT Analysis
- 11.2.20.4. Recent Developments
- 11.2.20.5. Financials (Based on Availability)
- 11.2.21 o9 Solutions
- 11.2.21.1. Overview
- 11.2.21.2. Products
- 11.2.21.3. SWOT Analysis
- 11.2.21.4. Recent Developments
- 11.2.21.5. Financials (Based on Availability)
- 11.2.22 eTurns
- 11.2.22.1. Overview
- 11.2.22.2. Products
- 11.2.22.3. SWOT Analysis
- 11.2.22.4. Recent Developments
- 11.2.22.5. Financials (Based on Availability)
- 11.2.23 Cadre
- 11.2.23.1. Overview
- 11.2.23.2. Products
- 11.2.23.3. SWOT Analysis
- 11.2.23.4. Recent Developments
- 11.2.23.5. Financials (Based on Availability)
- 11.2.24 Canary7
- 11.2.24.1. Overview
- 11.2.24.2. Products
- 11.2.24.3. SWOT Analysis
- 11.2.24.4. Recent Developments
- 11.2.24.5. Financials (Based on Availability)
- 11.2.25 Fountain9
- 11.2.25.1. Overview
- 11.2.25.2. Products
- 11.2.25.3. SWOT Analysis
- 11.2.25.4. Recent Developments
- 11.2.25.5. Financials (Based on Availability)
- 11.2.26 Advatix
- 11.2.26.1. Overview
- 11.2.26.2. Products
- 11.2.26.3. SWOT Analysis
- 11.2.26.4. Recent Developments
- 11.2.26.5. Financials (Based on Availability)
- 11.2.1 GMDH
List of Figures
- Figure 1: Global Automated Replenishment Software Revenue Breakdown (million, %) by Region 2024 & 2032
- Figure 2: North America Automated Replenishment Software Revenue (million), by Application 2024 & 2032
- Figure 3: North America Automated Replenishment Software Revenue Share (%), by Application 2024 & 2032
- Figure 4: North America Automated Replenishment Software Revenue (million), by Type 2024 & 2032
- Figure 5: North America Automated Replenishment Software Revenue Share (%), by Type 2024 & 2032
- Figure 6: North America Automated Replenishment Software Revenue (million), by Country 2024 & 2032
- Figure 7: North America Automated Replenishment Software Revenue Share (%), by Country 2024 & 2032
- Figure 8: South America Automated Replenishment Software Revenue (million), by Application 2024 & 2032
- Figure 9: South America Automated Replenishment Software Revenue Share (%), by Application 2024 & 2032
- Figure 10: South America Automated Replenishment Software Revenue (million), by Type 2024 & 2032
- Figure 11: South America Automated Replenishment Software Revenue Share (%), by Type 2024 & 2032
- Figure 12: South America Automated Replenishment Software Revenue (million), by Country 2024 & 2032
- Figure 13: South America Automated Replenishment Software Revenue Share (%), by Country 2024 & 2032
- Figure 14: Europe Automated Replenishment Software Revenue (million), by Application 2024 & 2032
- Figure 15: Europe Automated Replenishment Software Revenue Share (%), by Application 2024 & 2032
- Figure 16: Europe Automated Replenishment Software Revenue (million), by Type 2024 & 2032
- Figure 17: Europe Automated Replenishment Software Revenue Share (%), by Type 2024 & 2032
- Figure 18: Europe Automated Replenishment Software Revenue (million), by Country 2024 & 2032
- Figure 19: Europe Automated Replenishment Software Revenue Share (%), by Country 2024 & 2032
- Figure 20: Middle East & Africa Automated Replenishment Software Revenue (million), by Application 2024 & 2032
- Figure 21: Middle East & Africa Automated Replenishment Software Revenue Share (%), by Application 2024 & 2032
- Figure 22: Middle East & Africa Automated Replenishment Software Revenue (million), by Type 2024 & 2032
- Figure 23: Middle East & Africa Automated Replenishment Software Revenue Share (%), by Type 2024 & 2032
- Figure 24: Middle East & Africa Automated Replenishment Software Revenue (million), by Country 2024 & 2032
- Figure 25: Middle East & Africa Automated Replenishment Software Revenue Share (%), by Country 2024 & 2032
- Figure 26: Asia Pacific Automated Replenishment Software Revenue (million), by Application 2024 & 2032
- Figure 27: Asia Pacific Automated Replenishment Software Revenue Share (%), by Application 2024 & 2032
- Figure 28: Asia Pacific Automated Replenishment Software Revenue (million), by Type 2024 & 2032
- Figure 29: Asia Pacific Automated Replenishment Software Revenue Share (%), by Type 2024 & 2032
- Figure 30: Asia Pacific Automated Replenishment Software Revenue (million), by Country 2024 & 2032
- Figure 31: Asia Pacific Automated Replenishment Software Revenue Share (%), by Country 2024 & 2032
List of Tables
- Table 1: Global Automated Replenishment Software Revenue million Forecast, by Region 2019 & 2032
- Table 2: Global Automated Replenishment Software Revenue million Forecast, by Application 2019 & 2032
- Table 3: Global Automated Replenishment Software Revenue million Forecast, by Type 2019 & 2032
- Table 4: Global Automated Replenishment Software Revenue million Forecast, by Region 2019 & 2032
- Table 5: Global Automated Replenishment Software Revenue million Forecast, by Application 2019 & 2032
- Table 6: Global Automated Replenishment Software Revenue million Forecast, by Type 2019 & 2032
- Table 7: Global Automated Replenishment Software Revenue million Forecast, by Country 2019 & 2032
- Table 8: United States Automated Replenishment Software Revenue (million) Forecast, by Application 2019 & 2032
- Table 9: Canada Automated Replenishment Software Revenue (million) Forecast, by Application 2019 & 2032
- Table 10: Mexico Automated Replenishment Software Revenue (million) Forecast, by Application 2019 & 2032
- Table 11: Global Automated Replenishment Software Revenue million Forecast, by Application 2019 & 2032
- Table 12: Global Automated Replenishment Software Revenue million Forecast, by Type 2019 & 2032
- Table 13: Global Automated Replenishment Software Revenue million Forecast, by Country 2019 & 2032
- Table 14: Brazil Automated Replenishment Software Revenue (million) Forecast, by Application 2019 & 2032
- Table 15: Argentina Automated Replenishment Software Revenue (million) Forecast, by Application 2019 & 2032
- Table 16: Rest of South America Automated Replenishment Software Revenue (million) Forecast, by Application 2019 & 2032
- Table 17: Global Automated Replenishment Software Revenue million Forecast, by Application 2019 & 2032
- Table 18: Global Automated Replenishment Software Revenue million Forecast, by Type 2019 & 2032
- Table 19: Global Automated Replenishment Software Revenue million Forecast, by Country 2019 & 2032
- Table 20: United Kingdom Automated Replenishment Software Revenue (million) Forecast, by Application 2019 & 2032
- Table 21: Germany Automated Replenishment Software Revenue (million) Forecast, by Application 2019 & 2032
- Table 22: France Automated Replenishment Software Revenue (million) Forecast, by Application 2019 & 2032
- Table 23: Italy Automated Replenishment Software Revenue (million) Forecast, by Application 2019 & 2032
- Table 24: Spain Automated Replenishment Software Revenue (million) Forecast, by Application 2019 & 2032
- Table 25: Russia Automated Replenishment Software Revenue (million) Forecast, by Application 2019 & 2032
- Table 26: Benelux Automated Replenishment Software Revenue (million) Forecast, by Application 2019 & 2032
- Table 27: Nordics Automated Replenishment Software Revenue (million) Forecast, by Application 2019 & 2032
- Table 28: Rest of Europe Automated Replenishment Software Revenue (million) Forecast, by Application 2019 & 2032
- Table 29: Global Automated Replenishment Software Revenue million Forecast, by Application 2019 & 2032
- Table 30: Global Automated Replenishment Software Revenue million Forecast, by Type 2019 & 2032
- Table 31: Global Automated Replenishment Software Revenue million Forecast, by Country 2019 & 2032
- Table 32: Turkey Automated Replenishment Software Revenue (million) Forecast, by Application 2019 & 2032
- Table 33: Israel Automated Replenishment Software Revenue (million) Forecast, by Application 2019 & 2032
- Table 34: GCC Automated Replenishment Software Revenue (million) Forecast, by Application 2019 & 2032
- Table 35: North Africa Automated Replenishment Software Revenue (million) Forecast, by Application 2019 & 2032
- Table 36: South Africa Automated Replenishment Software Revenue (million) Forecast, by Application 2019 & 2032
- Table 37: Rest of Middle East & Africa Automated Replenishment Software Revenue (million) Forecast, by Application 2019 & 2032
- Table 38: Global Automated Replenishment Software Revenue million Forecast, by Application 2019 & 2032
- Table 39: Global Automated Replenishment Software Revenue million Forecast, by Type 2019 & 2032
- Table 40: Global Automated Replenishment Software Revenue million Forecast, by Country 2019 & 2032
- Table 41: China Automated Replenishment Software Revenue (million) Forecast, by Application 2019 & 2032
- Table 42: India Automated Replenishment Software Revenue (million) Forecast, by Application 2019 & 2032
- Table 43: Japan Automated Replenishment Software Revenue (million) Forecast, by Application 2019 & 2032
- Table 44: South Korea Automated Replenishment Software Revenue (million) Forecast, by Application 2019 & 2032
- Table 45: ASEAN Automated Replenishment Software Revenue (million) Forecast, by Application 2019 & 2032
- Table 46: Oceania Automated Replenishment Software Revenue (million) Forecast, by Application 2019 & 2032
- Table 47: Rest of Asia Pacific Automated Replenishment Software Revenue (million) Forecast, by Application 2019 & 2032
Frequently Asked Questions
1. What is the projected Compound Annual Growth Rate (CAGR) of the Automated Replenishment Software?
The projected CAGR is approximately XXX%.
2. Which companies are prominent players in the Automated Replenishment Software?
Key companies in the market include GMDH, Retalon, StockTrim, Blue Ridge, NetStock, Cogsy, Lokad, Flieber, Solvoyo, ThroughPut, NTS Retail, REMIRA, EazyStock, RELEX, ToolsGroup, Oracle, Logility, Megaventory, LEAFIO, Blue Yonder, o9 Solutions, eTurns, Cadre, Canary7, Fountain9, Advatix.
3. What are the main segments of the Automated Replenishment Software?
The market segments include Application, Type.
4. Can you provide details about the market size?
The market size is estimated to be USD XXX million as of 2022.
5. What are some drivers contributing to market growth?
N/A
6. What are the notable trends driving market growth?
N/A
7. Are there any restraints impacting market growth?
N/A
8. Can you provide examples of recent developments in the market?
N/A
9. What pricing options are available for accessing the report?
Pricing options include single-user, multi-user, and enterprise licenses priced at USD 3950.00, USD 5925.00, and USD 7900.00 respectively.
10. Is the market size provided in terms of value or volume?
The market size is provided in terms of value, measured in million.
11. Are there any specific market keywords associated with the report?
Yes, the market keyword associated with the report is "Automated Replenishment Software," which aids in identifying and referencing the specific market segment covered.
12. How do I determine which pricing option suits my needs best?
The pricing options vary based on user requirements and access needs. Individual users may opt for single-user licenses, while businesses requiring broader access may choose multi-user or enterprise licenses for cost-effective access to the report.
13. Are there any additional resources or data provided in the Automated Replenishment Software report?
While the report offers comprehensive insights, it's advisable to review the specific contents or supplementary materials provided to ascertain if additional resources or data are available.
14. How can I stay updated on further developments or reports in the Automated Replenishment Software?
To stay informed about further developments, trends, and reports in the Automated Replenishment Software, consider subscribing to industry newsletters, following relevant companies and organizations, or regularly checking reputable industry news sources and publications.
Methodology
Step 1 - Identification of Relevant Samples Size from Population Database


Step 2 - Approaches for Defining Global Market Size (Value, Volume* & Price*)

Note*: In applicable scenarios
Step 3 - Data Sources
Primary Research
- Web Analytics
- Survey Reports
- Research Institute
- Latest Research Reports
- Opinion Leaders
Secondary Research
- Annual Reports
- White Paper
- Latest Press Release
- Industry Association
- Paid Database
- Investor Presentations

Step 4 - Data Triangulation
Involves using different sources of information in order to increase the validity of a study
These sources are likely to be stakeholders in a program - participants, other researchers, program staff, other community members, and so on.
Then we put all data in single framework & apply various statistical tools to find out the dynamic on the market.
During the analysis stage, feedback from the stakeholder groups would be compared to determine areas of agreement as well as areas of divergence
