

Key Insights
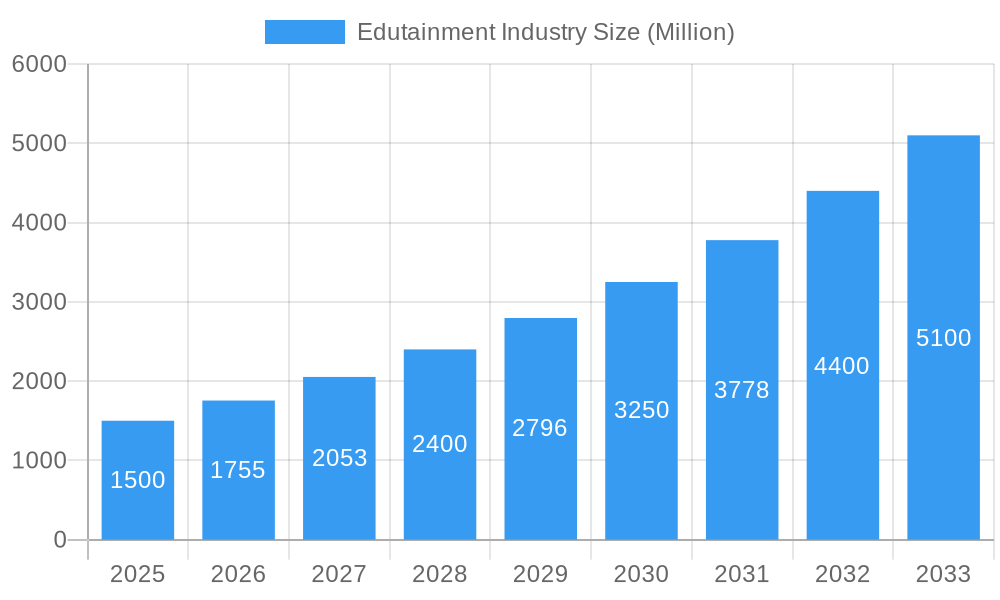
The global edutainment market is projected to reach $3 billion by 2025, expanding at a robust compound annual growth rate (CAGR) of 16.1%. This significant growth is propelled by a rising demand for engaging and interactive educational experiences for children, particularly in developing economies with increasing disposable incomes. Parents are actively seeking supplemental learning opportunities that blend education with entertainment, a need effectively met by edutainment centers. Technological innovations, including immersive virtual reality (VR) and augmented reality (AR) in edutainment venues, further fuel market dynamism. The market also benefits from the popularity of specialized edutainment parks and centers focused on specific subjects, contributing to its diversification.
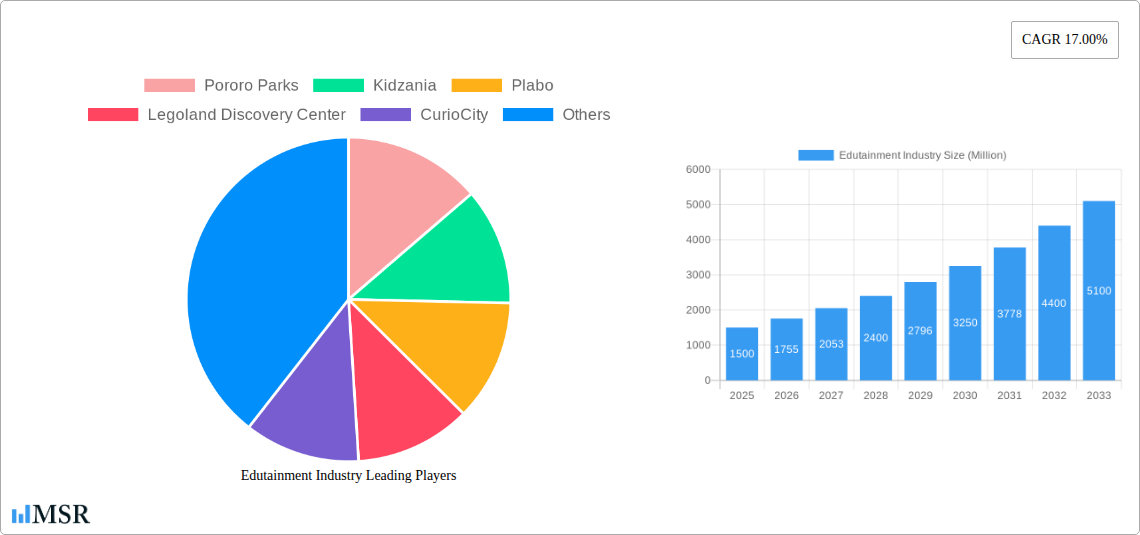
Edutainment Industry Market Size (In Billion)
Despite a positive long-term outlook driven by continuous innovation and demand for enriched learning, the edutainment market faces challenges. Economic downturns can reduce consumer discretionary spending, potentially impacting growth. Intense competition among established and emerging players necessitates ongoing adaptation and innovation. Balancing high-quality educational content with engaging entertainment is crucial for success. Regional consumer preferences and adherence to local educational standards and regulations also present market complexities.
Edutainment Industry Company Market Share
Unlock the Thriving Edutainment Market: A Comprehensive Report (2019-2033)
This comprehensive report delves into the dynamic Edutainment industry, offering invaluable insights for stakeholders seeking to capitalize on its explosive growth. With a study period spanning 2019-2033, a base year of 2025, and a forecast period of 2025-2033, this report provides a holistic view of the market, projecting a market size exceeding $XX Million by 2033, with a CAGR of XX%. The report meticulously analyzes market concentration, emerging trends, key players (including Pororo Parks, Kidzania, Plabo, Legoland Discovery Center, CurioCity, Kindercity, Mattel Play! Town, Totter's Otterville, Kidz Holding S A L, Little Explorers, ConveGenius, Grey Sim, Edsys, IdeaCrate Edutainment Company, and DreamUs Edutainment – list not exhaustive), and future opportunities.
Edutainment Industry Market Concentration & Dynamics
The global edutainment market exhibits moderate concentration, with a few major players holding significant market share. However, the landscape is dynamic, driven by continuous innovation and strategic mergers and acquisitions (M&A). Over the historical period (2019-2024), we observed approximately XX M&A deals, resulting in a shifting competitive landscape. Key factors influencing market dynamics include:
- Market Share: The top 5 players collectively account for approximately XX% of the global market share in 2025, with individual shares ranging from XX% to XX%.
- Innovation Ecosystems: A vibrant ecosystem of startups and established players fosters continuous product and service innovation, driving market growth.
- Regulatory Frameworks: Government regulations related to child safety and educational standards significantly influence market operations.
- Substitute Products: Traditional educational methods and other entertainment forms pose competitive challenges.
- End-User Trends: Growing parental awareness of the importance of experiential learning is a key growth driver.
- M&A Activities: Strategic acquisitions and mergers are reshaping the competitive landscape, leading to increased market consolidation.
Edutainment Industry Industry Insights & Trends
The global edutainment market is experiencing robust growth, driven by several key factors. The market size reached $XX Million in 2025 and is projected to surpass $XX Million by 2033. This growth is fueled by several key trends:
- Technological Disruptions: The integration of AR/VR, AI, and gamification is transforming the edutainment experience, making it more engaging and effective.
- Evolving Consumer Behaviors: Parents are increasingly seeking engaging and enriching experiences for their children, driving demand for high-quality edutainment products and services.
- Market Growth Drivers: Rising disposable incomes in developing economies, increasing awareness of the benefits of experiential learning, and government initiatives supporting educational programs contribute significantly to market expansion. Technological advancements enhance engagement and learning outcomes. The shift towards experiential learning and a growing preference for interactive and engaging educational tools fuel market expansion.
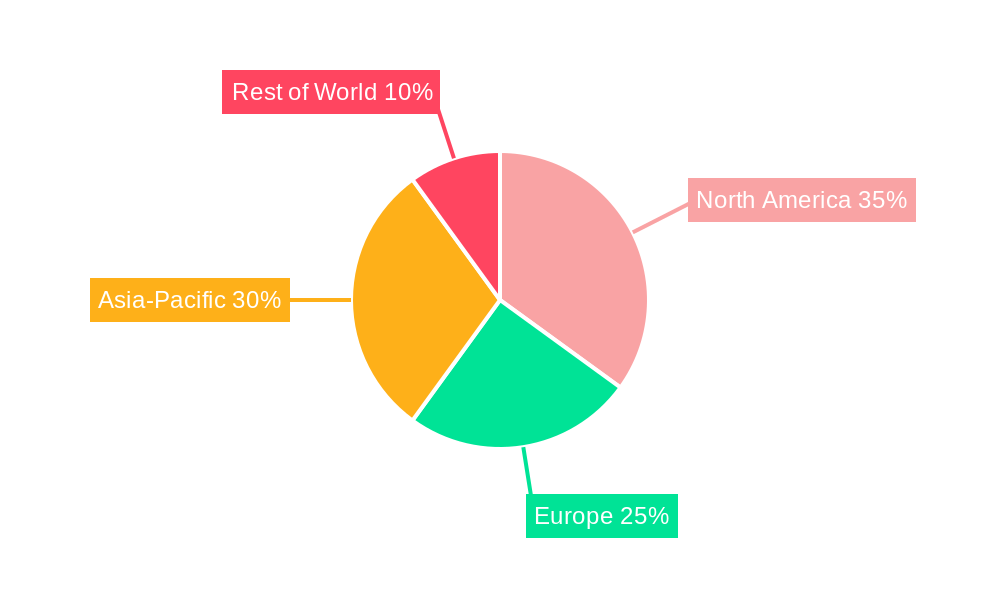
Key Markets & Segments Leading the Edutainment Industry
The Asia-Pacific region dominates the global edutainment market, accounting for approximately XX% of the total market value in 2025. This dominance is attributed to several factors:
- Drivers in Asia-Pacific:
- Rapid economic growth and rising disposable incomes.
- Expanding middle-class population with increased spending on children's education and entertainment.
- Favorable government policies supporting the edutainment sector.
- Significant investments in infrastructure development.
This region's substantial population and increasing disposable incomes, coupled with supportive government initiatives, create a fertile ground for the edutainment sector's growth. The robust infrastructure also facilitates the creation and operation of edutainment centers. While other regions such as North America and Europe also contribute significantly, the Asia-Pacific market exhibits superior growth prospects.
Edutainment Industry Product Developments
Recent years have witnessed significant advancements in edutainment products, integrating innovative technologies such as augmented reality (AR), virtual reality (VR), and gamification to enhance the learning experience. These technological advancements create more immersive and engaging edutainment offerings, fostering a competitive advantage. New product applications are constantly emerging, catering to diverse age groups and educational needs.
Challenges in the Edutainment Industry Market
The edutainment industry faces several significant challenges:
- Regulatory Hurdles: Stringent safety regulations and licensing requirements can pose operational challenges and increase costs.
- Supply Chain Issues: Global supply chain disruptions can impact the availability of raw materials and components, potentially affecting production and profitability.
- Competitive Pressures: Intense competition among established players and emerging startups necessitates continuous innovation and strategic differentiation. These factors collectively impact the industry's overall growth trajectory, demanding adaptive strategies from industry players.
Forces Driving Edutainment Industry Growth
Several factors contribute to the long-term growth of the edutainment industry:
- Technological Advancements: Continuous innovations in AR/VR, AI, and gamification create more engaging and effective learning experiences.
- Economic Growth: Rising disposable incomes in developing economies fuel demand for premium edutainment services.
- Supportive Government Policies: Government initiatives promoting early childhood education and experiential learning contribute to market expansion. The convergence of technology and education is a key driver.
Long-Term Growth Catalysts in the Edutainment Industry
Long-term growth will be fueled by strategic partnerships, expansion into new markets, and continued innovation in product development and delivery mechanisms. Investing in technology and fostering collaborations will be crucial for sustaining growth.
Emerging Opportunities in the Edutainment Industry
Significant opportunities exist in emerging markets and untapped segments. The integration of personalized learning experiences through AI and the expansion into online and hybrid edutainment platforms hold immense potential. Focusing on sustainability and ethical considerations will also be key.
Leading Players in the Edutainment Industry Sector
- Pororo Parks
- Kidzania
- Plabo
- Legoland Discovery Center
- CurioCity
- Kindercity
- Mattel Play! Town
- Totter's Otterville
- Kidz Holding S A L
- Little Explorers
- ConveGenius
- Grey Sim
- Edsys
- IdeaCrate Edutainment Company
- DreamUs Edutainment
Key Milestones in Edutainment Industry
- 2020: Increased adoption of digital edutainment platforms due to pandemic-related lockdowns.
- 2022: Launch of several innovative AR/VR-based edutainment products.
- 2023: Significant M&A activity consolidating the market landscape. (Specific examples of M&A deals would be added here in a full report)
Strategic Outlook for Edutainment Industry Market
The future of the edutainment market is bright, with immense potential for growth. Strategic investments in technology, expansion into new markets, and the development of innovative products will be key to capitalizing on emerging opportunities. Focusing on personalized learning and sustainable practices will be crucial for long-term success.
Edutainment Industry Segmentation
-
1. product type
- 1.1. Interactive
- 1.2. Non interactive
- 1.3. Hybrid
- 1.4. Explorative
-
2. end use age group
- 2.1. Children
- 2.2. Teenagers
- 2.3. Young Adult
-
3. region/ country
- 3.1. United States of America
- 3.2. Europe
- 3.3. China
- 3.4. Japan
- 3.5. South East Asia
- 3.6. India
- 3.7. Central and South America
Edutainment Industry Segmentation By Geography
-
1. North America
- 1.1. United States
- 1.2. Canada
- 1.3. Mexico
-
2. South America
- 2.1. Brazil
- 2.2. Argentina
- 2.3. Rest of South America
-
3. Europe
- 3.1. United Kingdom
- 3.2. Germany
- 3.3. France
- 3.4. Italy
- 3.5. Spain
- 3.6. Russia
- 3.7. Benelux
- 3.8. Nordics
- 3.9. Rest of Europe
-
4. Middle East & Africa
- 4.1. Turkey
- 4.2. Israel
- 4.3. GCC
- 4.4. North Africa
- 4.5. South Africa
- 4.6. Rest of Middle East & Africa
-
5. Asia Pacific
- 5.1. China
- 5.2. India
- 5.3. Japan
- 5.4. South Korea
- 5.5. ASEAN
- 5.6. Oceania
- 5.7. Rest of Asia Pacific
Edutainment Industry Regional Market Share
Geographic Coverage of Edutainment Industry
Edutainment Industry REPORT HIGHLIGHTS
| Aspects | Details |
|---|---|
| Study Period | 2020-2034 |
| Base Year | 2025 |
| Estimated Year | 2026 |
| Forecast Period | 2026-2034 |
| Historical Period | 2020-2025 |
| Growth Rate | CAGR of 16.1% from 2020-2034 |
| Segmentation |
|
Table of Contents
- 1. Introduction
- 1.1. Research Scope
- 1.2. Market Segmentation
- 1.3. Research Objective
- 1.4. Definitions and Assumptions
- 2. Executive Summary
- 2.1. Market Snapshot
- 3. Market Dynamics
- 3.1. Market Drivers
- 3.2. Market Restrains
- 3.3. Market Trends
- 3.4. Market Opportunities
- 4. Market Factor Analysis
- 4.1. Porters Five Forces
- 4.1.1. Bargaining Power of Suppliers
- 4.1.2. Bargaining Power of Buyers
- 4.1.3. Threat of New Entrants
- 4.1.4. Threat of Substitutes
- 4.1.5. Competitive Rivalry
- 4.2. PESTEL analysis
- 4.3. BCG Analysis
- 4.3.1. Stars (High Growth, High Market Share)
- 4.3.2. Cash Cows (Low Growth, High Market Share)
- 4.3.3. Question Mark (High Growth, Low Market Share)
- 4.3.4. Dogs (Low Growth, Low Market Share)
- 4.4. Ansoff Matrix Analysis
- 4.5. Supply Chain Analysis
- 4.6. Regulatory Landscape
- 4.7. Current Market Potential and Opportunity Assessment (TAM–SAM–SOM Framework)
- 4.8. MSR Analyst Note
- 4.1. Porters Five Forces
- 5. Market Analysis, Insights and Forecast 2021-2033
- 5.1. Market Analysis, Insights and Forecast - by product type
- 5.1.1. Interactive
- 5.1.2. Non interactive
- 5.1.3. Hybrid
- 5.1.4. Explorative
- 5.2. Market Analysis, Insights and Forecast - by end use age group
- 5.2.1. Children
- 5.2.2. Teenagers
- 5.2.3. Young Adult
- 5.3. Market Analysis, Insights and Forecast - by region/ country
- 5.3.1. United States of America
- 5.3.2. Europe
- 5.3.3. China
- 5.3.4. Japan
- 5.3.5. South East Asia
- 5.3.6. India
- 5.3.7. Central and South America
- 5.4. Market Analysis, Insights and Forecast - by Region
- 5.4.1. North America
- 5.4.2. South America
- 5.4.3. Europe
- 5.4.4. Middle East & Africa
- 5.4.5. Asia Pacific
- 5.1. Market Analysis, Insights and Forecast - by product type
- 6. Global Edutainment Industry Analysis, Insights and Forecast, 2021-2033
- 6.1. Market Analysis, Insights and Forecast - by product type
- 6.1.1. Interactive
- 6.1.2. Non interactive
- 6.1.3. Hybrid
- 6.1.4. Explorative
- 6.2. Market Analysis, Insights and Forecast - by end use age group
- 6.2.1. Children
- 6.2.2. Teenagers
- 6.2.3. Young Adult
- 6.3. Market Analysis, Insights and Forecast - by region/ country
- 6.3.1. United States of America
- 6.3.2. Europe
- 6.3.3. China
- 6.3.4. Japan
- 6.3.5. South East Asia
- 6.3.6. India
- 6.3.7. Central and South America
- 6.1. Market Analysis, Insights and Forecast - by product type
- 7. North America Edutainment Industry Analysis, Insights and Forecast, 2020-2032
- 7.1. Market Analysis, Insights and Forecast - by product type
- 7.1.1. Interactive
- 7.1.2. Non interactive
- 7.1.3. Hybrid
- 7.1.4. Explorative
- 7.2. Market Analysis, Insights and Forecast - by end use age group
- 7.2.1. Children
- 7.2.2. Teenagers
- 7.2.3. Young Adult
- 7.3. Market Analysis, Insights and Forecast - by region/ country
- 7.3.1. United States of America
- 7.3.2. Europe
- 7.3.3. China
- 7.3.4. Japan
- 7.3.5. South East Asia
- 7.3.6. India
- 7.3.7. Central and South America
- 7.1. Market Analysis, Insights and Forecast - by product type
- 8. South America Edutainment Industry Analysis, Insights and Forecast, 2020-2032
- 8.1. Market Analysis, Insights and Forecast - by product type
- 8.1.1. Interactive
- 8.1.2. Non interactive
- 8.1.3. Hybrid
- 8.1.4. Explorative
- 8.2. Market Analysis, Insights and Forecast - by end use age group
- 8.2.1. Children
- 8.2.2. Teenagers
- 8.2.3. Young Adult
- 8.3. Market Analysis, Insights and Forecast - by region/ country
- 8.3.1. United States of America
- 8.3.2. Europe
- 8.3.3. China
- 8.3.4. Japan
- 8.3.5. South East Asia
- 8.3.6. India
- 8.3.7. Central and South America
- 8.1. Market Analysis, Insights and Forecast - by product type
- 9. Europe Edutainment Industry Analysis, Insights and Forecast, 2020-2032
- 9.1. Market Analysis, Insights and Forecast - by product type
- 9.1.1. Interactive
- 9.1.2. Non interactive
- 9.1.3. Hybrid
- 9.1.4. Explorative
- 9.2. Market Analysis, Insights and Forecast - by end use age group
- 9.2.1. Children
- 9.2.2. Teenagers
- 9.2.3. Young Adult
- 9.3. Market Analysis, Insights and Forecast - by region/ country
- 9.3.1. United States of America
- 9.3.2. Europe
- 9.3.3. China
- 9.3.4. Japan
- 9.3.5. South East Asia
- 9.3.6. India
- 9.3.7. Central and South America
- 9.1. Market Analysis, Insights and Forecast - by product type
- 10. Middle East & Africa Edutainment Industry Analysis, Insights and Forecast, 2020-2032
- 10.1. Market Analysis, Insights and Forecast - by product type
- 10.1.1. Interactive
- 10.1.2. Non interactive
- 10.1.3. Hybrid
- 10.1.4. Explorative
- 10.2. Market Analysis, Insights and Forecast - by end use age group
- 10.2.1. Children
- 10.2.2. Teenagers
- 10.2.3. Young Adult
- 10.3. Market Analysis, Insights and Forecast - by region/ country
- 10.3.1. United States of America
- 10.3.2. Europe
- 10.3.3. China
- 10.3.4. Japan
- 10.3.5. South East Asia
- 10.3.6. India
- 10.3.7. Central and South America
- 10.1. Market Analysis, Insights and Forecast - by product type
- 11. Asia Pacific Edutainment Industry Analysis, Insights and Forecast, 2020-2032
- 11.1. Market Analysis, Insights and Forecast - by product type
- 11.1.1. Interactive
- 11.1.2. Non interactive
- 11.1.3. Hybrid
- 11.1.4. Explorative
- 11.2. Market Analysis, Insights and Forecast - by end use age group
- 11.2.1. Children
- 11.2.2. Teenagers
- 11.2.3. Young Adult
- 11.3. Market Analysis, Insights and Forecast - by region/ country
- 11.3.1. United States of America
- 11.3.2. Europe
- 11.3.3. China
- 11.3.4. Japan
- 11.3.5. South East Asia
- 11.3.6. India
- 11.3.7. Central and South America
- 11.1. Market Analysis, Insights and Forecast - by product type
- 12. Competitive Analysis
- 12.1. Company Profiles
- 12.1.1 Pororo Parks
- 12.1.1.1. Company Overview
- 12.1.1.2. Products
- 12.1.1.3. Company Financials
- 12.1.1.4. SWOT Analysis
- 12.1.2 Kidzania
- 12.1.2.1. Company Overview
- 12.1.2.2. Products
- 12.1.2.3. Company Financials
- 12.1.2.4. SWOT Analysis
- 12.1.3 Plabo
- 12.1.3.1. Company Overview
- 12.1.3.2. Products
- 12.1.3.3. Company Financials
- 12.1.3.4. SWOT Analysis
- 12.1.4 Legoland Discovery Center
- 12.1.4.1. Company Overview
- 12.1.4.2. Products
- 12.1.4.3. Company Financials
- 12.1.4.4. SWOT Analysis
- 12.1.5 CurioCity
- 12.1.5.1. Company Overview
- 12.1.5.2. Products
- 12.1.5.3. Company Financials
- 12.1.5.4. SWOT Analysis
- 12.1.6 Kindercity
- 12.1.6.1. Company Overview
- 12.1.6.2. Products
- 12.1.6.3. Company Financials
- 12.1.6.4. SWOT Analysis
- 12.1.7 Mattel Play! Town
- 12.1.7.1. Company Overview
- 12.1.7.2. Products
- 12.1.7.3. Company Financials
- 12.1.7.4. SWOT Analysis
- 12.1.8 Totter's Otterville
- 12.1.8.1. Company Overview
- 12.1.8.2. Products
- 12.1.8.3. Company Financials
- 12.1.8.4. SWOT Analysis
- 12.1.9 Kidz Holding S A L
- 12.1.9.1. Company Overview
- 12.1.9.2. Products
- 12.1.9.3. Company Financials
- 12.1.9.4. SWOT Analysis
- 12.1.10 Little Explorers
- 12.1.10.1. Company Overview
- 12.1.10.2. Products
- 12.1.10.3. Company Financials
- 12.1.10.4. SWOT Analysis
- 12.1.11 ConveGenius
- 12.1.11.1. Company Overview
- 12.1.11.2. Products
- 12.1.11.3. Company Financials
- 12.1.11.4. SWOT Analysis
- 12.1.12 Grey Sim
- 12.1.12.1. Company Overview
- 12.1.12.2. Products
- 12.1.12.3. Company Financials
- 12.1.12.4. SWOT Analysis
- 12.1.13 Edsys
- 12.1.13.1. Company Overview
- 12.1.13.2. Products
- 12.1.13.3. Company Financials
- 12.1.13.4. SWOT Analysis
- 12.1.14 IdeaCrate Edutainment Company
- 12.1.14.1. Company Overview
- 12.1.14.2. Products
- 12.1.14.3. Company Financials
- 12.1.14.4. SWOT Analysis
- 12.1.15 DreamUs Edutainment*List Not Exhaustive
- 12.1.15.1. Company Overview
- 12.1.15.2. Products
- 12.1.15.3. Company Financials
- 12.1.15.4. SWOT Analysis
- 12.1.1 Pororo Parks
- 12.2. Market Entropy
- 12.2.1 Company's Key Areas Served
- 12.2.2 Recent Developments
- 12.3. Company Market Share Analysis 2025
- 12.3.1 Top 5 Companies Market Share Analysis
- 12.3.2 Top 3 Companies Market Share Analysis
- 12.4. List of Potential Customers
- 13. Research Methodology
List of Figures
- Figure 1: Global Edutainment Industry Revenue Breakdown (billion, %) by Region 2025 & 2033
- Figure 2: North America Edutainment Industry Revenue (billion), by product type 2025 & 2033
- Figure 3: North America Edutainment Industry Revenue Share (%), by product type 2025 & 2033
- Figure 4: North America Edutainment Industry Revenue (billion), by end use age group 2025 & 2033
- Figure 5: North America Edutainment Industry Revenue Share (%), by end use age group 2025 & 2033
- Figure 6: North America Edutainment Industry Revenue (billion), by region/ country 2025 & 2033
- Figure 7: North America Edutainment Industry Revenue Share (%), by region/ country 2025 & 2033
- Figure 8: North America Edutainment Industry Revenue (billion), by Country 2025 & 2033
- Figure 9: North America Edutainment Industry Revenue Share (%), by Country 2025 & 2033
- Figure 10: South America Edutainment Industry Revenue (billion), by product type 2025 & 2033
- Figure 11: South America Edutainment Industry Revenue Share (%), by product type 2025 & 2033
- Figure 12: South America Edutainment Industry Revenue (billion), by end use age group 2025 & 2033
- Figure 13: South America Edutainment Industry Revenue Share (%), by end use age group 2025 & 2033
- Figure 14: South America Edutainment Industry Revenue (billion), by region/ country 2025 & 2033
- Figure 15: South America Edutainment Industry Revenue Share (%), by region/ country 2025 & 2033
- Figure 16: South America Edutainment Industry Revenue (billion), by Country 2025 & 2033
- Figure 17: South America Edutainment Industry Revenue Share (%), by Country 2025 & 2033
- Figure 18: Europe Edutainment Industry Revenue (billion), by product type 2025 & 2033
- Figure 19: Europe Edutainment Industry Revenue Share (%), by product type 2025 & 2033
- Figure 20: Europe Edutainment Industry Revenue (billion), by end use age group 2025 & 2033
- Figure 21: Europe Edutainment Industry Revenue Share (%), by end use age group 2025 & 2033
- Figure 22: Europe Edutainment Industry Revenue (billion), by region/ country 2025 & 2033
- Figure 23: Europe Edutainment Industry Revenue Share (%), by region/ country 2025 & 2033
- Figure 24: Europe Edutainment Industry Revenue (billion), by Country 2025 & 2033
- Figure 25: Europe Edutainment Industry Revenue Share (%), by Country 2025 & 2033
- Figure 26: Middle East & Africa Edutainment Industry Revenue (billion), by product type 2025 & 2033
- Figure 27: Middle East & Africa Edutainment Industry Revenue Share (%), by product type 2025 & 2033
- Figure 28: Middle East & Africa Edutainment Industry Revenue (billion), by end use age group 2025 & 2033
- Figure 29: Middle East & Africa Edutainment Industry Revenue Share (%), by end use age group 2025 & 2033
- Figure 30: Middle East & Africa Edutainment Industry Revenue (billion), by region/ country 2025 & 2033
- Figure 31: Middle East & Africa Edutainment Industry Revenue Share (%), by region/ country 2025 & 2033
- Figure 32: Middle East & Africa Edutainment Industry Revenue (billion), by Country 2025 & 2033
- Figure 33: Middle East & Africa Edutainment Industry Revenue Share (%), by Country 2025 & 2033
- Figure 34: Asia Pacific Edutainment Industry Revenue (billion), by product type 2025 & 2033
- Figure 35: Asia Pacific Edutainment Industry Revenue Share (%), by product type 2025 & 2033
- Figure 36: Asia Pacific Edutainment Industry Revenue (billion), by end use age group 2025 & 2033
- Figure 37: Asia Pacific Edutainment Industry Revenue Share (%), by end use age group 2025 & 2033
- Figure 38: Asia Pacific Edutainment Industry Revenue (billion), by region/ country 2025 & 2033
- Figure 39: Asia Pacific Edutainment Industry Revenue Share (%), by region/ country 2025 & 2033
- Figure 40: Asia Pacific Edutainment Industry Revenue (billion), by Country 2025 & 2033
- Figure 41: Asia Pacific Edutainment Industry Revenue Share (%), by Country 2025 & 2033
List of Tables
- Table 1: Global Edutainment Industry Revenue billion Forecast, by product type 2020 & 2033
- Table 2: Global Edutainment Industry Revenue billion Forecast, by end use age group 2020 & 2033
- Table 3: Global Edutainment Industry Revenue billion Forecast, by region/ country 2020 & 2033
- Table 4: Global Edutainment Industry Revenue billion Forecast, by Region 2020 & 2033
- Table 5: Global Edutainment Industry Revenue billion Forecast, by product type 2020 & 2033
- Table 6: Global Edutainment Industry Revenue billion Forecast, by end use age group 2020 & 2033
- Table 7: Global Edutainment Industry Revenue billion Forecast, by region/ country 2020 & 2033
- Table 8: Global Edutainment Industry Revenue billion Forecast, by Country 2020 & 2033
- Table 9: United States Edutainment Industry Revenue (billion) Forecast, by Application 2020 & 2033
- Table 10: Canada Edutainment Industry Revenue (billion) Forecast, by Application 2020 & 2033
- Table 11: Mexico Edutainment Industry Revenue (billion) Forecast, by Application 2020 & 2033
- Table 12: Global Edutainment Industry Revenue billion Forecast, by product type 2020 & 2033
- Table 13: Global Edutainment Industry Revenue billion Forecast, by end use age group 2020 & 2033
- Table 14: Global Edutainment Industry Revenue billion Forecast, by region/ country 2020 & 2033
- Table 15: Global Edutainment Industry Revenue billion Forecast, by Country 2020 & 2033
- Table 16: Brazil Edutainment Industry Revenue (billion) Forecast, by Application 2020 & 2033
- Table 17: Argentina Edutainment Industry Revenue (billion) Forecast, by Application 2020 & 2033
- Table 18: Rest of South America Edutainment Industry Revenue (billion) Forecast, by Application 2020 & 2033
- Table 19: Global Edutainment Industry Revenue billion Forecast, by product type 2020 & 2033
- Table 20: Global Edutainment Industry Revenue billion Forecast, by end use age group 2020 & 2033
- Table 21: Global Edutainment Industry Revenue billion Forecast, by region/ country 2020 & 2033
- Table 22: Global Edutainment Industry Revenue billion Forecast, by Country 2020 & 2033
- Table 23: United Kingdom Edutainment Industry Revenue (billion) Forecast, by Application 2020 & 2033
- Table 24: Germany Edutainment Industry Revenue (billion) Forecast, by Application 2020 & 2033
- Table 25: France Edutainment Industry Revenue (billion) Forecast, by Application 2020 & 2033
- Table 26: Italy Edutainment Industry Revenue (billion) Forecast, by Application 2020 & 2033
- Table 27: Spain Edutainment Industry Revenue (billion) Forecast, by Application 2020 & 2033
- Table 28: Russia Edutainment Industry Revenue (billion) Forecast, by Application 2020 & 2033
- Table 29: Benelux Edutainment Industry Revenue (billion) Forecast, by Application 2020 & 2033
- Table 30: Nordics Edutainment Industry Revenue (billion) Forecast, by Application 2020 & 2033
- Table 31: Rest of Europe Edutainment Industry Revenue (billion) Forecast, by Application 2020 & 2033
- Table 32: Global Edutainment Industry Revenue billion Forecast, by product type 2020 & 2033
- Table 33: Global Edutainment Industry Revenue billion Forecast, by end use age group 2020 & 2033
- Table 34: Global Edutainment Industry Revenue billion Forecast, by region/ country 2020 & 2033
- Table 35: Global Edutainment Industry Revenue billion Forecast, by Country 2020 & 2033
- Table 36: Turkey Edutainment Industry Revenue (billion) Forecast, by Application 2020 & 2033
- Table 37: Israel Edutainment Industry Revenue (billion) Forecast, by Application 2020 & 2033
- Table 38: GCC Edutainment Industry Revenue (billion) Forecast, by Application 2020 & 2033
- Table 39: North Africa Edutainment Industry Revenue (billion) Forecast, by Application 2020 & 2033
- Table 40: South Africa Edutainment Industry Revenue (billion) Forecast, by Application 2020 & 2033
- Table 41: Rest of Middle East & Africa Edutainment Industry Revenue (billion) Forecast, by Application 2020 & 2033
- Table 42: Global Edutainment Industry Revenue billion Forecast, by product type 2020 & 2033
- Table 43: Global Edutainment Industry Revenue billion Forecast, by end use age group 2020 & 2033
- Table 44: Global Edutainment Industry Revenue billion Forecast, by region/ country 2020 & 2033
- Table 45: Global Edutainment Industry Revenue billion Forecast, by Country 2020 & 2033
- Table 46: China Edutainment Industry Revenue (billion) Forecast, by Application 2020 & 2033
- Table 47: India Edutainment Industry Revenue (billion) Forecast, by Application 2020 & 2033
- Table 48: Japan Edutainment Industry Revenue (billion) Forecast, by Application 2020 & 2033
- Table 49: South Korea Edutainment Industry Revenue (billion) Forecast, by Application 2020 & 2033
- Table 50: ASEAN Edutainment Industry Revenue (billion) Forecast, by Application 2020 & 2033
- Table 51: Oceania Edutainment Industry Revenue (billion) Forecast, by Application 2020 & 2033
- Table 52: Rest of Asia Pacific Edutainment Industry Revenue (billion) Forecast, by Application 2020 & 2033
Frequently Asked Questions
1. What is the projected Compound Annual Growth Rate (CAGR) of the Edutainment Industry?
The projected CAGR is approximately 16.1%.
2. Which companies are prominent players in the Edutainment Industry?
Key companies in the market include Pororo Parks, Kidzania, Plabo, Legoland Discovery Center, CurioCity, Kindercity, Mattel Play! Town, Totter's Otterville, Kidz Holding S A L, Little Explorers, ConveGenius, Grey Sim, Edsys, IdeaCrate Edutainment Company, DreamUs Edutainment*List Not Exhaustive.
3. What are the main segments of the Edutainment Industry?
The market segments include product type, end use age group, region/ country.
4. Can you provide details about the market size?
The market size is estimated to be USD 3 billion as of 2022.
5. What are some drivers contributing to market growth?
N/A
6. What are the notable trends driving market growth?
Technological Advancement Is Driving Edutech To Newer Heights.
7. Are there any restraints impacting market growth?
N/A
8. Can you provide examples of recent developments in the market?
N/A
9. What pricing options are available for accessing the report?
Pricing options include single-user, multi-user, and enterprise licenses priced at USD 4750, USD 4950, and USD 6800 respectively.
10. Is the market size provided in terms of value or volume?
The market size is provided in terms of value, measured in billion.
11. Are there any specific market keywords associated with the report?
Yes, the market keyword associated with the report is "Edutainment Industry," which aids in identifying and referencing the specific market segment covered.
12. How do I determine which pricing option suits my needs best?
The pricing options vary based on user requirements and access needs. Individual users may opt for single-user licenses, while businesses requiring broader access may choose multi-user or enterprise licenses for cost-effective access to the report.
13. Are there any additional resources or data provided in the Edutainment Industry report?
While the report offers comprehensive insights, it's advisable to review the specific contents or supplementary materials provided to ascertain if additional resources or data are available.
14. How can I stay updated on further developments or reports in the Edutainment Industry?
To stay informed about further developments, trends, and reports in the Edutainment Industry, consider subscribing to industry newsletters, following relevant companies and organizations, or regularly checking reputable industry news sources and publications.
Methodology
Step 1 - Identification of Relevant Samples Size from Population Database


Step 2 - Approaches for Defining Global Market Size (Value, Volume* & Price*)

Note*: In applicable scenarios
Step 3 - Data Sources
Primary Research
- Web Analytics
- Survey Reports
- Research Institute
- Latest Research Reports
- Opinion Leaders
Secondary Research
- Annual Reports
- White Paper
- Latest Press Release
- Industry Association
- Paid Database
- Investor Presentations

Step 4 - Data Triangulation
Involves using different sources of information in order to increase the validity of a study
These sources are likely to be stakeholders in a program - participants, other researchers, program staff, other community members, and so on.
Then we put all data in single framework & apply various statistical tools to find out the dynamic on the market.
During the analysis stage, feedback from the stakeholder groups would be compared to determine areas of agreement as well as areas of divergence