

Key Insights
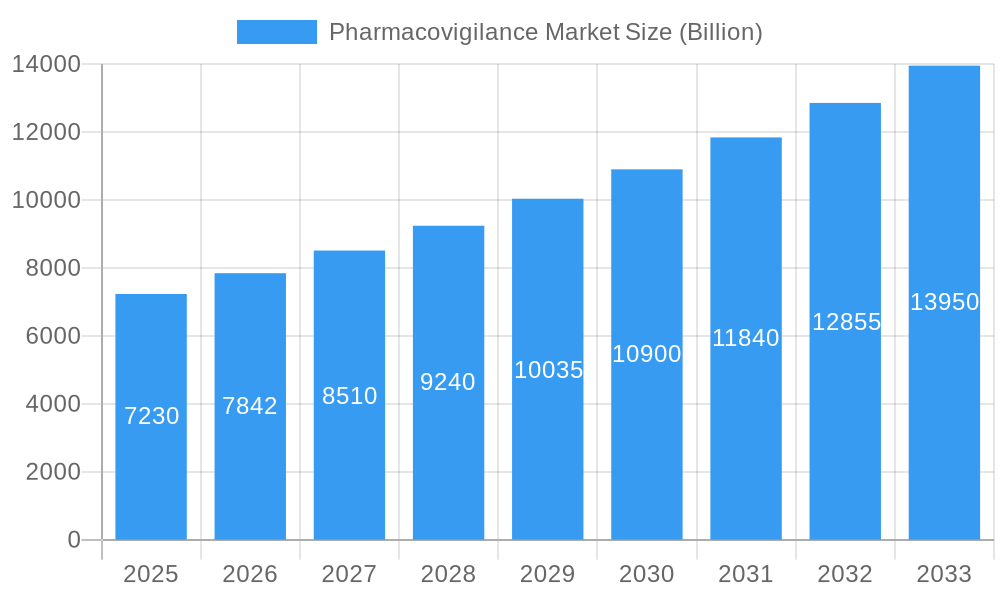
The global pharmacovigilance market, valued at $7.23 billion in 2025, is projected to experience robust growth, exhibiting a compound annual growth rate (CAGR) of 8.65% from 2025 to 2033. This expansion is fueled by several key factors. The increasing incidence of adverse drug reactions (ADRs), coupled with stricter regulatory scrutiny and a growing emphasis on patient safety, are driving the demand for comprehensive pharmacovigilance solutions. Technological advancements, such as the integration of artificial intelligence (AI) and machine learning (ML) in signal detection and risk assessment, are streamlining processes and enhancing the efficiency of pharmacovigilance activities. The rising adoption of electronic health records (EHRs) provides a rich data source for pharmacovigilance, further contributing to market growth. Furthermore, the outsourcing of pharmacovigilance services by pharmaceutical companies is gaining traction, owing to cost-effectiveness and access to specialized expertise. Growth is also being propelled by the expansion of clinical trials across various therapeutic areas, leading to a larger volume of safety data needing analysis and management.
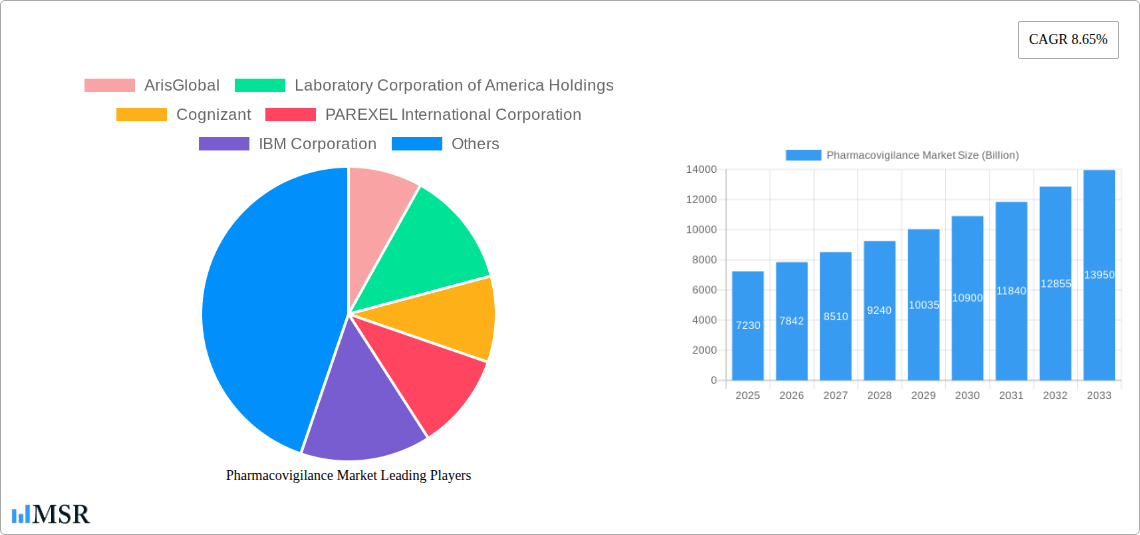
Pharmacovigilance Market Market Size (In Billion)
Segmentation analysis reveals significant opportunities across various end-users, including hospitals and pharmaceutical companies, and across different clinical trial phases. The contract outsourcing segment within service providers is experiencing rapid growth, indicating a shift towards leveraging external expertise in managing the complexities of pharmacovigilance. Geographically, North America and Europe currently dominate the market, but the Asia Pacific region is expected to witness significant growth due to increasing healthcare spending and regulatory reforms. While challenges such as data privacy concerns and the complexity of integrating data from various sources exist, the overall market outlook remains highly positive, driven by the increasing focus on patient safety and technological innovation. The market is expected to reach approximately $14.5 billion by 2033, based on the provided CAGR.
Pharmacovigilance Market Company Market Share
Pharmacovigilance Market Report: A Comprehensive Analysis (2019-2033)
This comprehensive report provides an in-depth analysis of the global Pharmacovigilance Market, projecting a market value exceeding $XX Billion by 2033. The study period covers 2019-2033, with 2025 serving as the base and estimated year. This report is invaluable for pharmaceutical companies, healthcare providers, technology vendors, and investors seeking to navigate this rapidly evolving landscape. Key market segments, leading players, and emerging trends are meticulously examined, offering actionable insights for strategic decision-making.
Pharmacovigilance Market Concentration & Dynamics
The Pharmacovigilance market exhibits a moderately concentrated landscape, with several key players holding significant market share. The market is characterized by ongoing innovation, driven by technological advancements in data analytics, AI, and cloud computing. Stringent regulatory frameworks, such as those enforced by the FDA and EMA, significantly influence market dynamics. Substitute products are limited, primarily due to the specialized nature of pharmacovigilance services. End-user trends are shifting towards increased adoption of outsourced services and advanced technologies to improve efficiency and compliance. Mergers and acquisitions (M&A) are frequent, reflecting the consolidation of the market and the pursuit of enhanced capabilities.
- Market Share: Top 5 players hold an estimated XX% of the market share in 2025.
- M&A Activity: An average of XX M&A deals were recorded annually during the historical period (2019-2024).
- Innovation Ecosystem: Significant investment in R&D for AI-driven solutions and big data analytics is driving innovation.
- Regulatory Landscape: Stringent regulations drive demand for compliant pharmacovigilance solutions.
Pharmacovigilance Market Industry Insights & Trends
The global Pharmacovigilance market is experiencing robust growth, fueled by factors such as increasing drug approvals, rising awareness of adverse drug reactions (ADRs), and the growing adoption of electronic health records (EHRs). Technological advancements, such as AI and machine learning, are transforming pharmacovigilance processes, leading to enhanced efficiency and improved detection of safety signals. The market size is estimated at $XX Billion in 2025, with a projected Compound Annual Growth Rate (CAGR) of XX% during the forecast period (2025-2033). Evolving consumer behaviors, including increased patient engagement and demand for transparency, are shaping the industry landscape. The increasing prevalence of chronic diseases further fuels market growth, necessitating robust pharmacovigilance systems.
Key Markets & Segments Leading Pharmacovigilance Market
The North American region currently dominates the Pharmacovigilance market, driven by robust healthcare infrastructure, high drug consumption rates, and stringent regulatory requirements. Within the market segments, pharmaceutical companies constitute the largest end-user group, followed by hospitals. Contract outsourcing is the preferred service model, with spontaneous reporting accounting for the largest share of reporting types.
Key Drivers:
- Economic Growth: Strong economic conditions in developed nations foster increased healthcare spending.
- Technological Advancements: AI and machine learning are driving efficiency and accuracy in ADR detection.
- Stringent Regulations: Compliance requirements incentivize investment in robust pharmacovigilance solutions.
Dominance Analysis:
Pharmaceutical companies are the leading end-users due to their critical role in post-market drug surveillance. The Contract Outsourcing segment dominates the service provider market due to its cost-effectiveness and access to specialized expertise. Spontaneous reporting remains the most prevalent reporting type due to its ease of implementation. Phase III and Phase IV clinical trials are crucial periods driving demand.
Pharmacovigilance Market Product Developments
Recent product innovations in the pharmacovigilance market include AI-powered signal detection systems, advanced data analytics platforms, and cloud-based solutions that enhance data management and collaboration. These advancements improve the efficiency and accuracy of ADR detection, leading to faster responses to safety concerns and reduced healthcare costs. This competitive landscape fosters continuous improvement and a drive towards innovative solutions offering superior capabilities.
Challenges in the Pharmacovigilance Market
The Pharmacovigilance market faces challenges such as stringent regulatory requirements, increasing data volume and complexity, and the need for data interoperability across different systems. Supply chain disruptions and competition from established players also pose significant hurdles. These challenges can lead to increased costs and delays in bringing new drugs to market.
Forces Driving Pharmacovigilance Market Growth
Technological advancements, particularly in AI and machine learning, are major drivers of market growth, enabling faster and more accurate identification of safety signals. Increasing government regulations mandating robust pharmacovigilance systems further propel market growth. Economic growth in developing economies is also increasing the adoption of pharmacovigilance technologies. The rising prevalence of chronic diseases demands comprehensive post-market surveillance.
Long-Term Growth Catalysts in Pharmacovigilance Market
Long-term growth in the pharmacovigilance market is poised to be driven by strategic partnerships between technology providers and pharmaceutical companies. This will result in the development of innovative solutions that leverage big data analytics and AI for improved efficiency and safety signal detection. Expansion into emerging markets with growing healthcare sectors presents further opportunities for market expansion.
Emerging Opportunities in Pharmacovigilance Market
Emerging opportunities lie in the increasing adoption of decentralized clinical trials (DCTs), which generate vast amounts of data requiring advanced pharmacovigilance solutions. The integration of real-world data (RWD) into pharmacovigilance processes offers opportunities for more comprehensive safety monitoring. Furthermore, advancements in wearable sensors and remote patient monitoring devices create new avenues for passive data collection, which significantly improves the effectiveness of pharmacovigilance efforts.
Leading Players in the Pharmacovigilance Market Sector
- ArisGlobal
- Laboratory Corporation of America Holdings
- Cognizant
- PAREXEL International Corporation
- IBM Corporation
- Wipro Ltd
- ICON PLC
- Accenture
- BioClinica
- Linical Accelovance
- IQVIA
- TAKE Solutions Ltd
- ITClinical
- Capgemini
- United BioSource Corporation
Key Milestones in Pharmacovigilance Market Industry
- February 2022: Cognizant partnered with Medable Inc. to deliver clinical research solutions for decentralized clinical trials, boosting the adoption of digital pharmacovigilance tools.
- February 2022: LINK Medical and Viedoc partnered to improve trial efficiency, highlighting the growing emphasis on collaborative efforts in pharmacovigilance.
Strategic Outlook for Pharmacovigilance Market
The future of the Pharmacovigilance market is bright, driven by continued technological advancements, increasing regulatory scrutiny, and a growing focus on patient safety. Companies that strategically invest in AI, machine learning, and data analytics will be well-positioned to capitalize on the market's growth potential. Strategic partnerships and collaborations will play a key role in shaping the future landscape. The market's potential is significant, with continued expansion anticipated across diverse segments and geographies.
Pharmacovigilance Market Segmentation
-
1. Clinical Trial Phase
- 1.1. Preclinical
- 1.2. Phase I
- 1.3. Phase II
- 1.4. Phase III
- 1.5. Phase IV
-
2. Service Provider
- 2.1. In-house
- 2.2. Contract Outsourcing
-
3. Type of Reporting
- 3.1. Spontaneous Reporting
- 3.2. Intensified ADR Reporting
- 3.3. Targeted Spontaneous Reporting
- 3.4. Cohort Event Monitoring
- 3.5. EHR Mining
-
4. End User
- 4.1. Hospitals
- 4.2. Pharmaceutical Companies
- 4.3. Other End Users
Pharmacovigilance Market Segmentation By Geography
-
1. North America
- 1.1. United States
- 1.2. Canada
- 1.3. Mexico
-
2. Europe
- 2.1. Germany
- 2.2. United Kingdom
- 2.3. France
- 2.4. Italy
- 2.5. Spain
- 2.6. Rest of Europe
-
3. Asia Pacific
- 3.1. China
- 3.2. Japan
- 3.3. India
- 3.4. Australia
- 3.5. South Korea
- 3.6. Rest of Asia Pacific
-
4. Middle East and Africa
- 4.1. GCC
- 4.2. South Africa
- 4.3. Rest of Middle East and Africa
-
5. South America
- 5.1. Brazil
- 5.2. Argentina
- 5.3. Rest of South America
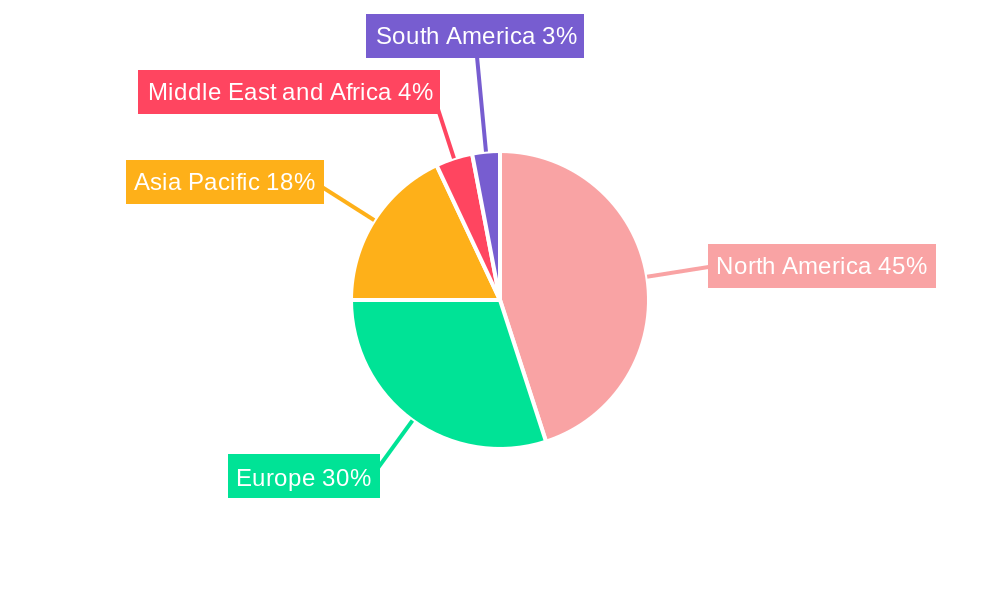
Pharmacovigilance Market Regional Market Share
Geographic Coverage of Pharmacovigilance Market
Pharmacovigilance Market REPORT HIGHLIGHTS
| Aspects | Details |
|---|---|
| Study Period | 2020-2034 |
| Base Year | 2025 |
| Estimated Year | 2026 |
| Forecast Period | 2026-2034 |
| Historical Period | 2020-2025 |
| Growth Rate | CAGR of 8.65% from 2020-2034 |
| Segmentation |
|
Table of Contents
- 1. Introduction
- 1.1. Research Scope
- 1.2. Market Segmentation
- 1.3. Research Objective
- 1.4. Definitions and Assumptions
- 2. Executive Summary
- 2.1. Market Snapshot
- 3. Market Dynamics
- 3.1. Market Drivers
- 3.2. Market Restrains
- 3.3. Market Trends
- 3.4. Market Opportunities
- 4. Market Factor Analysis
- 4.1. Porters Five Forces
- 4.1.1. Bargaining Power of Suppliers
- 4.1.2. Bargaining Power of Buyers
- 4.1.3. Threat of New Entrants
- 4.1.4. Threat of Substitutes
- 4.1.5. Competitive Rivalry
- 4.2. PESTEL analysis
- 4.3. BCG Analysis
- 4.3.1. Stars (High Growth, High Market Share)
- 4.3.2. Cash Cows (Low Growth, High Market Share)
- 4.3.3. Question Mark (High Growth, Low Market Share)
- 4.3.4. Dogs (Low Growth, Low Market Share)
- 4.4. Ansoff Matrix Analysis
- 4.5. Supply Chain Analysis
- 4.6. Regulatory Landscape
- 4.7. Current Market Potential and Opportunity Assessment (TAM–SAM–SOM Framework)
- 4.8. MSR Analyst Note
- 4.1. Porters Five Forces
- 5. Market Analysis, Insights and Forecast 2021-2033
- 5.1. Market Analysis, Insights and Forecast - by Clinical Trial Phase
- 5.1.1. Preclinical
- 5.1.2. Phase I
- 5.1.3. Phase II
- 5.1.4. Phase III
- 5.1.5. Phase IV
- 5.2. Market Analysis, Insights and Forecast - by Service Provider
- 5.2.1. In-house
- 5.2.2. Contract Outsourcing
- 5.3. Market Analysis, Insights and Forecast - by Type of Reporting
- 5.3.1. Spontaneous Reporting
- 5.3.2. Intensified ADR Reporting
- 5.3.3. Targeted Spontaneous Reporting
- 5.3.4. Cohort Event Monitoring
- 5.3.5. EHR Mining
- 5.4. Market Analysis, Insights and Forecast - by End User
- 5.4.1. Hospitals
- 5.4.2. Pharmaceutical Companies
- 5.4.3. Other End Users
- 5.5. Market Analysis, Insights and Forecast - by Region
- 5.5.1. North America
- 5.5.2. Europe
- 5.5.3. Asia Pacific
- 5.5.4. Middle East and Africa
- 5.5.5. South America
- 5.1. Market Analysis, Insights and Forecast - by Clinical Trial Phase
- 6. Global Pharmacovigilance Market Analysis, Insights and Forecast, 2021-2033
- 6.1. Market Analysis, Insights and Forecast - by Clinical Trial Phase
- 6.1.1. Preclinical
- 6.1.2. Phase I
- 6.1.3. Phase II
- 6.1.4. Phase III
- 6.1.5. Phase IV
- 6.2. Market Analysis, Insights and Forecast - by Service Provider
- 6.2.1. In-house
- 6.2.2. Contract Outsourcing
- 6.3. Market Analysis, Insights and Forecast - by Type of Reporting
- 6.3.1. Spontaneous Reporting
- 6.3.2. Intensified ADR Reporting
- 6.3.3. Targeted Spontaneous Reporting
- 6.3.4. Cohort Event Monitoring
- 6.3.5. EHR Mining
- 6.4. Market Analysis, Insights and Forecast - by End User
- 6.4.1. Hospitals
- 6.4.2. Pharmaceutical Companies
- 6.4.3. Other End Users
- 6.1. Market Analysis, Insights and Forecast - by Clinical Trial Phase
- 7. North America Pharmacovigilance Market Analysis, Insights and Forecast, 2020-2032
- 7.1. Market Analysis, Insights and Forecast - by Clinical Trial Phase
- 7.1.1. Preclinical
- 7.1.2. Phase I
- 7.1.3. Phase II
- 7.1.4. Phase III
- 7.1.5. Phase IV
- 7.2. Market Analysis, Insights and Forecast - by Service Provider
- 7.2.1. In-house
- 7.2.2. Contract Outsourcing
- 7.3. Market Analysis, Insights and Forecast - by Type of Reporting
- 7.3.1. Spontaneous Reporting
- 7.3.2. Intensified ADR Reporting
- 7.3.3. Targeted Spontaneous Reporting
- 7.3.4. Cohort Event Monitoring
- 7.3.5. EHR Mining
- 7.4. Market Analysis, Insights and Forecast - by End User
- 7.4.1. Hospitals
- 7.4.2. Pharmaceutical Companies
- 7.4.3. Other End Users
- 7.1. Market Analysis, Insights and Forecast - by Clinical Trial Phase
- 8. Europe Pharmacovigilance Market Analysis, Insights and Forecast, 2020-2032
- 8.1. Market Analysis, Insights and Forecast - by Clinical Trial Phase
- 8.1.1. Preclinical
- 8.1.2. Phase I
- 8.1.3. Phase II
- 8.1.4. Phase III
- 8.1.5. Phase IV
- 8.2. Market Analysis, Insights and Forecast - by Service Provider
- 8.2.1. In-house
- 8.2.2. Contract Outsourcing
- 8.3. Market Analysis, Insights and Forecast - by Type of Reporting
- 8.3.1. Spontaneous Reporting
- 8.3.2. Intensified ADR Reporting
- 8.3.3. Targeted Spontaneous Reporting
- 8.3.4. Cohort Event Monitoring
- 8.3.5. EHR Mining
- 8.4. Market Analysis, Insights and Forecast - by End User
- 8.4.1. Hospitals
- 8.4.2. Pharmaceutical Companies
- 8.4.3. Other End Users
- 8.1. Market Analysis, Insights and Forecast - by Clinical Trial Phase
- 9. Asia Pacific Pharmacovigilance Market Analysis, Insights and Forecast, 2020-2032
- 9.1. Market Analysis, Insights and Forecast - by Clinical Trial Phase
- 9.1.1. Preclinical
- 9.1.2. Phase I
- 9.1.3. Phase II
- 9.1.4. Phase III
- 9.1.5. Phase IV
- 9.2. Market Analysis, Insights and Forecast - by Service Provider
- 9.2.1. In-house
- 9.2.2. Contract Outsourcing
- 9.3. Market Analysis, Insights and Forecast - by Type of Reporting
- 9.3.1. Spontaneous Reporting
- 9.3.2. Intensified ADR Reporting
- 9.3.3. Targeted Spontaneous Reporting
- 9.3.4. Cohort Event Monitoring
- 9.3.5. EHR Mining
- 9.4. Market Analysis, Insights and Forecast - by End User
- 9.4.1. Hospitals
- 9.4.2. Pharmaceutical Companies
- 9.4.3. Other End Users
- 9.1. Market Analysis, Insights and Forecast - by Clinical Trial Phase
- 10. Middle East and Africa Pharmacovigilance Market Analysis, Insights and Forecast, 2020-2032
- 10.1. Market Analysis, Insights and Forecast - by Clinical Trial Phase
- 10.1.1. Preclinical
- 10.1.2. Phase I
- 10.1.3. Phase II
- 10.1.4. Phase III
- 10.1.5. Phase IV
- 10.2. Market Analysis, Insights and Forecast - by Service Provider
- 10.2.1. In-house
- 10.2.2. Contract Outsourcing
- 10.3. Market Analysis, Insights and Forecast - by Type of Reporting
- 10.3.1. Spontaneous Reporting
- 10.3.2. Intensified ADR Reporting
- 10.3.3. Targeted Spontaneous Reporting
- 10.3.4. Cohort Event Monitoring
- 10.3.5. EHR Mining
- 10.4. Market Analysis, Insights and Forecast - by End User
- 10.4.1. Hospitals
- 10.4.2. Pharmaceutical Companies
- 10.4.3. Other End Users
- 10.1. Market Analysis, Insights and Forecast - by Clinical Trial Phase
- 11. South America Pharmacovigilance Market Analysis, Insights and Forecast, 2020-2032
- 11.1. Market Analysis, Insights and Forecast - by Clinical Trial Phase
- 11.1.1. Preclinical
- 11.1.2. Phase I
- 11.1.3. Phase II
- 11.1.4. Phase III
- 11.1.5. Phase IV
- 11.2. Market Analysis, Insights and Forecast - by Service Provider
- 11.2.1. In-house
- 11.2.2. Contract Outsourcing
- 11.3. Market Analysis, Insights and Forecast - by Type of Reporting
- 11.3.1. Spontaneous Reporting
- 11.3.2. Intensified ADR Reporting
- 11.3.3. Targeted Spontaneous Reporting
- 11.3.4. Cohort Event Monitoring
- 11.3.5. EHR Mining
- 11.4. Market Analysis, Insights and Forecast - by End User
- 11.4.1. Hospitals
- 11.4.2. Pharmaceutical Companies
- 11.4.3. Other End Users
- 11.1. Market Analysis, Insights and Forecast - by Clinical Trial Phase
- 12. Competitive Analysis
- 12.1. Company Profiles
- 12.1.1 ArisGlobal
- 12.1.1.1. Company Overview
- 12.1.1.2. Products
- 12.1.1.3. Company Financials
- 12.1.1.4. SWOT Analysis
- 12.1.2 Laboratory Corporation of America Holdings
- 12.1.2.1. Company Overview
- 12.1.2.2. Products
- 12.1.2.3. Company Financials
- 12.1.2.4. SWOT Analysis
- 12.1.3 Cognizant
- 12.1.3.1. Company Overview
- 12.1.3.2. Products
- 12.1.3.3. Company Financials
- 12.1.3.4. SWOT Analysis
- 12.1.4 PAREXEL International Corporation
- 12.1.4.1. Company Overview
- 12.1.4.2. Products
- 12.1.4.3. Company Financials
- 12.1.4.4. SWOT Analysis
- 12.1.5 IBM Corporation
- 12.1.5.1. Company Overview
- 12.1.5.2. Products
- 12.1.5.3. Company Financials
- 12.1.5.4. SWOT Analysis
- 12.1.6 Wipro Ltd*List Not Exhaustive
- 12.1.6.1. Company Overview
- 12.1.6.2. Products
- 12.1.6.3. Company Financials
- 12.1.6.4. SWOT Analysis
- 12.1.7 ICON PLC
- 12.1.7.1. Company Overview
- 12.1.7.2. Products
- 12.1.7.3. Company Financials
- 12.1.7.4. SWOT Analysis
- 12.1.8 Accenture
- 12.1.8.1. Company Overview
- 12.1.8.2. Products
- 12.1.8.3. Company Financials
- 12.1.8.4. SWOT Analysis
- 12.1.9 BioClinica
- 12.1.9.1. Company Overview
- 12.1.9.2. Products
- 12.1.9.3. Company Financials
- 12.1.9.4. SWOT Analysis
- 12.1.10 Linical Accelovance
- 12.1.10.1. Company Overview
- 12.1.10.2. Products
- 12.1.10.3. Company Financials
- 12.1.10.4. SWOT Analysis
- 12.1.11 IQVIA
- 12.1.11.1. Company Overview
- 12.1.11.2. Products
- 12.1.11.3. Company Financials
- 12.1.11.4. SWOT Analysis
- 12.1.12 TAKE Solutions Ltd
- 12.1.12.1. Company Overview
- 12.1.12.2. Products
- 12.1.12.3. Company Financials
- 12.1.12.4. SWOT Analysis
- 12.1.13 ITClinical
- 12.1.13.1. Company Overview
- 12.1.13.2. Products
- 12.1.13.3. Company Financials
- 12.1.13.4. SWOT Analysis
- 12.1.14 Capgemini
- 12.1.14.1. Company Overview
- 12.1.14.2. Products
- 12.1.14.3. Company Financials
- 12.1.14.4. SWOT Analysis
- 12.1.15 United BioSource Corporation
- 12.1.15.1. Company Overview
- 12.1.15.2. Products
- 12.1.15.3. Company Financials
- 12.1.15.4. SWOT Analysis
- 12.1.1 ArisGlobal
- 12.2. Market Entropy
- 12.2.1 Company's Key Areas Served
- 12.2.2 Recent Developments
- 12.3. Company Market Share Analysis 2025
- 12.3.1 Top 5 Companies Market Share Analysis
- 12.3.2 Top 3 Companies Market Share Analysis
- 12.4. List of Potential Customers
- 13. Research Methodology
List of Figures
- Figure 1: Global Pharmacovigilance Market Revenue Breakdown (Billion, %) by Region 2025 & 2033
- Figure 2: North America Pharmacovigilance Market Revenue (Billion), by Clinical Trial Phase 2025 & 2033
- Figure 3: North America Pharmacovigilance Market Revenue Share (%), by Clinical Trial Phase 2025 & 2033
- Figure 4: North America Pharmacovigilance Market Revenue (Billion), by Service Provider 2025 & 2033
- Figure 5: North America Pharmacovigilance Market Revenue Share (%), by Service Provider 2025 & 2033
- Figure 6: North America Pharmacovigilance Market Revenue (Billion), by Type of Reporting 2025 & 2033
- Figure 7: North America Pharmacovigilance Market Revenue Share (%), by Type of Reporting 2025 & 2033
- Figure 8: North America Pharmacovigilance Market Revenue (Billion), by End User 2025 & 2033
- Figure 9: North America Pharmacovigilance Market Revenue Share (%), by End User 2025 & 2033
- Figure 10: North America Pharmacovigilance Market Revenue (Billion), by Country 2025 & 2033
- Figure 11: North America Pharmacovigilance Market Revenue Share (%), by Country 2025 & 2033
- Figure 12: Europe Pharmacovigilance Market Revenue (Billion), by Clinical Trial Phase 2025 & 2033
- Figure 13: Europe Pharmacovigilance Market Revenue Share (%), by Clinical Trial Phase 2025 & 2033
- Figure 14: Europe Pharmacovigilance Market Revenue (Billion), by Service Provider 2025 & 2033
- Figure 15: Europe Pharmacovigilance Market Revenue Share (%), by Service Provider 2025 & 2033
- Figure 16: Europe Pharmacovigilance Market Revenue (Billion), by Type of Reporting 2025 & 2033
- Figure 17: Europe Pharmacovigilance Market Revenue Share (%), by Type of Reporting 2025 & 2033
- Figure 18: Europe Pharmacovigilance Market Revenue (Billion), by End User 2025 & 2033
- Figure 19: Europe Pharmacovigilance Market Revenue Share (%), by End User 2025 & 2033
- Figure 20: Europe Pharmacovigilance Market Revenue (Billion), by Country 2025 & 2033
- Figure 21: Europe Pharmacovigilance Market Revenue Share (%), by Country 2025 & 2033
- Figure 22: Asia Pacific Pharmacovigilance Market Revenue (Billion), by Clinical Trial Phase 2025 & 2033
- Figure 23: Asia Pacific Pharmacovigilance Market Revenue Share (%), by Clinical Trial Phase 2025 & 2033
- Figure 24: Asia Pacific Pharmacovigilance Market Revenue (Billion), by Service Provider 2025 & 2033
- Figure 25: Asia Pacific Pharmacovigilance Market Revenue Share (%), by Service Provider 2025 & 2033
- Figure 26: Asia Pacific Pharmacovigilance Market Revenue (Billion), by Type of Reporting 2025 & 2033
- Figure 27: Asia Pacific Pharmacovigilance Market Revenue Share (%), by Type of Reporting 2025 & 2033
- Figure 28: Asia Pacific Pharmacovigilance Market Revenue (Billion), by End User 2025 & 2033
- Figure 29: Asia Pacific Pharmacovigilance Market Revenue Share (%), by End User 2025 & 2033
- Figure 30: Asia Pacific Pharmacovigilance Market Revenue (Billion), by Country 2025 & 2033
- Figure 31: Asia Pacific Pharmacovigilance Market Revenue Share (%), by Country 2025 & 2033
- Figure 32: Middle East and Africa Pharmacovigilance Market Revenue (Billion), by Clinical Trial Phase 2025 & 2033
- Figure 33: Middle East and Africa Pharmacovigilance Market Revenue Share (%), by Clinical Trial Phase 2025 & 2033
- Figure 34: Middle East and Africa Pharmacovigilance Market Revenue (Billion), by Service Provider 2025 & 2033
- Figure 35: Middle East and Africa Pharmacovigilance Market Revenue Share (%), by Service Provider 2025 & 2033
- Figure 36: Middle East and Africa Pharmacovigilance Market Revenue (Billion), by Type of Reporting 2025 & 2033
- Figure 37: Middle East and Africa Pharmacovigilance Market Revenue Share (%), by Type of Reporting 2025 & 2033
- Figure 38: Middle East and Africa Pharmacovigilance Market Revenue (Billion), by End User 2025 & 2033
- Figure 39: Middle East and Africa Pharmacovigilance Market Revenue Share (%), by End User 2025 & 2033
- Figure 40: Middle East and Africa Pharmacovigilance Market Revenue (Billion), by Country 2025 & 2033
- Figure 41: Middle East and Africa Pharmacovigilance Market Revenue Share (%), by Country 2025 & 2033
- Figure 42: South America Pharmacovigilance Market Revenue (Billion), by Clinical Trial Phase 2025 & 2033
- Figure 43: South America Pharmacovigilance Market Revenue Share (%), by Clinical Trial Phase 2025 & 2033
- Figure 44: South America Pharmacovigilance Market Revenue (Billion), by Service Provider 2025 & 2033
- Figure 45: South America Pharmacovigilance Market Revenue Share (%), by Service Provider 2025 & 2033
- Figure 46: South America Pharmacovigilance Market Revenue (Billion), by Type of Reporting 2025 & 2033
- Figure 47: South America Pharmacovigilance Market Revenue Share (%), by Type of Reporting 2025 & 2033
- Figure 48: South America Pharmacovigilance Market Revenue (Billion), by End User 2025 & 2033
- Figure 49: South America Pharmacovigilance Market Revenue Share (%), by End User 2025 & 2033
- Figure 50: South America Pharmacovigilance Market Revenue (Billion), by Country 2025 & 2033
- Figure 51: South America Pharmacovigilance Market Revenue Share (%), by Country 2025 & 2033
List of Tables
- Table 1: Global Pharmacovigilance Market Revenue Billion Forecast, by Clinical Trial Phase 2020 & 2033
- Table 2: Global Pharmacovigilance Market Revenue Billion Forecast, by Service Provider 2020 & 2033
- Table 3: Global Pharmacovigilance Market Revenue Billion Forecast, by Type of Reporting 2020 & 2033
- Table 4: Global Pharmacovigilance Market Revenue Billion Forecast, by End User 2020 & 2033
- Table 5: Global Pharmacovigilance Market Revenue Billion Forecast, by Region 2020 & 2033
- Table 6: Global Pharmacovigilance Market Revenue Billion Forecast, by Clinical Trial Phase 2020 & 2033
- Table 7: Global Pharmacovigilance Market Revenue Billion Forecast, by Service Provider 2020 & 2033
- Table 8: Global Pharmacovigilance Market Revenue Billion Forecast, by Type of Reporting 2020 & 2033
- Table 9: Global Pharmacovigilance Market Revenue Billion Forecast, by End User 2020 & 2033
- Table 10: Global Pharmacovigilance Market Revenue Billion Forecast, by Country 2020 & 2033
- Table 11: United States Pharmacovigilance Market Revenue (Billion) Forecast, by Application 2020 & 2033
- Table 12: Canada Pharmacovigilance Market Revenue (Billion) Forecast, by Application 2020 & 2033
- Table 13: Mexico Pharmacovigilance Market Revenue (Billion) Forecast, by Application 2020 & 2033
- Table 14: Global Pharmacovigilance Market Revenue Billion Forecast, by Clinical Trial Phase 2020 & 2033
- Table 15: Global Pharmacovigilance Market Revenue Billion Forecast, by Service Provider 2020 & 2033
- Table 16: Global Pharmacovigilance Market Revenue Billion Forecast, by Type of Reporting 2020 & 2033
- Table 17: Global Pharmacovigilance Market Revenue Billion Forecast, by End User 2020 & 2033
- Table 18: Global Pharmacovigilance Market Revenue Billion Forecast, by Country 2020 & 2033
- Table 19: Germany Pharmacovigilance Market Revenue (Billion) Forecast, by Application 2020 & 2033
- Table 20: United Kingdom Pharmacovigilance Market Revenue (Billion) Forecast, by Application 2020 & 2033
- Table 21: France Pharmacovigilance Market Revenue (Billion) Forecast, by Application 2020 & 2033
- Table 22: Italy Pharmacovigilance Market Revenue (Billion) Forecast, by Application 2020 & 2033
- Table 23: Spain Pharmacovigilance Market Revenue (Billion) Forecast, by Application 2020 & 2033
- Table 24: Rest of Europe Pharmacovigilance Market Revenue (Billion) Forecast, by Application 2020 & 2033
- Table 25: Global Pharmacovigilance Market Revenue Billion Forecast, by Clinical Trial Phase 2020 & 2033
- Table 26: Global Pharmacovigilance Market Revenue Billion Forecast, by Service Provider 2020 & 2033
- Table 27: Global Pharmacovigilance Market Revenue Billion Forecast, by Type of Reporting 2020 & 2033
- Table 28: Global Pharmacovigilance Market Revenue Billion Forecast, by End User 2020 & 2033
- Table 29: Global Pharmacovigilance Market Revenue Billion Forecast, by Country 2020 & 2033
- Table 30: China Pharmacovigilance Market Revenue (Billion) Forecast, by Application 2020 & 2033
- Table 31: Japan Pharmacovigilance Market Revenue (Billion) Forecast, by Application 2020 & 2033
- Table 32: India Pharmacovigilance Market Revenue (Billion) Forecast, by Application 2020 & 2033
- Table 33: Australia Pharmacovigilance Market Revenue (Billion) Forecast, by Application 2020 & 2033
- Table 34: South Korea Pharmacovigilance Market Revenue (Billion) Forecast, by Application 2020 & 2033
- Table 35: Rest of Asia Pacific Pharmacovigilance Market Revenue (Billion) Forecast, by Application 2020 & 2033
- Table 36: Global Pharmacovigilance Market Revenue Billion Forecast, by Clinical Trial Phase 2020 & 2033
- Table 37: Global Pharmacovigilance Market Revenue Billion Forecast, by Service Provider 2020 & 2033
- Table 38: Global Pharmacovigilance Market Revenue Billion Forecast, by Type of Reporting 2020 & 2033
- Table 39: Global Pharmacovigilance Market Revenue Billion Forecast, by End User 2020 & 2033
- Table 40: Global Pharmacovigilance Market Revenue Billion Forecast, by Country 2020 & 2033
- Table 41: GCC Pharmacovigilance Market Revenue (Billion) Forecast, by Application 2020 & 2033
- Table 42: South Africa Pharmacovigilance Market Revenue (Billion) Forecast, by Application 2020 & 2033
- Table 43: Rest of Middle East and Africa Pharmacovigilance Market Revenue (Billion) Forecast, by Application 2020 & 2033
- Table 44: Global Pharmacovigilance Market Revenue Billion Forecast, by Clinical Trial Phase 2020 & 2033
- Table 45: Global Pharmacovigilance Market Revenue Billion Forecast, by Service Provider 2020 & 2033
- Table 46: Global Pharmacovigilance Market Revenue Billion Forecast, by Type of Reporting 2020 & 2033
- Table 47: Global Pharmacovigilance Market Revenue Billion Forecast, by End User 2020 & 2033
- Table 48: Global Pharmacovigilance Market Revenue Billion Forecast, by Country 2020 & 2033
- Table 49: Brazil Pharmacovigilance Market Revenue (Billion) Forecast, by Application 2020 & 2033
- Table 50: Argentina Pharmacovigilance Market Revenue (Billion) Forecast, by Application 2020 & 2033
- Table 51: Rest of South America Pharmacovigilance Market Revenue (Billion) Forecast, by Application 2020 & 2033
Frequently Asked Questions
1. What is the projected Compound Annual Growth Rate (CAGR) of the Pharmacovigilance Market?
The projected CAGR is approximately 8.65%.
2. Which companies are prominent players in the Pharmacovigilance Market?
Key companies in the market include ArisGlobal, Laboratory Corporation of America Holdings, Cognizant, PAREXEL International Corporation, IBM Corporation, Wipro Ltd*List Not Exhaustive, ICON PLC, Accenture, BioClinica, Linical Accelovance, IQVIA, TAKE Solutions Ltd, ITClinical, Capgemini, United BioSource Corporation.
3. What are the main segments of the Pharmacovigilance Market?
The market segments include Clinical Trial Phase, Service Provider, Type of Reporting, End User.
4. Can you provide details about the market size?
The market size is estimated to be USD 7.23 Billion as of 2022.
5. What are some drivers contributing to market growth?
Increasing Drug Consumption and Drug Development Rates; Growing Incidence Rates of Adverse Drug Reaction and Drug Toxicity; Increasing Trend of Outsourcing Pharmacovigilance Services.
6. What are the notable trends driving market growth?
The Pharmaceutical Companies Segment is Expected to Hold a Major Market Share.
7. Are there any restraints impacting market growth?
High Risk Associated with Data Security; Lack of Global Regulatory Harmonization and Lack of Data Standardization for Adverse Event Collection.
8. Can you provide examples of recent developments in the market?
In February 2022, Cognizant entered into a partnership with Medable Inc. to jointly deliver clinical research solutions based on Medable's software-as-a-service platform for decentralized clinical trials.
9. What pricing options are available for accessing the report?
Pricing options include single-user, multi-user, and enterprise licenses priced at USD 4750, USD 5250, and USD 8750 respectively.
10. Is the market size provided in terms of value or volume?
The market size is provided in terms of value, measured in Billion.
11. Are there any specific market keywords associated with the report?
Yes, the market keyword associated with the report is "Pharmacovigilance Market," which aids in identifying and referencing the specific market segment covered.
12. How do I determine which pricing option suits my needs best?
The pricing options vary based on user requirements and access needs. Individual users may opt for single-user licenses, while businesses requiring broader access may choose multi-user or enterprise licenses for cost-effective access to the report.
13. Are there any additional resources or data provided in the Pharmacovigilance Market report?
While the report offers comprehensive insights, it's advisable to review the specific contents or supplementary materials provided to ascertain if additional resources or data are available.
14. How can I stay updated on further developments or reports in the Pharmacovigilance Market?
To stay informed about further developments, trends, and reports in the Pharmacovigilance Market, consider subscribing to industry newsletters, following relevant companies and organizations, or regularly checking reputable industry news sources and publications.
Methodology
Step 1 - Identification of Relevant Samples Size from Population Database


Step 2 - Approaches for Defining Global Market Size (Value, Volume* & Price*)

Note*: In applicable scenarios
Step 3 - Data Sources
Primary Research
- Web Analytics
- Survey Reports
- Research Institute
- Latest Research Reports
- Opinion Leaders
Secondary Research
- Annual Reports
- White Paper
- Latest Press Release
- Industry Association
- Paid Database
- Investor Presentations

Step 4 - Data Triangulation
Involves using different sources of information in order to increase the validity of a study
These sources are likely to be stakeholders in a program - participants, other researchers, program staff, other community members, and so on.
Then we put all data in single framework & apply various statistical tools to find out the dynamic on the market.
During the analysis stage, feedback from the stakeholder groups would be compared to determine areas of agreement as well as areas of divergence